Analytics Interface
Analytics provide organizations with the ability to capture and analyze authentication traffic occurring within their Active Directory environments in real-time to detect patterns of behavior and scenarios relating to attacks and attempts to compromise security.
An Analytic is basically a hard-coded policy. Instead of reporting on individual events, it reports on incidents that are triggered by those events.
Once an Analytic is configured and enabled, the Agent begins monitoring for events. Each event is stored in the Agent memory until the trigger threshold is met. Then an incident is logged in the database along with the event details that triggered the incident. Events that do not trigger an incident are discarded from memory after the corresponding time range.
The tables below outline the authentication analytics Threat Prevention provides out-of-the box, along with definitions and examples to better understand each analytic.
Click Analytics in the left pane to launch the Analytics interface.
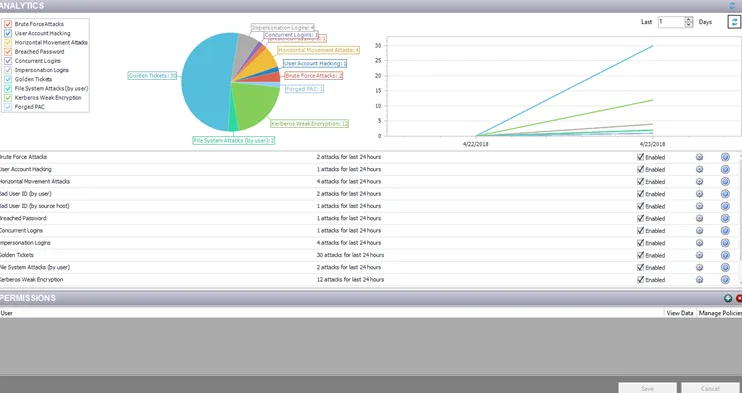
At the top of the interface is a graphical display of incidents monitored by Threat Prevention. Use the color key on the left to toggle off and on results for desired analytics. In the upper-right corner, set the number of days’ worth of incidents the graphs display. Use the Refresh button in the graphics area to regenerate the graphs.
There are two graphs:
- Pie graph – Shows the percentage of incidents generated for each analytic type
- Line graph – Shows a timeline of incidents for each analytic type
In the middle of the interface, you can view a list of the analytic types, number of attacks identified in the last 24 hours per type, the ability to enable or disable monitoring, access to the analytic configuration, and a tool tip with a brief summary of the analytic.
RECOMMENDED: For most analytics, configure at least one filter before enabling an analytic type.
The Refresh button on the Analytics ribbon repopulates both the graphical display and the analytic list.
The Permissions section at the bottom of the interface allows you to protect Analytic policies at the Analytics node. Once a user is assigned permission, all analytic policies, configurations, and data are protected from any user not included in the permissions list. See the Protect Policies topic for instructions on how to protect analytic policies.
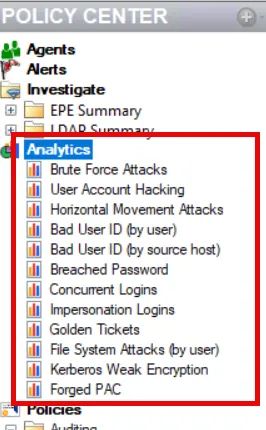
Directly under the Analytics node are the individual analytics nodes for accessing information on the monitored incidents and configuring the analytic type:
- Brute Force Attacks Analytic Type – Reports on failed attempts from a single host to access a given host. It can be triggered by different user accounts with bad passwords or invalid account names.
- User Account Hacking Analytic Type – Reports on multiple bad passwords provided for a given valid user account
- Horizontal Movement Attacks Analytic Type – Reports on security principals that are accessing more than the threshold of resources during a specified time interval. This may be indicative of a person trying to obtain information from as many servers as possible which they normally would not be accessing.
- Bad User ID (by User) Analytic Type – Reports on pre-authentication failures due to using account names that cannot be found in Active Directory. These incidents are grouped per account name.
- Bad User ID (by Source Host) Analytic Type – Reports on pre-authentication failures due to using account names that cannot be found in Active Directory. These incidents are grouped per source host.
- Breached Password Analytic Type – Reports on multiple failed authentications followed by a successful authentication in a specified time frame
- Concurrent Logins Analytic Type – Reports on logins from multiple locations within a specified time frame
- Impersonation Logins Analytic Type – Reports on multiple authenticated accounts from a single system within a specified time frame
- Golden Ticket Analytic Type – Reports on Kerberos tickets that exceed the specified maximum lifetimes for a user ticket or maximum lifetimes for a user ticket renewal
- File System Attacks (by User) Analytic Type – Reports on significant number of file changes made by an account in a short time period
- Kerberos Weak Encryption Analytic Type – Reports on Kerberos tickets with RC4_HMAC_MD5 encryption
- Forged PAC Analytic Type – Reports on Kerberos tickets with modified PAC