Host Investigation Dashboard
The Host Investigation dashboard only appears when a search is conducted. This can be done by clicking a computer-account hyperlink within the Source IP or Destination IP columns of a table card. Alternatively, type the complete host IP address in the Search box on the right side of the navigation bar.
The Host Investigation dashboard contains the following cards:
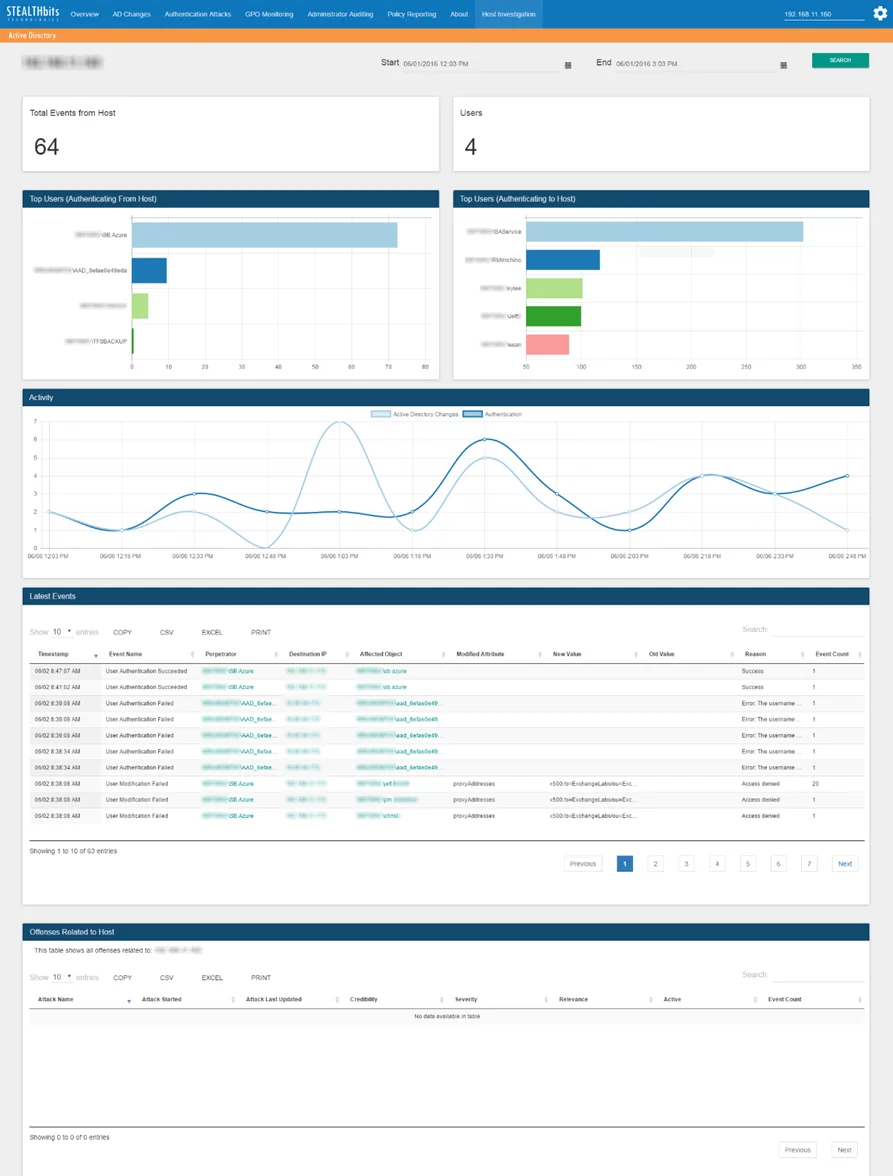
- Total Events from Host – Number of all events associated with the host over the specified time interval
- Users – Number of usernames associated with the host over the specified time interval
- Top Users (Authenticating from Host) – Displays up to the top five (5) users associated with the host (as source) over the specified time interval
- Top Users (Authenticating to Host) – Displays up to the top five (5) users associated with the host (as destination) over the specified time interval
- Activity – Timeline of all events associated with the host over the specified time interval. See the Graph Card Features topic for additional information.
- Latest Events – Tabular format of all events associated with the host that occurred over the specified time interval. See the Table Card Features topic for additional information.
- Offenses Related to Host – QRadar offenses associated with the host that occurred over the specified time interval. See the Table Card Features topic for additional information.
The time interval is identified in the upper-right corner with the Start and End boxes. This is set by default to the past three (3) hours. To search within a different interval, either manually type the desired date and time or use the calendar buttons to set the desired date and time interval. Then click Search to refresh the card data.
When a search using a time interval longer than twelve (12) hours is instigated, the database query is broken into multiple mini-queries. This will result in a visible reset of the dashboard display at the end of each mini-query until all data for the selected time interval has been retrieved.
Additionally, this feature allows you to scope the report data to just Threat Prevention collected events or to all information within QRadar for the selected host, which opens in another tab. Click Search and select Threat Prevention from the drop-down menu to refresh the card data or select QRadar from the drop-down menu to open the host’s List of Events.