Description
PingCastle Enterprise is a tool designed to improve and follow the Active Directory overall security level. This software has been developed to be compatible with most of the possible existing configurations. The goal (when the tool was created) was not to aim for perfection, but to provide reliable data to present the situation to the management, thus improving over time.
PingCastle built-in security
PingCastle Enterprise is a tool dedicated to improve the AD security, so security has been a major priority alongside every step of the creation and improvement.
First, the application has been designed in a framework where most common attacks such as XSS or SQL Injection are prohibited by design.
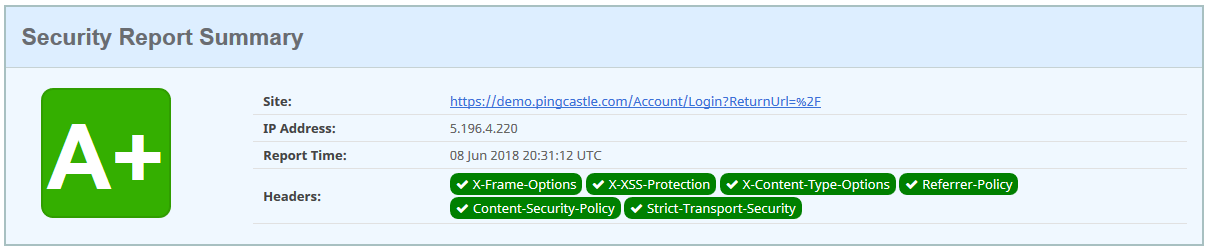
Because such protections can be sometimes avoided, the application has an additional layer of protection with all known HTTP security headers and including the header "Content Security Policy" in strict mode. That means that all the JavaScript code of the application is stored in separate files and that JavaScript included in the page via injection will not run in the browser. This protection can be checked via third party service such as "security headers". It means that "unsafe-inline" and "unsafe-eval" are not accepted.
The application uses enforced controls which force parameters to be checked twice against a model (in the browser then in the server application) and all queries to the database are parameterized. There is no SQL string built by the application.
Then each access to the database is verified by a filter which controls the data to be queried before a database query is sent. This code is tested by unit tests to lower the risk of a misconception in the filter.
The application is based mainly on the following frameworks:
-
asp.net core 3.1
-
bootstrap 4
-
jQuery 3
-
vis.js
-
chart.js
The up-to-date list of explicit components can be seen in the about page of the application.
Authentication and user management
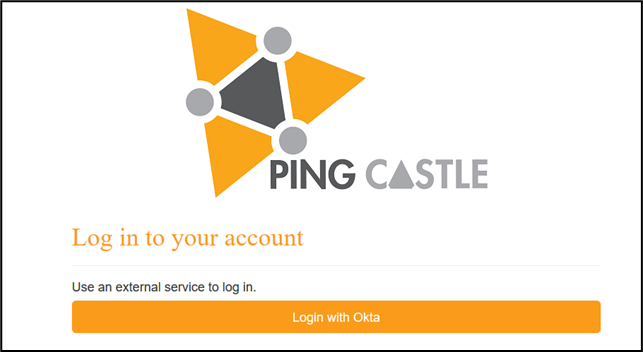
PingCastle Enterprise provides by default two mechanisms for authentication: classic login password and external authentication. The external authentication allows to use widely supported providers such as Azure AD, Google, or professional web SSO such as Okta.
These methods can be used separately or in coordination, meaning you can either use a Dual-Factor authentication (recommended) or a single factor authentication.
If the password authentication must be disabled, the setting "disablePasswordLogin" should be set to on. OpenID is automatically enabled if the OpenID section is completed in the "appsettings.json" file.
Authentication using OpenID:
Authentication using login/password:
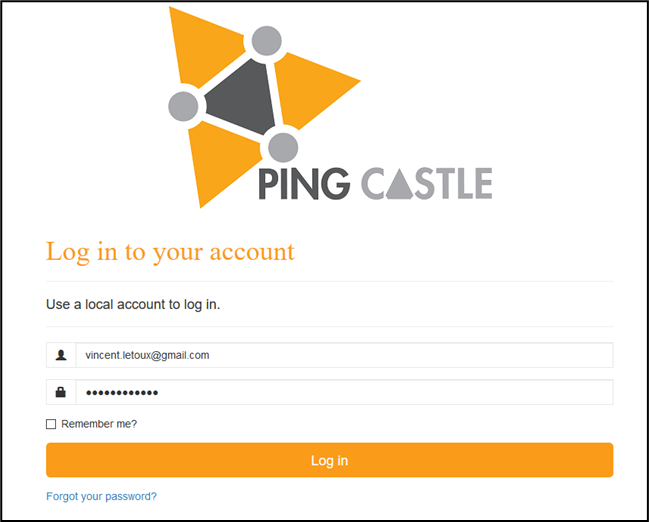
Note: When the login / password method is configured (by default), a password recovery mechanism by email and a two-factor authentication method are provided.
Authorization
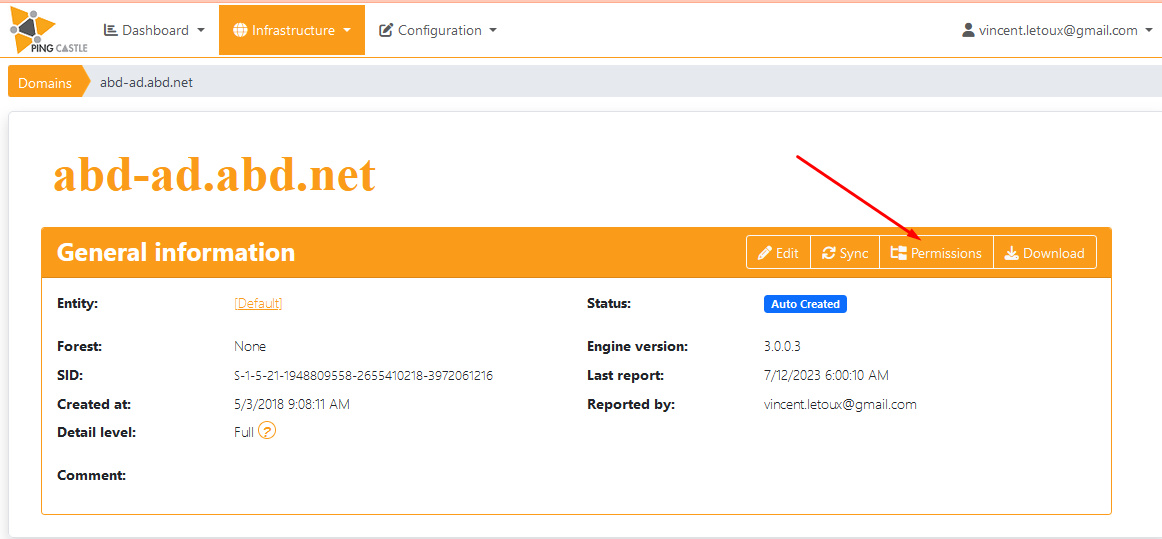
Ping Castle allows to setup permissions on Entities, or objects (Domains or AzureAD)
The permissions can be set on the detail of the Entities
And on the Domain / AzureAD objects
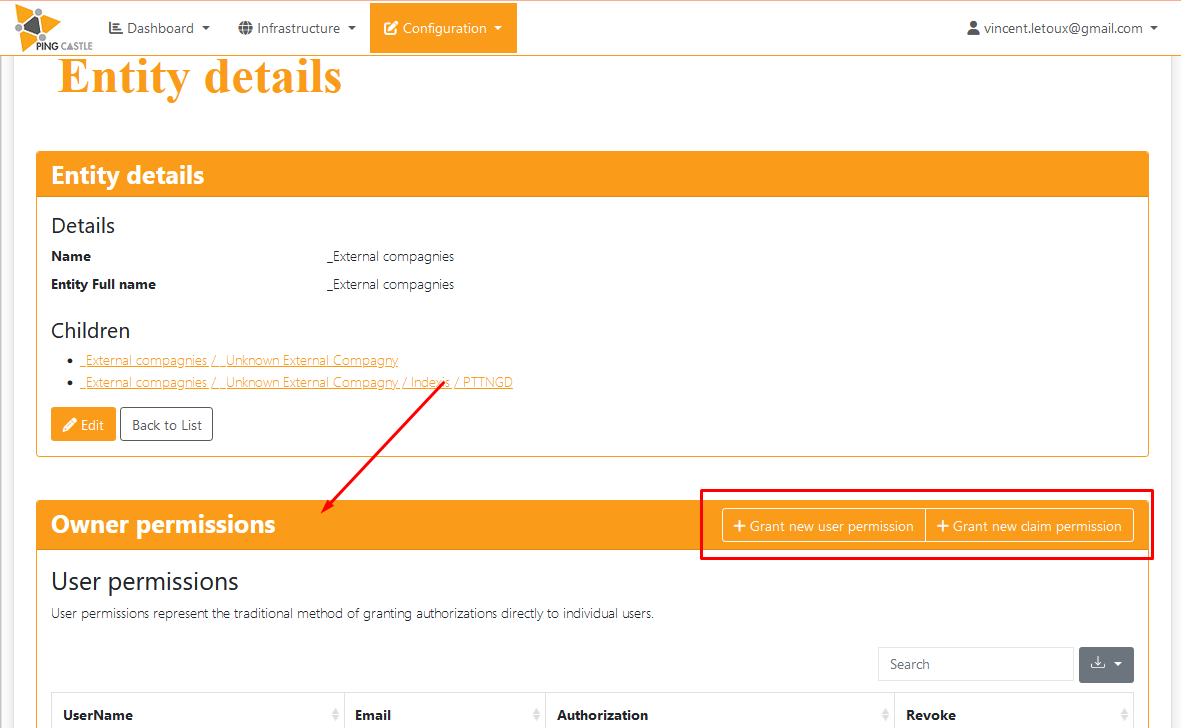
The permissions are of 2 types:
- the classic user assignment where users are assigned to objects.
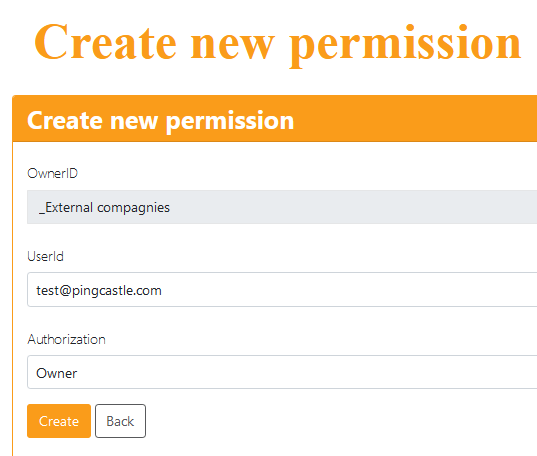
- using claims permissions
In this case, the user rights are managed dynamically based on the claims submitted by the authentication application (Windows, OpenID, Saml2, ...)
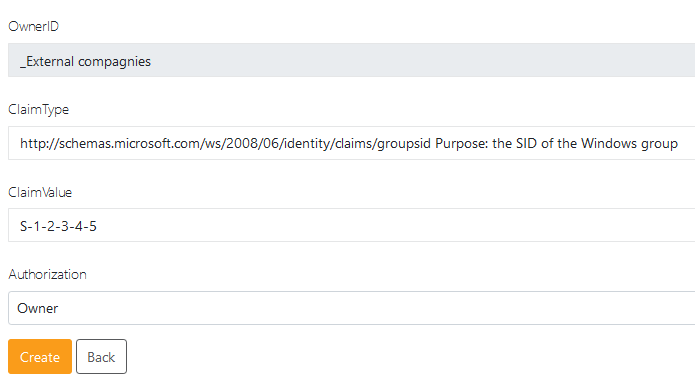
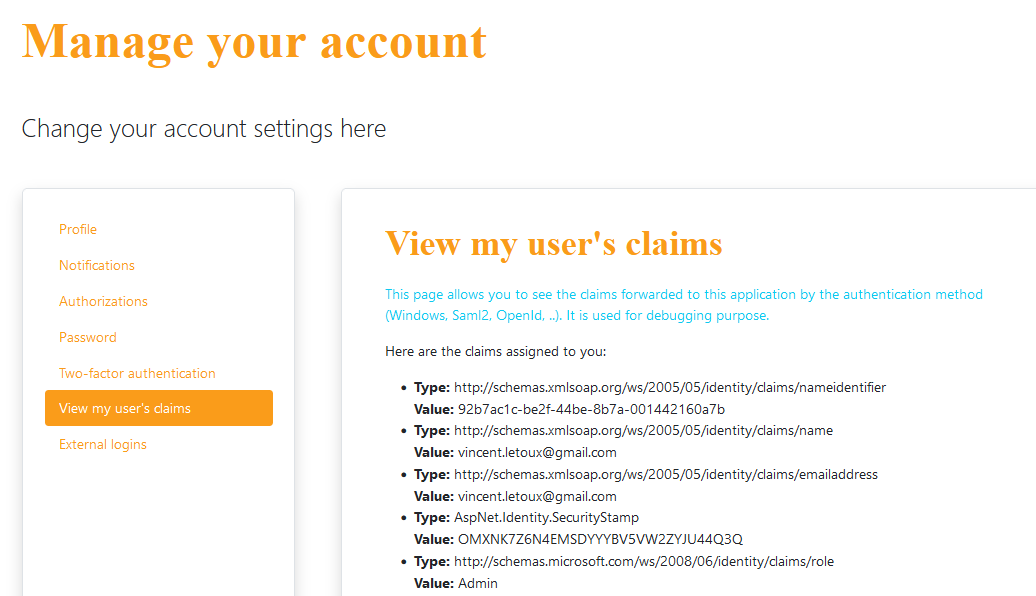
Claims permission is the way to assign dynamically permissions based on Windows group. Be advised that the claims are case sensitive. You can also open the "View my user's claims page in "Manage your account" to see what claims have been pushed to Ping Castle.
Ping Castle Enterprise features
Main pages overview
The application is divided is 4 different areas:
-
The management view
-
The technical view
-
The configuration
-
The account / user management
Configuration
Account / User management
Technical view
Management view
Each view is dedicated to a certain kind of audience, which is defined by the role each stakeholder has.
Role-Based Access and Permission Structure
The PingCastle Enterprise solution uses a structured permission model based on roles, entities, and domains to control access to data and administrative features.
User Roles and Views
The solution defines several user roles, each with specific access rights:
-
Active Directory (AD) Administrators should typically only access the Technical view ("Infrastructure")
-
Organizational Management may access both the Management and Technical views ("Dashboard" and "Infrastructure")
-
The PingCastle Enterprise Main Administrator has full access, including:
-
Configuration View -- Used for advanced customization of the solution
-
Account / User Management View -- Used to manage user roles and permissions
-
- All users can access their personal account settings. In addition, internal users can reset their password if password-based authentication is enabled.
Permission Levels
The product implements three main layers of permission:
-
Roles -- Used to assign specific administrative capabilities. The "Admin" role grants full access to all system data and features.
-
Entities -- Group multiple domains and are the only way to delegate access to the Dashboard. Assigning a user to an entity grants access to:
-
All domains within that entity
-
The dashboard and associated management views
-
-
Domains -- Represent the lowest level of access. A user with domain-level access can only view reports for that specific domain. They do not have access to other domains or to the dashboard unless assigned through an entity or elevated role.

Page organization
All the pages of the PingCastle Enterprise solution has been designed in order to be as clear as possible. It means that, when it is possible, the pages follow the same kind of architecture, enabling the users to quickly get used to the solution in general.
For instance, most pages can show "All data" available to the user or set up a filter to only see a more narrowed down set of data.
When a user does not have access to the root of the organization and have access to multiple area of the organization, the application display by default the first organization that the user can access.
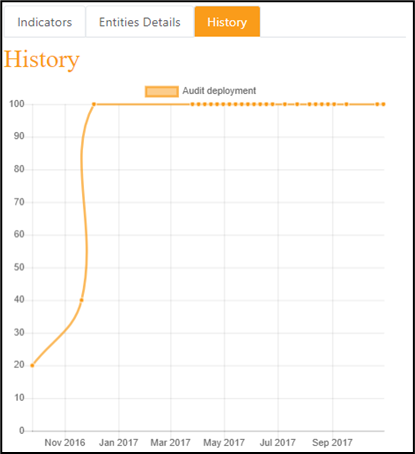
Following the same idea, most pages from the "Maturity Assessment" section are built in a common structure, allowing to visualize KPI efficiently
The main page contains the Indicators, while you can then have a breakdown of these KPI regarding the Entities, and a History of how the said KPI evolves since you first started monitoring them.
Management view ("Dashboards")
The dashboard view is divided in two areas: The "Maturity Assessment" and the "Advanced views".
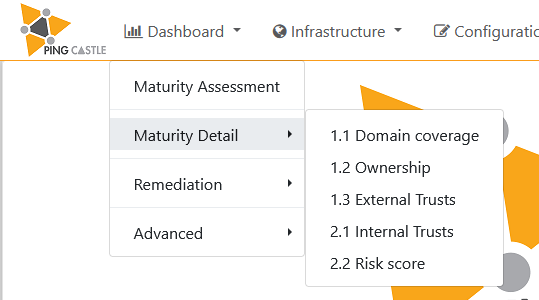
From this global page, you can then access detailed process for each step of the PingCastle maturity assessment (Domain Coverage, Ownership, etc.) while more detailed pages can be shown in the advanced menu.
This view is mainly dedicated for the company management, notably the "Maturity Assessment" part, as it will show KPI as well as Objectives and goals in order to improve the overall level of security of the AD.
Nonetheless, it can also be used by Technical stakeholder such as AD administrator, as it can greatly assist in the technical remediation. Indeed, a lot of detailed analysis can be performed through the "Advanced" section.
Maturity Assessment
Global view
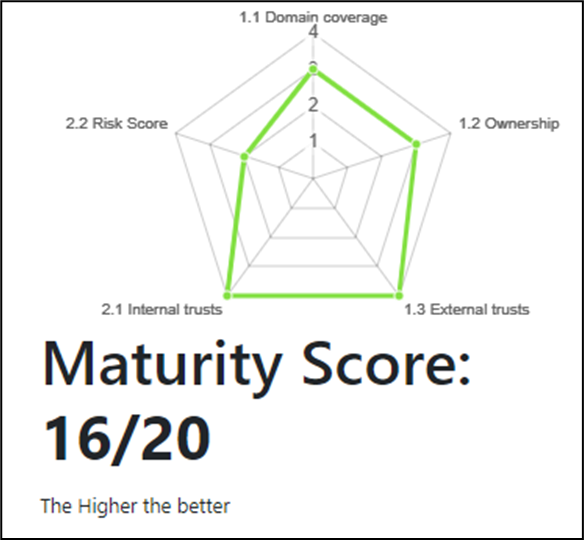
The "Maturity Assessment" is based on a maturity evaluation divided in several steps. To summarize, it consists 5 main areas, each containing 4 major measures, giving a total of 20 measures.
Each measure for which the company AD is compliant gives 1 point in the total, ending in a score on 20 that can be viewed in a radar chart.
To go into more details, this score is computed on the 2 first levels of the CMMI methodology applied to the AD:
Initial
-
Domain Coverage - ensure all domains have been reviewed
-
Ownership - ensure all domains have an owner and that this owner is doing its job
-
External Trusts - ensure all domains are not connected to external companies
Repeatable
-
Internal trusts - ensure that the risk of cross domain contamination is limited
-
Risk score - ensure that the local risk of contamination is limited
- Each of the measure have its own detailed page, in which you can find more information on how to improve the situation, and how to gain the associated "star".
A star is an indicator telling whether a single rule linked to a measure is raising an alert or not.
Detailed view of the maturity score:
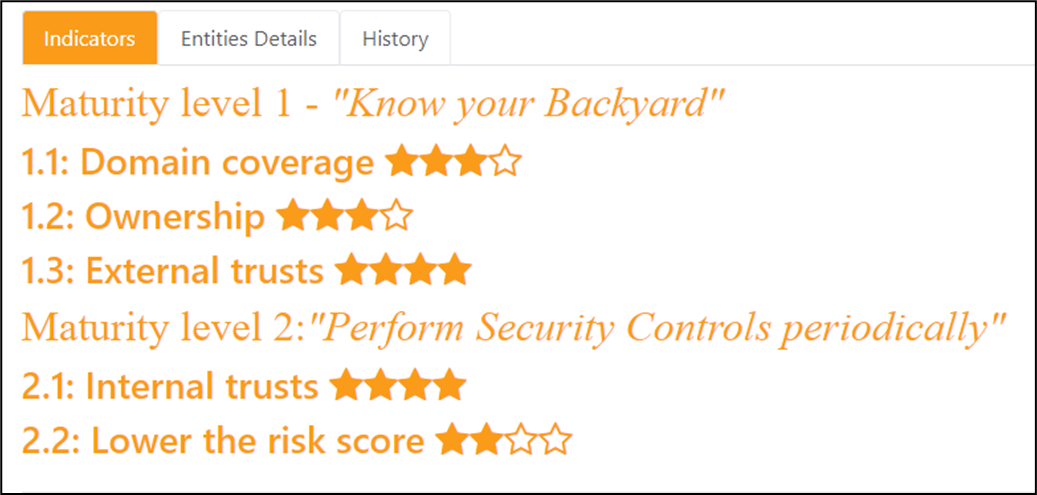
Detailed view of the breakdown for a major area:
- The purpose of these general pages is to assist users understand more fully the current level of protection of the company Active Directory.
It can be used to have an idea of the work performed as well as the work remaining to be done regarding the AD securing.
Then a button "Click here to get more details" is available to switch to a more detailed dashboard.
Area maturity dashboard
This section covers the following pages:

- The purpose of these general pages is to assist users understand more fully the current level of protection of the company Active Directory.
It can be used to have an idea of the work performed as well as the work remaining to be done regarding the AD securing.
Detailed view per area
Each area has its dedicated page, with a lot of information regarding what is being well done and what can be improved.
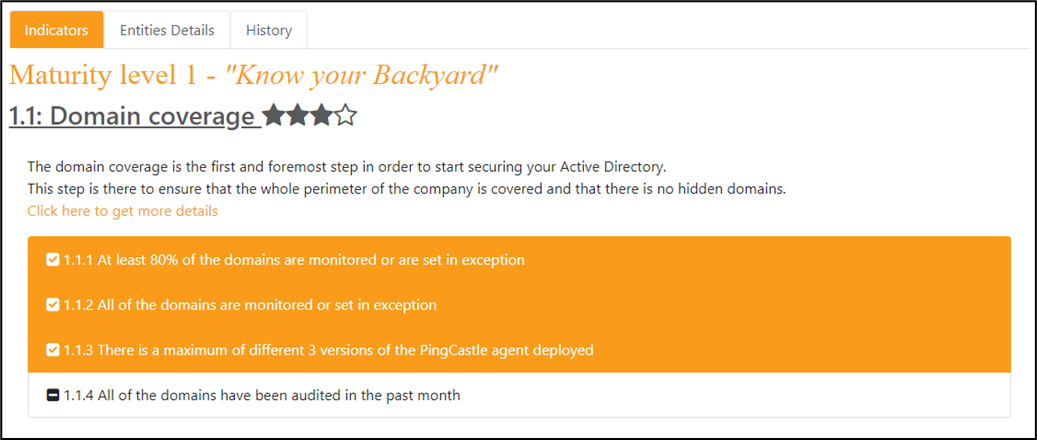
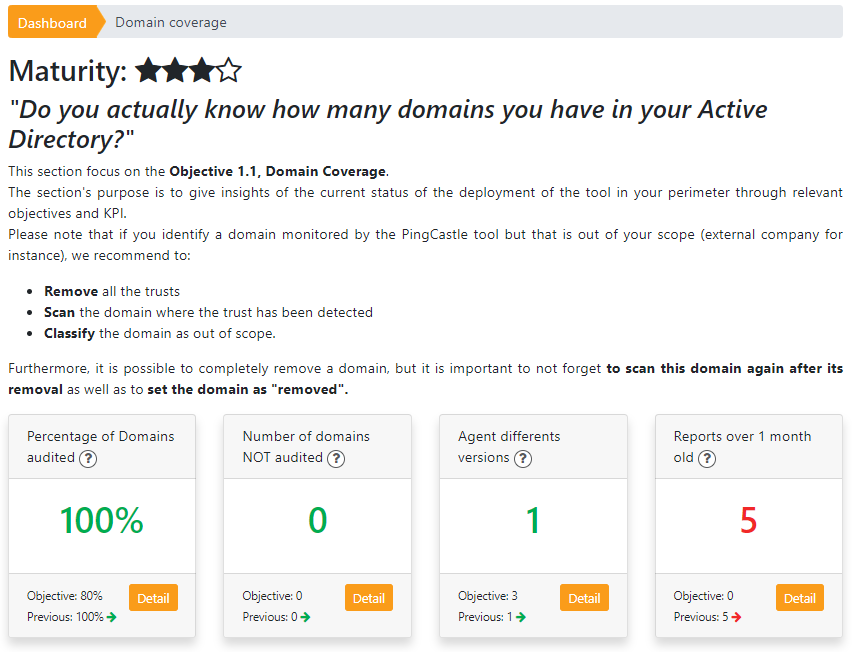
The first section of the page always shows a global explanation of the objective of the area.
Then, it displays a few KPI which are composing the maturity evaluation. If the objective is reached, the KPI is in green color, else its color is red. A "Detail" button allows to directly reach the technical view, with extra advanced information on how to remediate and improve the KPI.
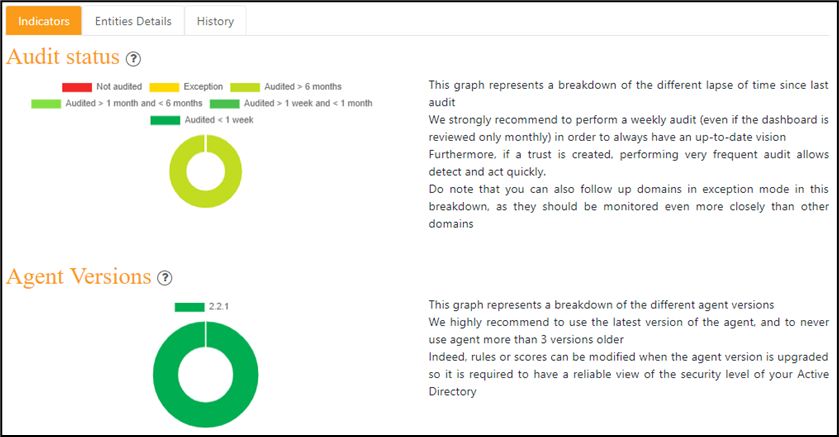
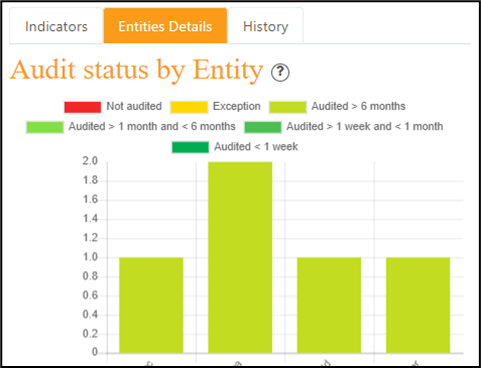
- The second section offers different kind of detailed information in different tabs.
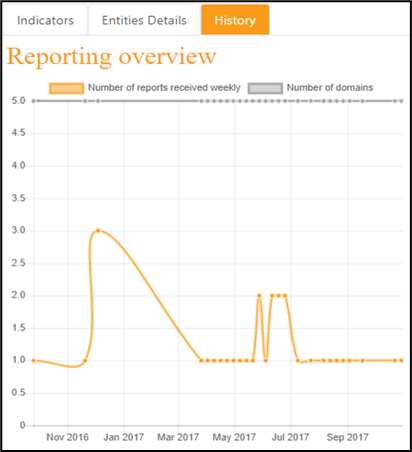
This information can be a couple of indicators that help understand a bit more the situation, a breakdown of the information shown by entity within the selected perimeter, or an history graph representing how the KPI evolved in the past.
Each chart is dynamic, and a category can be filtered out by clicking on it in the legend.
Moreover, a click on certain data can forward you directly to the page containing the data that were used to elaborate the chart.
Indicators for the related tab:
Entities Details for the related tab:
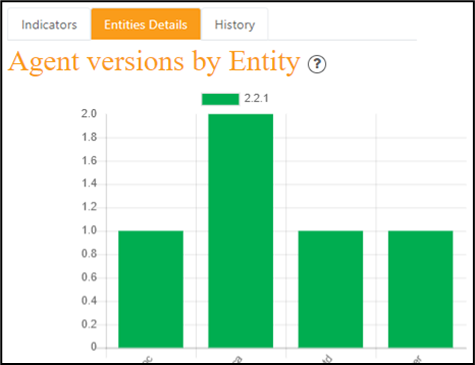
Entities Details for the related tab:
Remediation / Rule Matrix
The "Rule Matrix" view represents a feature that aggregates every rule used in the 4 categories to calculate the Global Risk score. Through that feature, you can efficiently identify what are the main points of failure within your Active Directory, and then put in place the associated remediation plan.
It takes the form of a double entry table, with on one side all the domains within your perimeter, and on the other side all the rules and if they are OK or not. It can be filtered to only show relevant information (a.k.a. what affects your security negatively), and it can also be download in CSV format.
This dashboard is used to setup a taskforce and a remediation project.
The first view is a matrix where there are all the rules in columns and all the domain in lines.
It should be noticed that global problems will be reflected as a vertical line (it impacts a rule) and local problems will be reflected as a horizontal line (it impacts a domain).
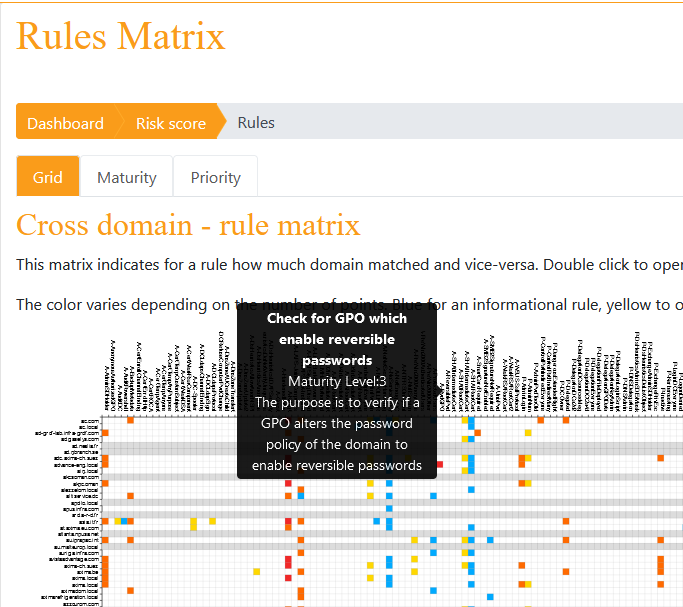
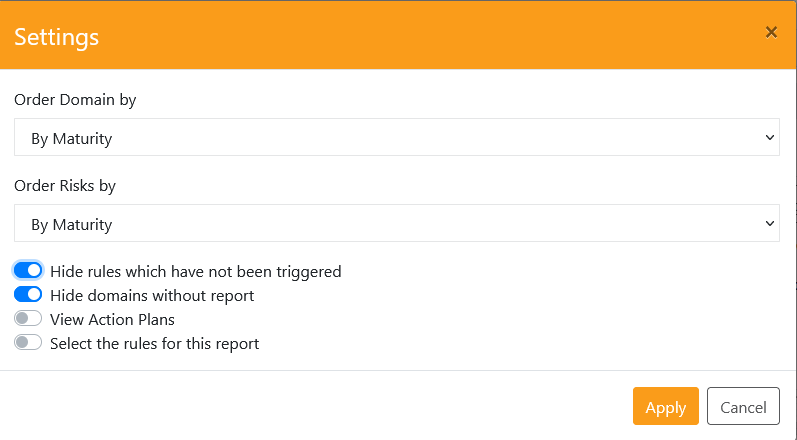
PingCastle recommends working on a unit consisting of 10 to 15 domains. Once the selection is done, PingCastle recommends ordering the items by Maturity levels and to remove the bank items.
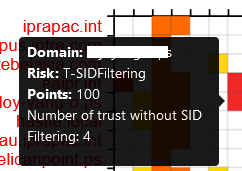
The result is then a 15 to 20 matrix where all colored items are a rule which matched.
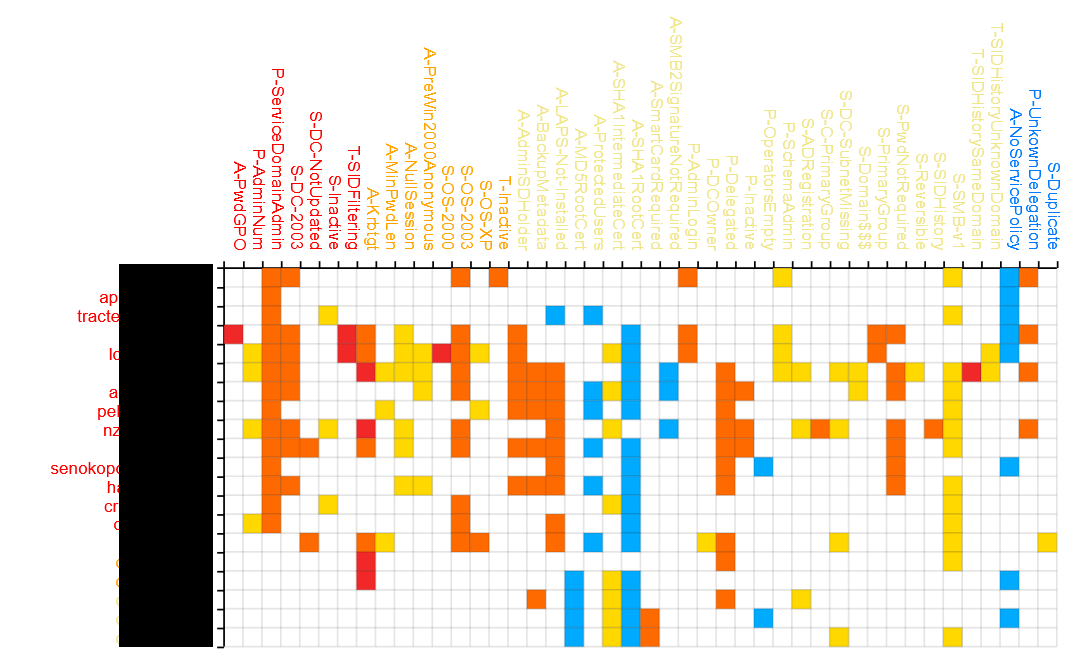
The detail can be viewed by pointing on the cell and a click forwards the user to the detail of the report.
Please note that the "View Action Plans" option changes the color of the items and enable the user to see quickly what the status of the action plan are. Typically, the first step of a remediation will be to request domain owners to setup an action plan without enforcing it.
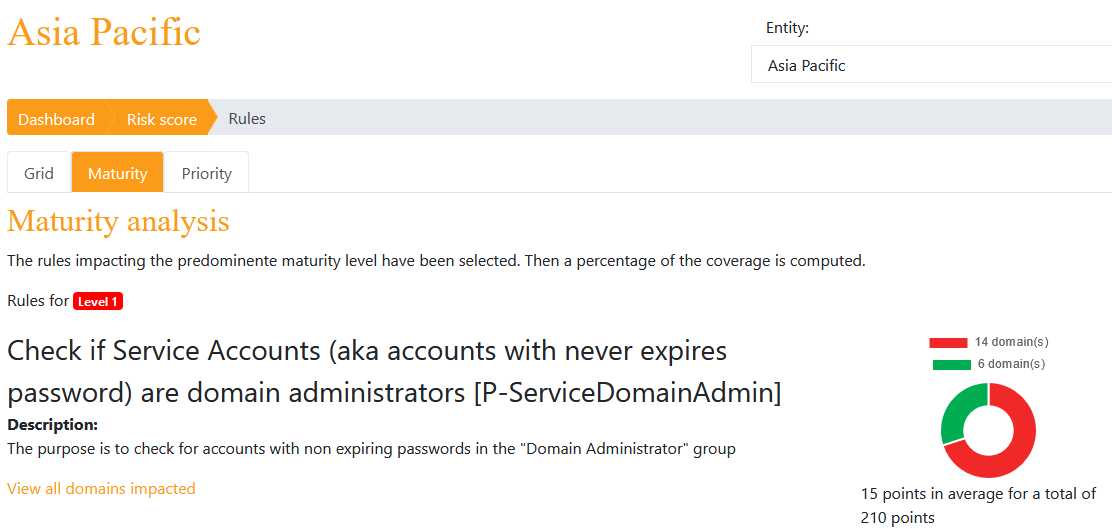
To see the top rules that need to be fixed to improve the maturity or the score, a selection of the 2 tab "Maturity" or "Priority" enables the user to see the data.
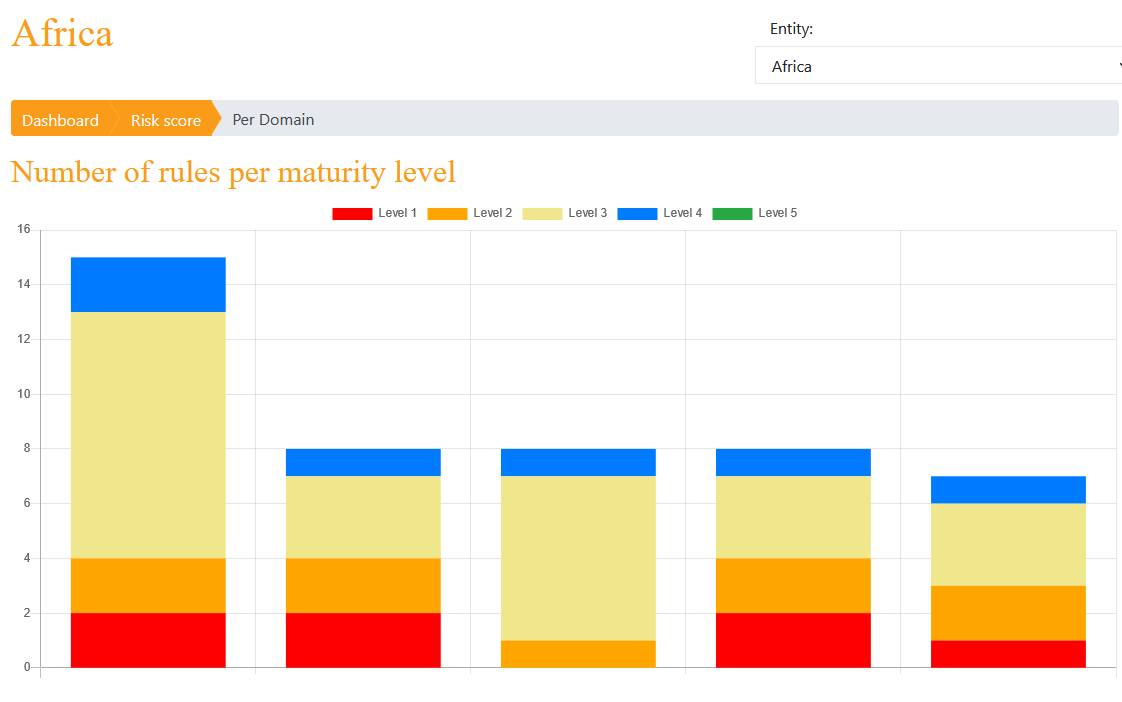
Remediation / Maturity per domain
This view allows the user to compare the number of rules per domain in a select entity.
Advanced
The "Advanced" part of the Dashboard is composed of a multiple of extra utilities that can assist you in understanding your current level of AD security as well as how to improve it
It consists of the following pages:
Report Analysis
Consolidation of all the possible reports that PingCastle Enterprise can generate with the information it has in the selected perimeter. There are a lot of features enabling the user to filter data if needed. Additional reports may be added in the future or if requested.
Staled Objects
The "Staled Objects" are one of the 4 main components of the Risk Score (the 2.2 area)
This section will give a lot of details on how the Stale Objects influence your overall Risk Score, as well as guidelines on how to reduce the risk and improve the overall Risk Score.
Privileged accounts
The "Privileged accounts" are one of the 4 main components of the Risk Score (the 2.2 area)
This section will give a lot of details on how the Stale Objects influence your overall Risk Score, as well as guidelines on how to reduce the risk and improve the overall Risk Score.
Trusts
The "Trusts" are one of the 4 main components of the Risk Score (the 2.2 area)
This section will give a lot of details on how the Stale Objects influence your overall Risk Score, as well as guidelines on how to reduce the risk and improve the overall Risk Score.
Anomalies
The "Anomalies" are one of the 4 main components of the Risk Score (the 2.2 area)
This section will give a lot of details on how the Stale Objects influence your overall Risk Score, as well as guidelines on how to reduce the risk and improve the overall Risk Score.
Technical view ("Infrastructure")
The technical view also named "Infrastructure" is based on a list of domains and its data.
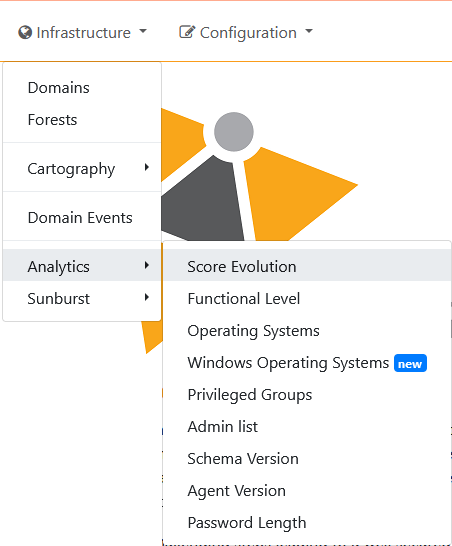
The list of domains is shown in the "Domains" page and a "Forests" page exists where only forests containing more than 2 domains are listed.
Then cartography pages are used to explore the topology of the area monitored.
- Pages with more detailed analysis such as domain events or analytics can show data from cross domain to investigate specific questions.
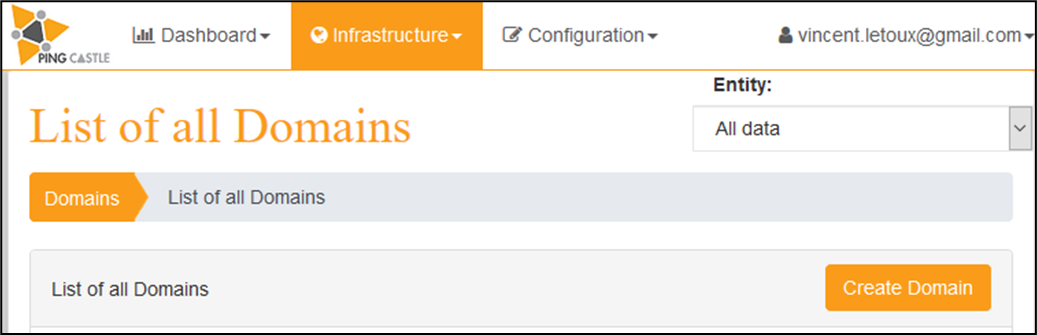
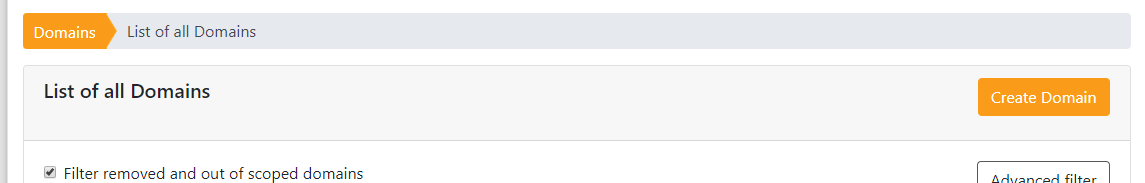
Domains
List of domains
The objective of this page is to display the list of all the domains in the perimeter. This list can be filtered based on parameter to switch between the management view and the technical view. This filter can be customized by clicking on "Advanced Filter". The "Search" function can be used to dynamically filter domains based on name, SID or Entity.
Furthermore, by default, Domains with status Removed or Out of scope are filtered by default.
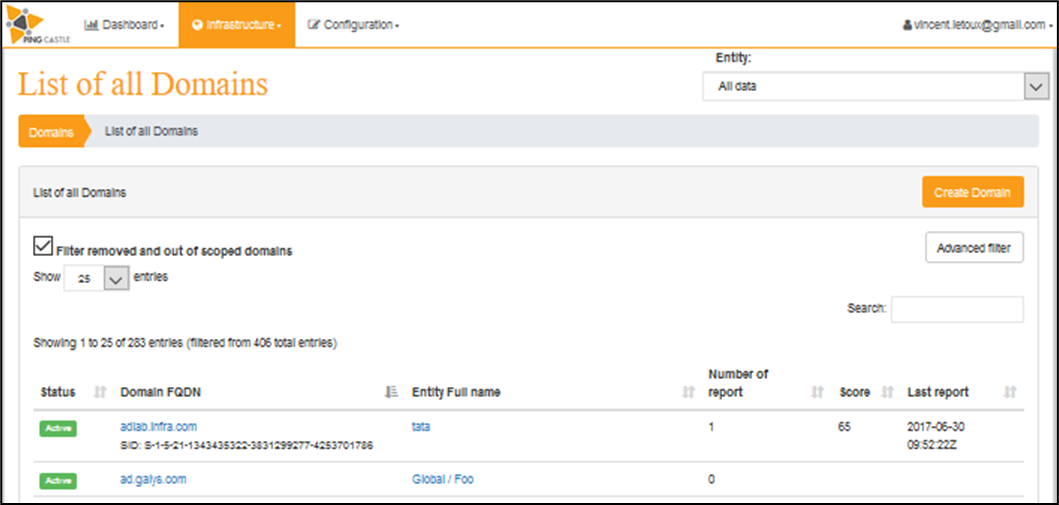
A click on the domain open the domain view and a click on the entity full name open the management view for the entity.
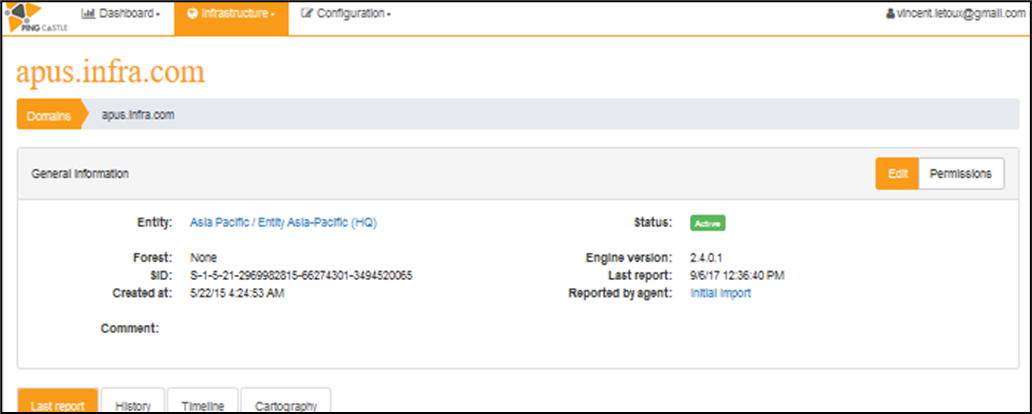
Detail information on a domain
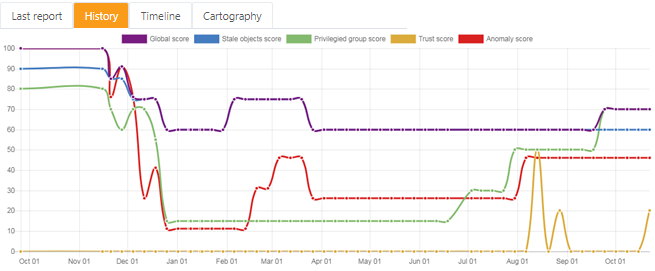
This view displays detailed information on the domain, as well as many other information such the results of the last report, some history, timeline and cartography. This can be modified by selecting a tab.
Last report tab:
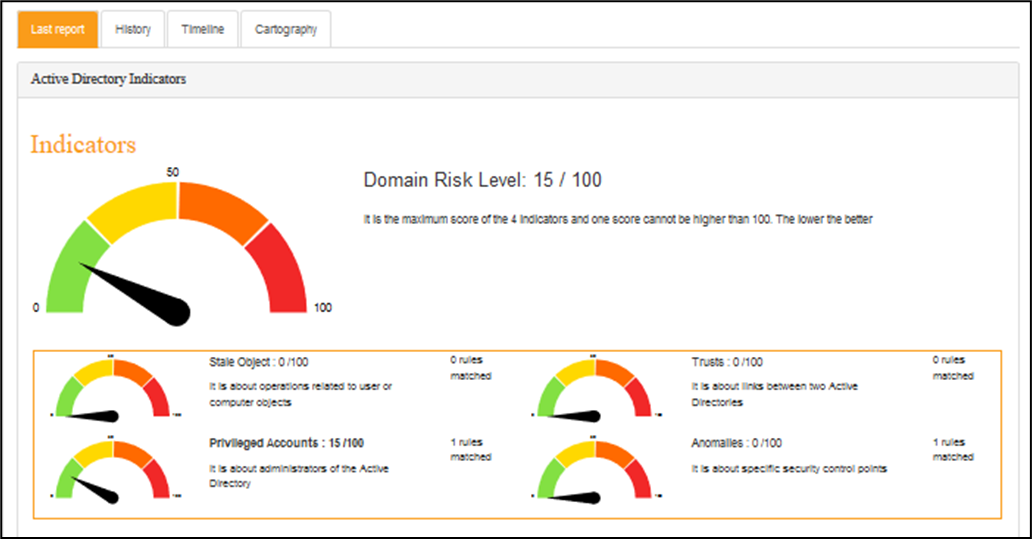
The full detail of the last report performed is accessible in this tab, though it is not shown here.
By default when there is a list of users, the output is limited to 100 users.
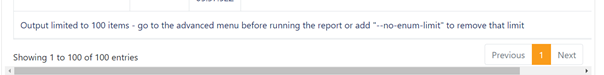
This limitation has been introduced to not have large html page and block the navigation.
The recommended solution to overcome this limit is to use the local PingCastle client and to export the list of accounts needed for detailed analysis.
This export produces a csv file with the user or computer name and many properties such as the creation date or operating system as seen by PingCastle.
The other alternative is to set the setting MaxNumberUsersInHtmlReport at the root of the appsettings.Production.json file to any other value (default to 100)
History tab:
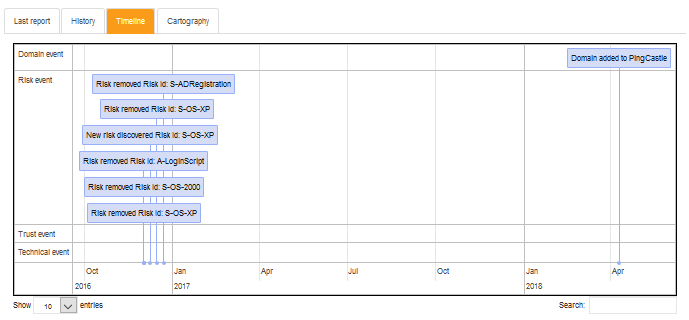
Timeline tab:
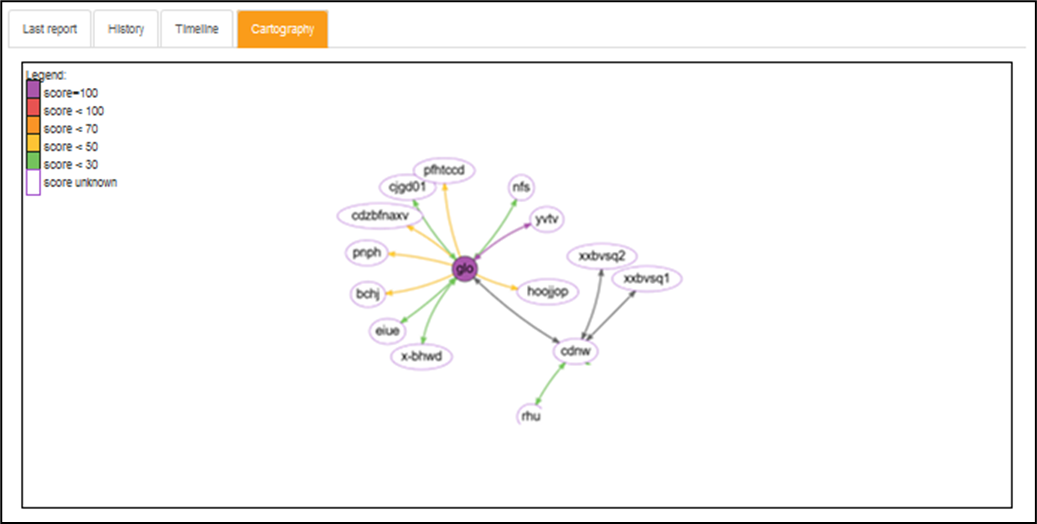
Cartography tab:
Creation and suppression of a domain
There are two ways to create a Domain in PingCastle Enterprise:
-
Automatic creation is performed when a report is imported within the solution. Its status is then automatically set on "Auto-Created", which is something that needs to be changed manually (see the "Status" chapter for more details)
-
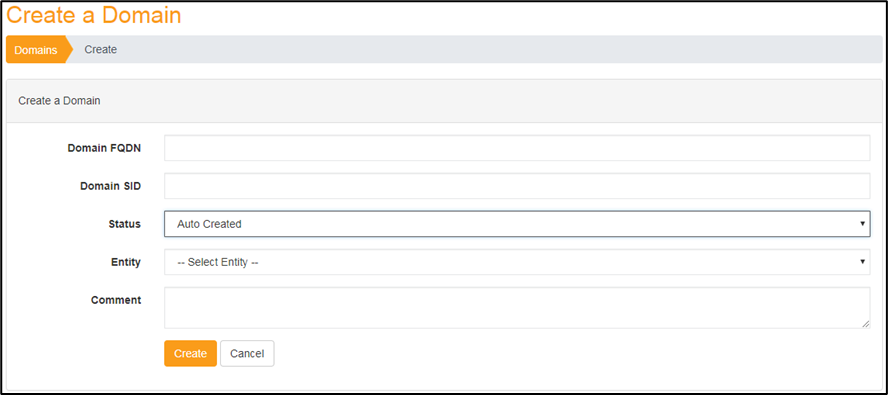
Manual creation of a domain, when you want to import a report for this domain for instance. It is done by clicking on the related button.
It brings the user on a page with information that needs to be filled :
-
Domain FQDN(*): Name of the domain. If you want to import related to this domain, it is best to set the same name so the information will be updated automatically
-
Domain SID: Only used to differentiate rare cases where two domains have the same FQDN. Status: Status of the domain, that need to be modified by the user when needed. See next chapter for full explanation
-
Entity: Entity to which the created domains belongs. Assigning entities to domains can greatly help managing very large forest of AD, especially when there are multiple actors dedicated to specific entities
-
Comment: Possible comment to have more information on the domain
A domain cannot be hard-deleted (unless it has been added manually by mistake, meaning that it is in no way connected to any other existing domain or report). Though, it is possible to soft delete a domain by changing its status.
Status of a domain
The status of the domain is managed using a basic lifecycle, as shown in the graph below.
The default status is "Auto Created", and every change must be done manually when required.

-
Auto Created: The domain has been created automatically by the PingCastle Enterprise solution, which means it is connected to another domain which you are monitoring. It is mandatory that you act on this domain status, as the "Auto Created" status should not remain.
-
Active: Normal status of a domain when it is monitored by the PingCastle Enterprise solution
-
Derogation: Special status used to identify domains that will be ignored in the statistics and score calculation. This should be use cautiously and only in very specific cases, such as when a domain is being deleted or during a migration.
-
Removed: Status used to simulate a hard-deletion. This status should be set when the domain no longer exists within your AD.
-
Out of Scope: Status used to simulate a hard-deletion. This status should be set when the domain is no actually belonging to your organization and should not be followed by your company.
Forest
A Forest is a set of domains, containing a root and child domains. When a child domain is discovered, the root domain is set as a root of a forest and is displayed in the Domains -> Forests. A list of forest discovered is displayed and a special view is available.
- This area allows you to have a clearer idea of how the domains are interconnected with each other.
Cartography
Navigation
Each cartography can be used to navigate between domain. A mouse over on a domain displays a tooltip containing many information regarding the domain like its score or its entity. A double click opens the domain if the user is authorized to access to it.
The cartography is domain relative, which means that one cartography is created for each report. Doing so, PingCastle Enterprise can display the list of all the domains that a specific domain can see.
Methodology used to build the maps
PingCastle is using the data included in the report from the most reliable source to the less reliable source, in the following order:
-
The most reliable source is domain where the report has been generated.
-
The tool is using direct trust data.
-
The tool is using forest trust information. This information is located in the msDS-TrustForestTrustInfo attribute of a forest trust and in the partition element of the configuration binding context.
-
The tool is using the information provided by the domain locator service when examining trusts. This information can add the Netbios name or the forest name of a trusted domain.
-
If the "reachable" option has been set when producing a report, the tool is using domain SID found (in foreign security principals or sid history) to query the domain locator service and guess forest trusts.
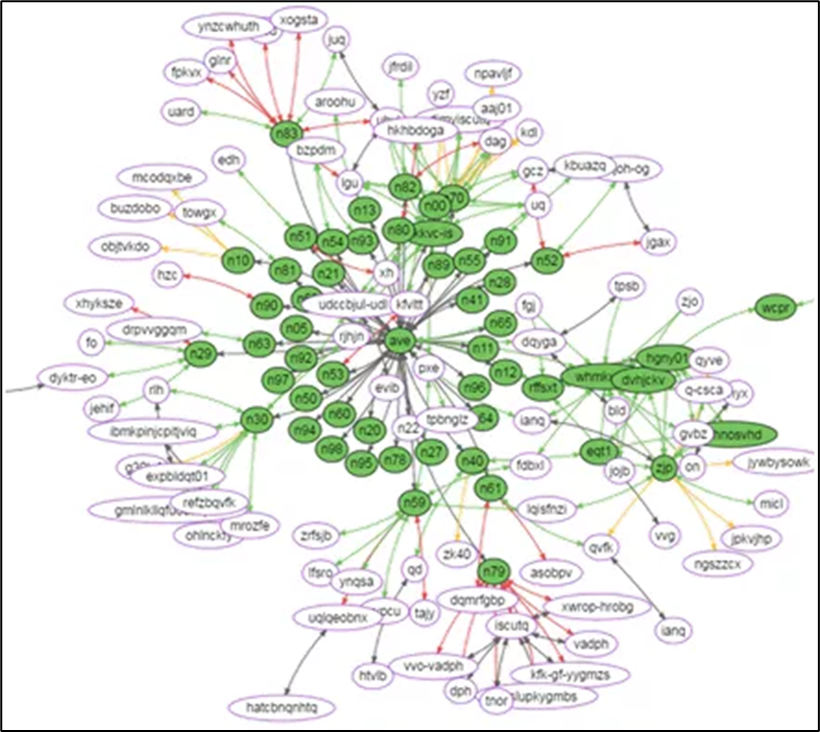
Detailed Cartography
A general cartography is available. It displays all the domains and its trust relationship that the user can see in its scope.
Simplified Cartography
Because the general cartography can be difficult to read, a simplified view exists. The program identifies by default the domain with the most trust relationships and put it at the center. Then it proceeds by radius by selecting its direct neighbors.
Therefore, only domains connected directly through one trust to the main domain are shown.
Domain events
This page allows to query any events which occurred on one or more domain and to filter then by type.
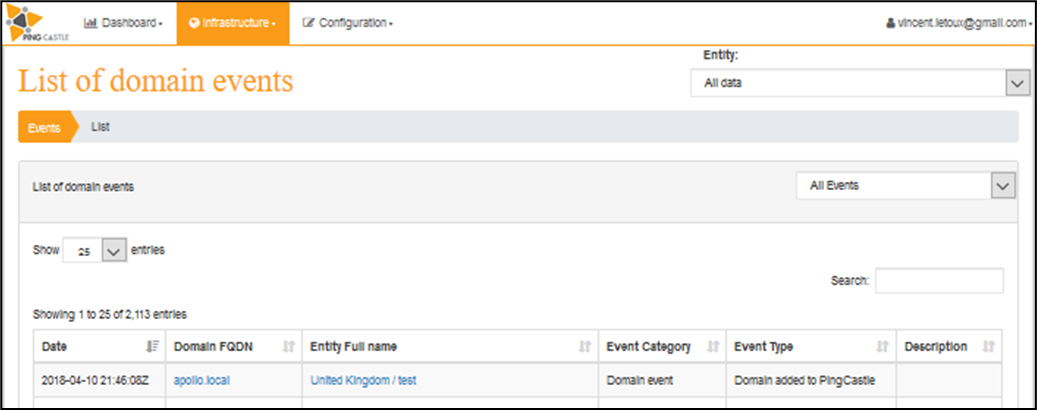
The events that you can view are the following:
Domain event:
There has been a change on a domain within a specific perimeter in the PingCastle Enterprise solution. It can be a domain that has been added by a user, a domain that has been discovered after importing a report, a status change, etc.
Risk event:
There has been a change in the risks followed by the PingCastle Enterprise solution. It either means that a new risk has been discovered and that it should be followed by the user, or that a risk has been cleared and that the overall level of security improved. It can also mean that a risk is set on an exception status.
Trust event:
There has been a change in the trust between several domains monitored. It implies that a new trust between two domains has been established, that an existing trust between two domains has been deleted, or even that an existing trust has been modified.
Technical event:
There has been a significant technical change modifying the global level of security, but which is not yet covered by the existing rules. This is a very rare event and it is not likely that you have this kind of event.
Tool configuration ("Configuration")
The "Configuration" view of the PingCastle Enterprise application allows the user to set up all the tool in order to be able to use it completely. It is also in this view that the user will be able to personalize settings so that the tool fits more the Company needs.
Entities
In the "Entities" page, it is possible to create and configurate the entities within the company.
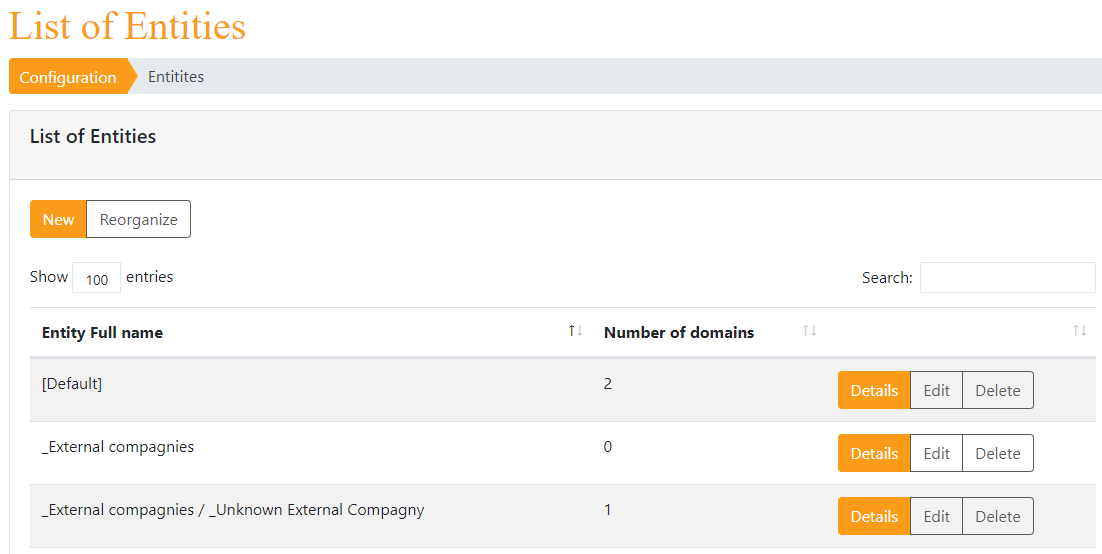
It is through entities that it is possible to best represent the company organization, so that the AD configuration matches the company configuration.
- It is also through entities that it is possible to identify administrator for specific perimeter, meaning that these administrators will be operating on defined domains.
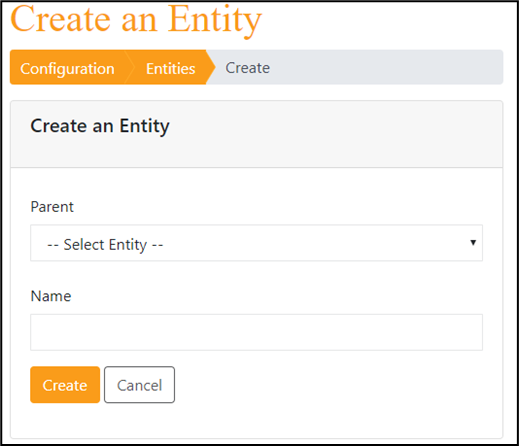
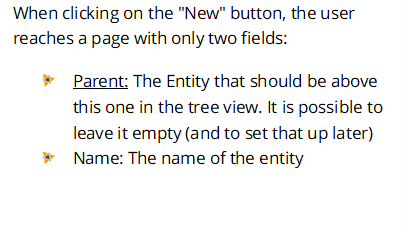
Add new entity
Reorganize the tree view of entities
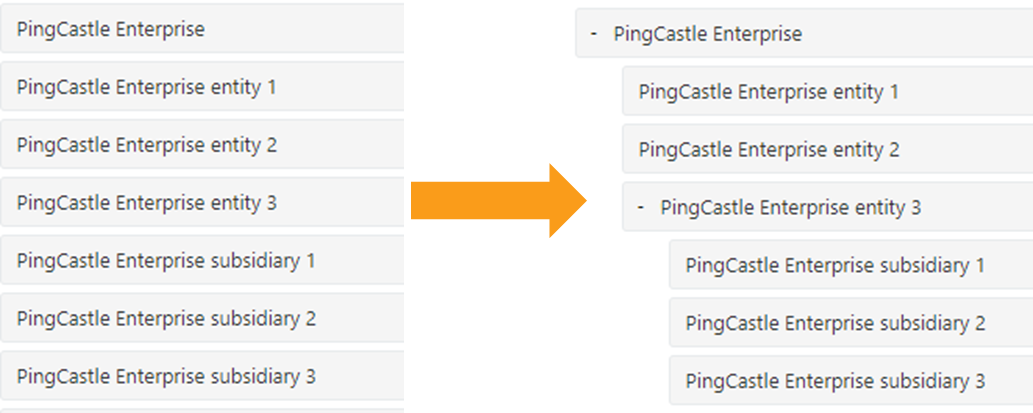
The PingCastle Enterprise solution proposes an ergonomic view to reorganize the various entities that may compose your Company. This view works through drag and drop to optimize user experience.
Example to show how to reorganize entities:
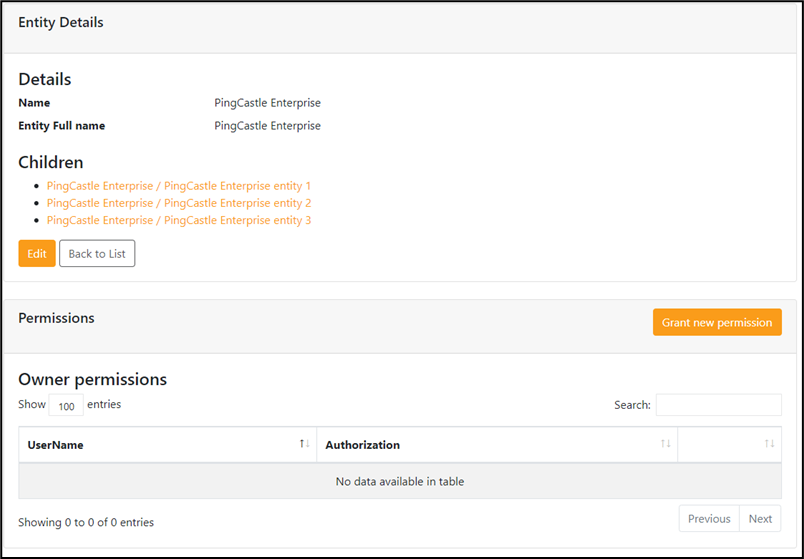
Details of an Entity
Each entity has a dedicated "Details" page that contains information. It is on this page that you can have access to all the information of the Entity, including the Owner permissions. It is also here that you can edit these rights, in order to establish which key people will be accountable for a specified entity.
For instance, the page for PingCastle Enterprise entity:
Action plans management
This part enables administrator to configure remediation schedule so it can be displayed into reports.
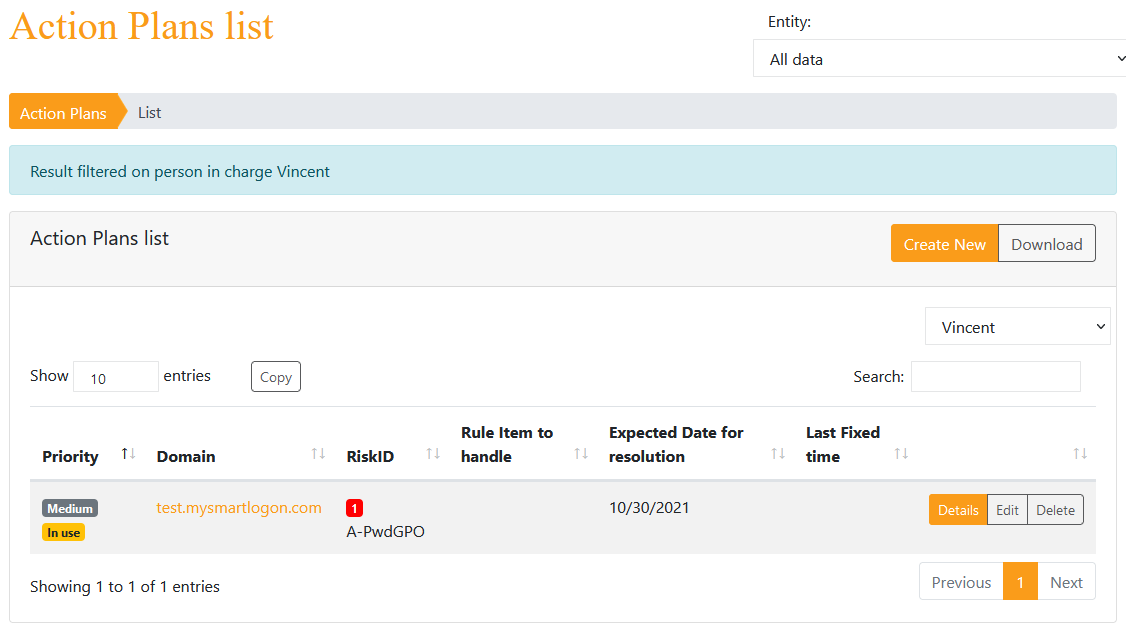
It is actionable directly in the domain details where the rules are being displayed:
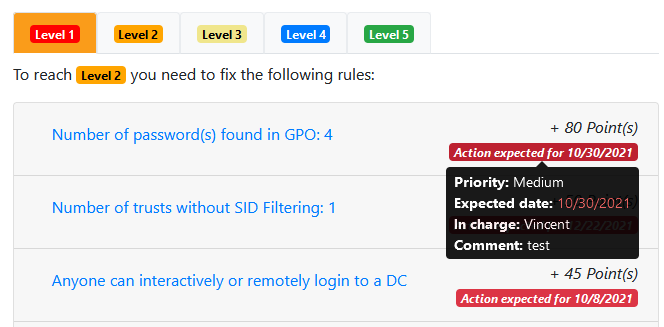
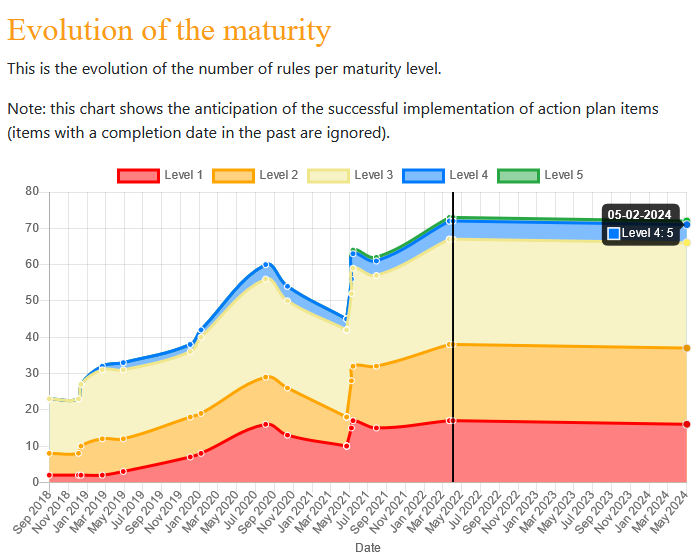
Please pay attention to the next chart. It represents the evolution of the number of rules per maturity level. Because an action plan has been defined, a vertifical line represents today. Everything at the right is the projected evolution of the maturity level based on the action items.
Exceptions management
This part enables administrator to configure PingCastle Enterprise so that it adapts to the company specific context. It is indeed possible to configure how PingCastle Enterprise handles exceptions specific to your perimeter.
Rule exceptions
"Rule exceptions" can be set in order to completely disable a rule within a specific domain. It means that this rule will not be applied for a certain period, that you have to specify.
- This should be use only when for very specific reasons, such as when a rule does not apply in your organization.
Do not hesitate to contact the PingCastle editors if you have doubts or require extra assistance regarding how the exceptions are managed.
As a precision: if no start date and no end date is defined, the exception is applied for all reports. If a start date is defined but no end date, the exception is applied starting the start date. Same for the opposite case. When both start and end date are defined, the exception is applied only during a limited moment.
Migration
In the same idea you can set exceptions for specific domain, you can inform it in the application when one of your domains is migrating. It will automatically put in place a set of exceptions during the timetable the migration is happening.
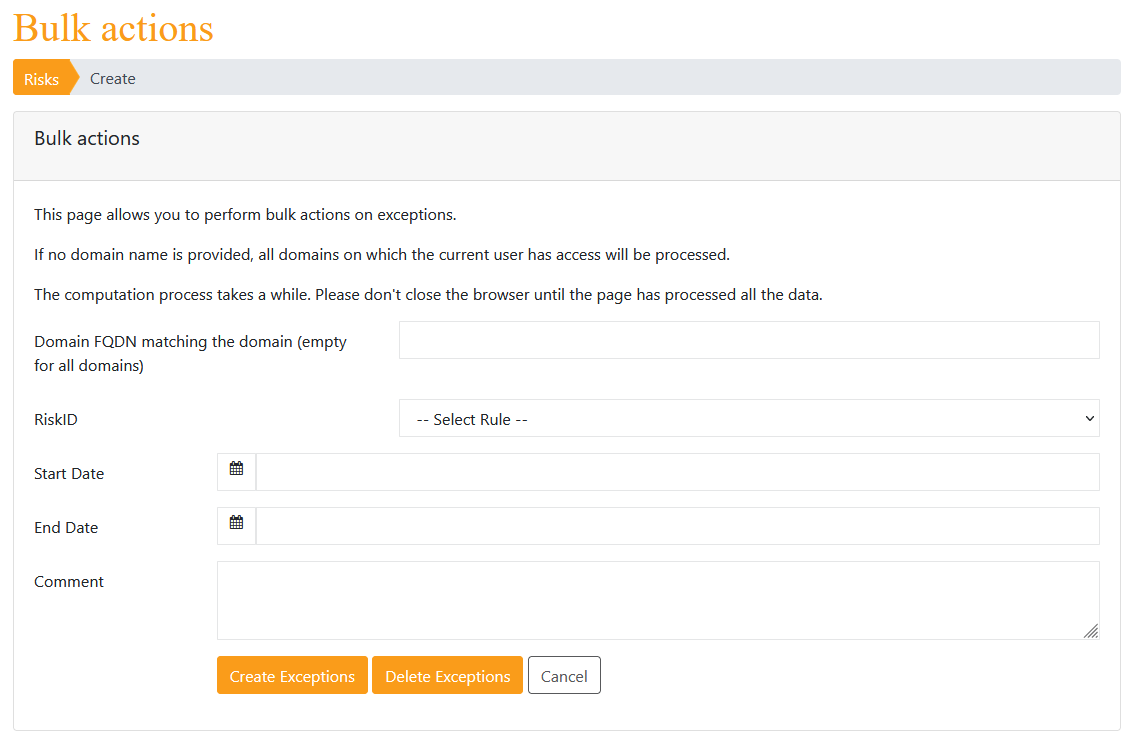
Bulk actions
If many exceptions needs to be created or removed, there is an option available to create or remove exceptions in bulk. Please note that if an exception already exists, it will not be created again.
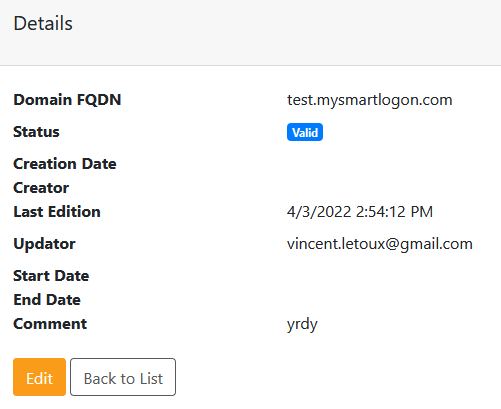
Note: Since PingCastle 2.11, all exceptions, migration or action plans are tracked with their creation or last modification date and the user which performed this change.
Importing data
PingCastle Enterprise is tool that will allow the administrators to easily and efficiently consult all the data from reports, as well as take decisions and such.
- Therefore, it is not yet possible to launch scans and so directly from the application, so it is required to launch the PingCastle tool in standalone mode and to then import the report that are produced that way.
There are two way for doing so:
Option 1: Importing the file manually
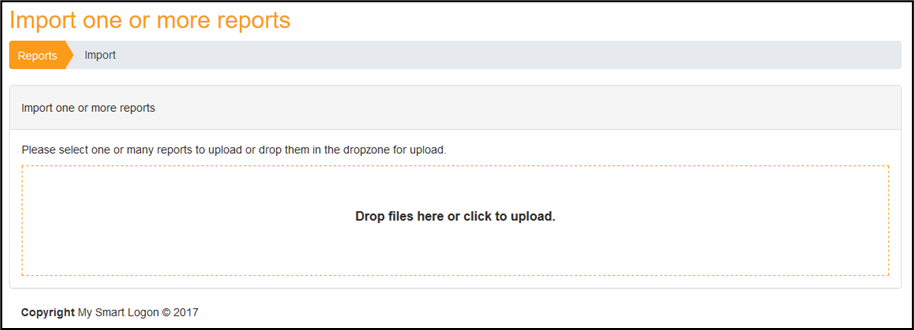
From the "Configuration" tab, open "Import one or more report(s). Once you are on the page, you can simply drag and drop any file produced by the PingCastle standalone executable and it will upload in the PingCastle Enterprise solution.
Once it is down, the file will be marked with either a success or a failure.
In case of a failure, a mouse over can display the associated error message to help you in the process of uploading the file.
Import page:

Option 2: Importing the file automatically through the Agent mode
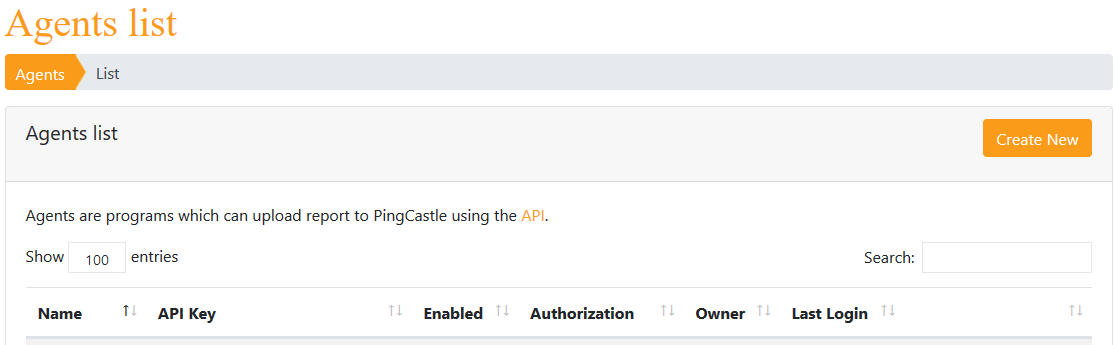
From the "Configuration" tab, you first need to get an API key using the "Agents" page and configurate the PingCastle agent accordingly.
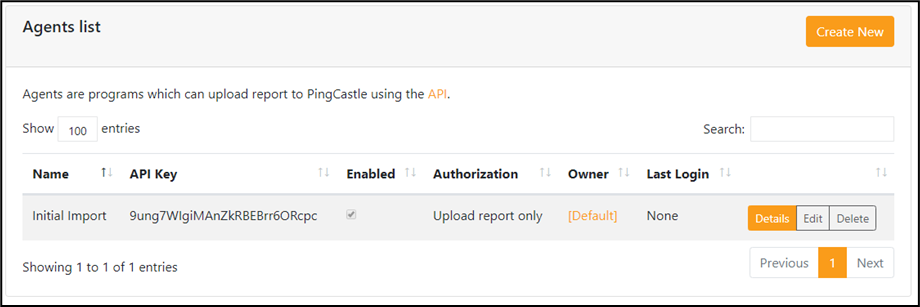
The first step is to create an Agent API key. Click on the create button to reach the creation page.
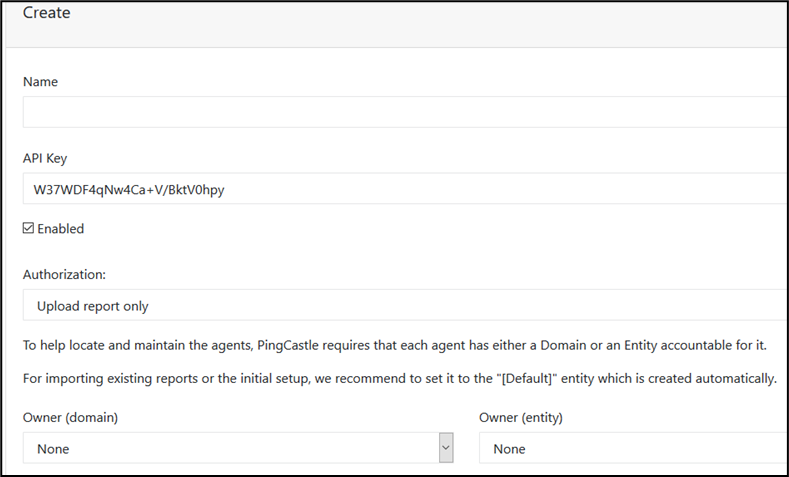
To map the agent to a responsible, the Owner field must be completed. It can be an entity or a domain, such as the "default" entity.
The API key is generated automatically but can be changed if the complexity requirements are met.
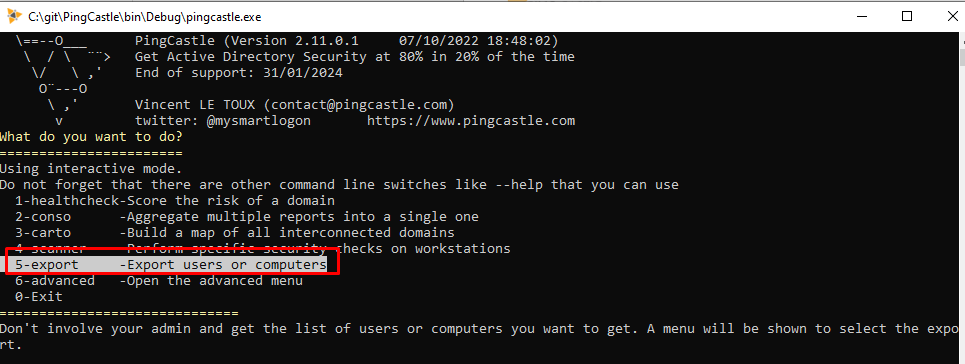
Once this is set up correctly, it is possible to directly upload reports automatically using the command:
pingcastle --healthcheck --api-endpoint <endpoint> --api-key <key>
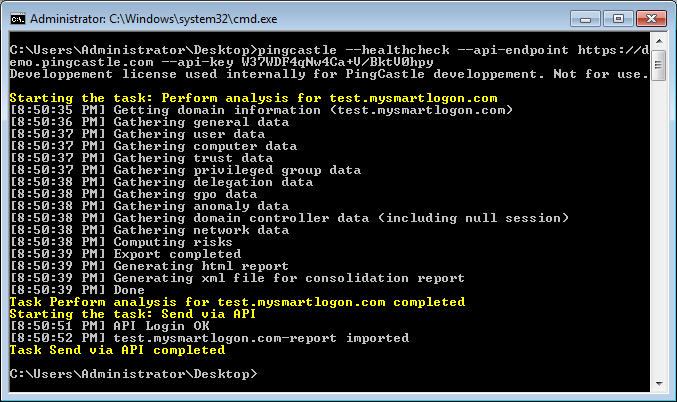
- By default, all detailed information will be filtered. To avoid this behavior, the command line can to be changed to:
pingcastle --healthcheck --api-endpoint <endpoint> --api-key <key> --level Full
The API can be browsed using the link found in the agent page:
Scheduler
The scheduler feature enables the application admin to schedule scans.
It relies on the Windows Task Scheduler and thus is not available on other operating systems than Windows. It requires a post installation step (see the installation documentation) to use it.
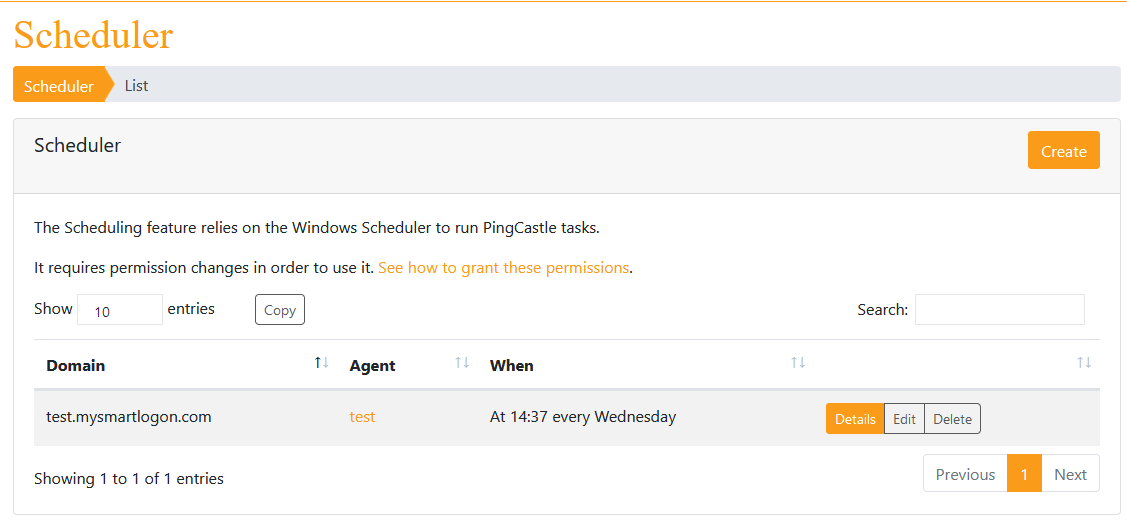
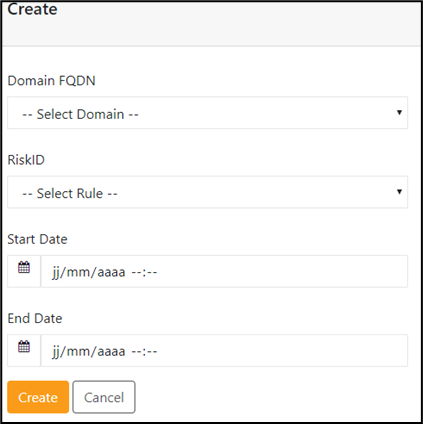
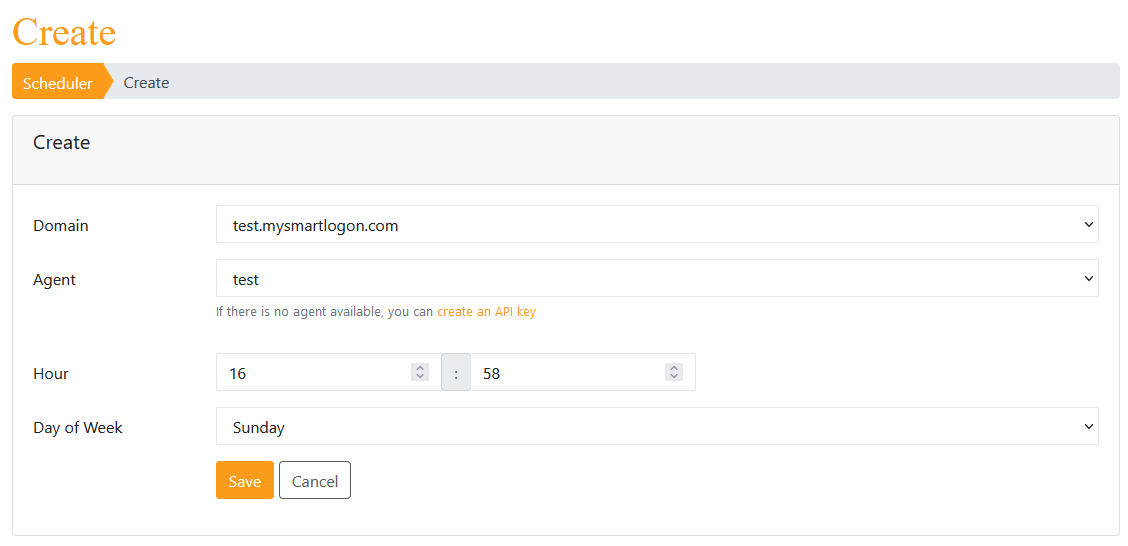
To create a new scheduled scan, click on Create and the fill the information required.
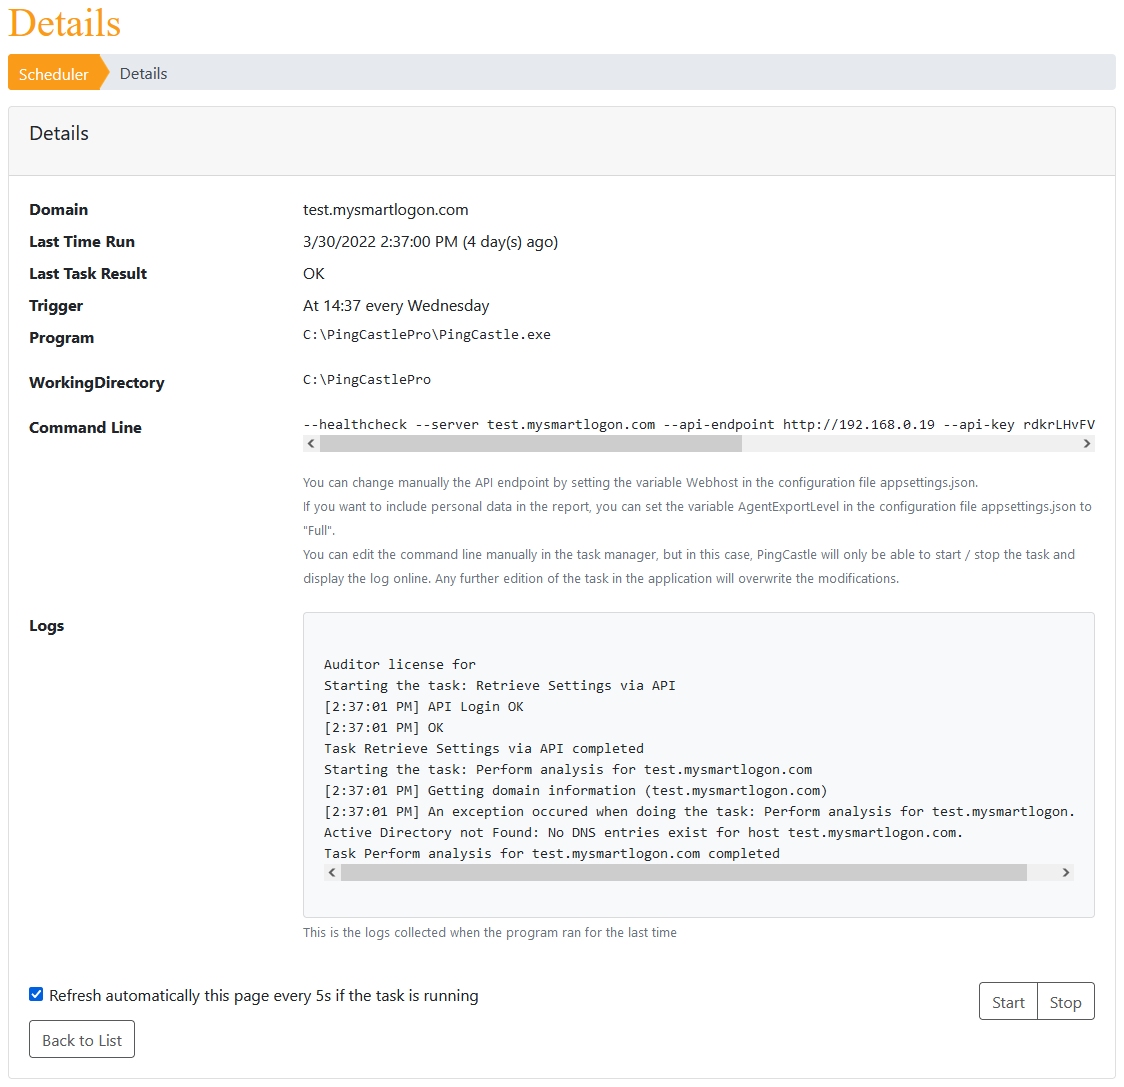
Once created (if the permission was not granted, an error will be shown with the required steps to fix this problem), the detail of the scheduler is shown.
This page show the command that will be executed and the logs produced for the last execution. The user has also the possibility to start or stop the scheduled task on demand.
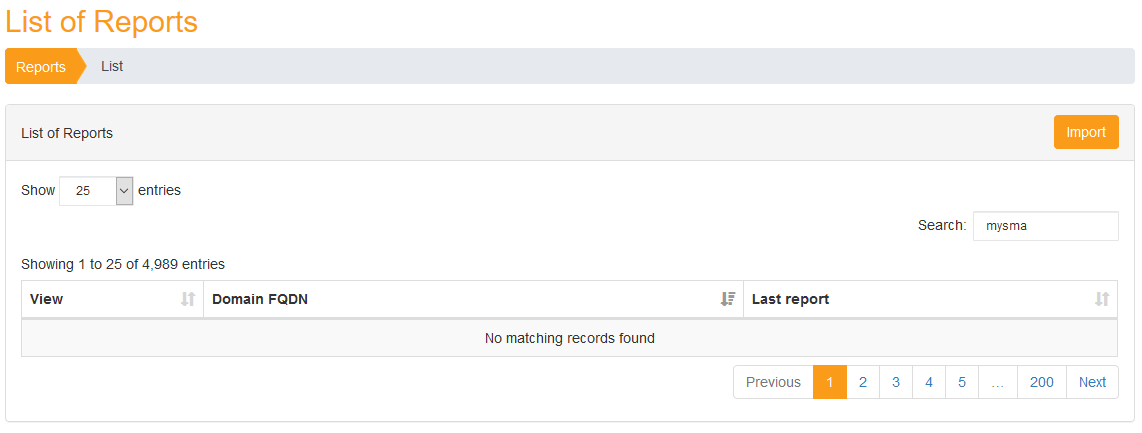
Reports
It is possible to view all the reports that have been imported within PingCastle Enterprise, regardless of the method used to import them.
To do so, from the "Configuration" tab, you can click on the "View all reports" to reach the page:
Manage Accounts
In this section, you will be introduced to how to manage your own account as well as how administrators can manage other accounts.
Manage My Account
The Manage My Account menu opens the Manage Your Account window. This window serves as a centralized hub for managing your user profile, security settings, notifications, and account information.
Follow the instructions to access the Manage My Account window.
-
Log in to your account.
-
Click on your profile icon located in the top-right corner of the application.
-
Select Manage My Account from the drop-down menu. This opens the Manage Your Account Window.

Navigation
The Manage Your Account window has the following functions and key features:
Profile Manage basic View username, Update All users account email, Update phone number information
Notifications Control Toggle Domain/Entra ID All users
notification reports, Toggle Entity KPI
delivery notifications, View email
previews
Authorizations View access See Domain authorizations, All users
permissions See Entity authorizations,
Understand direct
permissions
Password Change account Self-service password Internal users password reset, Password complexity only requirements
Two-factor Add enhanced Setup with authenticator Internal users Authentication security app, Recovery codes, only Device management
View My User Debug See all account claims, All users
Claims authentication Understand permission
sources, Troubleshoot
access issues
View My Sessions Monitor account View all active sessions, All users
access End suspicious sessions,
Session management