Monitoring
Identity Manager uses Serilog, a highly customizable logging tool, to provide monitoring capabilities.
See the References: Logs topic for additional information on the list of existing logs.
Introduction
Serilog configuration is written to both Agent's and Server's appsettings sets. The relevant
top-level section is Serilog.
A full description of Serilog's configuration capabilities is available in Serilog's official documentation.
Identity Manager-specific configuration is detailed here.
Log Level and Namespaces
Priority
Logs can be filtered according to a log level.
A priority order between the log levels is established.
From low priority to high priority, available log levels are:
VerboseDebugInformationWarningErrorFatal
Every log message is associated with a log level and a user-defined namespace. Identity Manager provides the Identity Manager namespace, associated with logs relevant to the user.
MinimumLevel
The MinimumLevel section sets the lowest priority log level that will be displayed. Every log
message associated with a log level of priority strictly lower than the minimum level is ignored.
MinimumLevel value can either be a log level or an object with the following attributes and
subsections:
-
Default sets the minimum log level.
-
Overrideallows the user to set a different minimum log level for logs from a specific namespace. See the Monitoring topic for additional information.Within Identity Manager, the following example is a good practice: default logs with a priority lower than
Errorare filtered out, except for log messages from the Identity Manager namespace.
appsettings.json
{
  ...
  "Serilog": {
    ...
    "MinimumLevel": {
      "Default": "Error",
      "Override": {
        "Usercube": "Information"
      }
    }
  }
}
Custom namespaces
Here is a table giving some namespace that you could add in the Override section, in order to
monitor the associated module.
| Module | Namespace |
|---|---|
| Identity Manager | Identity Manager |
| Scheduler (server side) | Usercube.Jobs.Scheduler.Server |
| Scheduler (agent side) | Usercube.Jobs.Scheduler |
Log Properties
Each log has a specific set of log properties, defined using the context of the server when generating the log (see Formatting).
It is possible to modify the format message of the log displayed by overriding the outputTemplate
of the logs:
appsettings.json
{
  ...
  "Serilog": {
    "MinimumLevel": {
      "Default": "Verbose",
    },
    "WriteTo": [
      {
        "Name": "Console",
        "Args": {
          "outputTemplate": "[{Timestamp:HH:mm:ss} {Level:u3}] ClientId:{ClientId} {Message:lj}{NewLine}{Exception}"
        }
      }
    ]
  }
}
Among all default properties, Identity Manager adds the ClientId log property which can be displayed
when using the previous outputTemplate format.
Filters
In addition to the Microsoft log levels, Serilog provides a Filters feature to build more advanced filter queries on log messages.
Sinks
Serilog allows the user to route log messages to a variety of logging destinations. Every destination is referred to as a sink. Sinks allows logs to be routed to destination such as standard consoles, files and logging services. See the Monitoring topic for additional information.
Identity Manager's supported sinks are:
-
Serilog.Sinks.ApplicationInsights; -
Serilog.Sinks.Async; -
Serilog.Sinks.Consoleto write to the console; -
Serilog.Sinks.Datadog.Logs; -
Serilog.Sinks.Fileto write to a file; -
Serilog.Sinks.Map; -
Serilog.Sinks.Networkto write to another network;For example, this sink can be used when producing a JSON output for QRadar.
-
Serilog.Sinks.PeriodicBatching; -
Serilog.Sinks.Splunk.Durableto send logs to Splunk; -
Serilog.Sinks.Syslog.For example, this sink can be used when producing an RFC3164 or RFC5424 output for QRadar.
The log messages can be routed to several logging destinations simultaneously. These destinations are described in the WriteTo attribute.
appsettings.json
{
  ...
"Serilog": {
    "Using": [
      "Serilog.Sinks.Network"
    ],
    "MinimumLevel": {
      "Default": "Error",
      "Override": {
          "Usercube": "Information"
      }
    },
    "WriteTo": [
      {
        "Name": "Destination1",
        "Args": {
          "uri": "192.168.13.110",
          "port": "514",
          "textFormatter": "Serilog.Formatting.Compact.CompactJsonFormatter, Serilog.Formatting.Compact"
        }
      },
      {
        "Name": "Destination2",
        "Args": {
          "uri": "192.168.13.227",
          "port": "514",
          "textFormatter": "Serilog.Formatting.Compact.CompactJsonFormatter, Serilog.Formatting.Compact"
        }
      }
    ],
    "Filter": [
      {
        "Name": "ByIncludingOnly",
        "Args": { "expression": "StartsWith(SourceContext, 'Usercube') and EventId.Id >= 500" }
      }
    ]
  }
}
There can only be one Filter attribute associated with a WriteTo attribute. Therefore, the filter defined in the Filter attribute is applied to all the destinations contained in the WriteTo attribute. To filter only one destination at a time, sub-loggers can be used.
appsettings.json
{
  ...
"Serilog": {
    "Using": [
      "Serilog.Sinks.Network"
    ],
    "MinimumLevel": {
      "Default": "Error",
      "Override": {
          "Usercube": "Information"
      }
    },
    "WriteTo": [
      {
        "Name": "Logger1",
        "Args": {
          "configureLogger": {
            "MinimumLevel": {
                "Default": "Information"
            },
            "WriteTo": [
              {
                "Name": "Destination1",
                "Args": {
                  "uri": "192.168.13.127",
                  "port": "514",
                  "textFormatter": "Serilog.Formatting.Compact.CompactJsonFormatter, Serilog.Formatting.Compact"
                }
              }
            ],
            "Filter": [
              {
                "Name": "ByIncludingOnly",
                "Args": { "expression": "StartsWith(SourceContext, 'Usercube') and EventId.Id >= 500" }
              }
            ]
          }
        }
      },
      {
        "Name": "Logger2",
        "Args": {
          "configureLogger": {
            "MinimumLevel": {
                "Default": "Information"
            },
            "WriteTo": [
              {
                "Name": "Destination2",
                "Args": {
                  "uri": "192.168.13.100",
                  "port": "514",
                  "textFormatter": "Serilog.Formatting.Compact.CompactJsonFormatter, Serilog.Formatting.Compact"
                }
              },
              {
                "Name": "Destination3",
                "Args": {
                  "uri": "192.168.13.408",
                  "port": "514",
                  "textFormatter": "Serilog.Formatting.Compact.CompactJsonFormatter, Serilog.Formatting.Compact"
                }
              }
            ],
            "Filter": [
              {
                "Name": "ByIncludingOnly",
                "Args": { "expression": "StartsWith(SourceContext, 'Test') and EventId.Id >= 800" }
              }
            ]
          }
        }
      }
    ]
  }
}
In the example above, the filter defined in Logger1 will only apply to Destination1, and the filter defined in Logger2 will only apply to Destination2 and Destination3.
When using Serilog.Sinks.File, the setting shared should be set to true in the Args section
to enable Identity Manager's Monitoring screen functionality.
As this shared setting allows several systems to interact with the log file simultaneously, so we
can have both Serilog writing to the log file and Identity Manager reading it to display its content
on the Monitoring screen.
{
  ...
  "Serilog": {
    "WriteTo": [
        {
          "Name": "File",
          "Args": {
            "path": "../Temp/Server/identitymanager-log.txt",
            "shared": true,
          }
        }
    ]
  }
}
QRadar
QRadar is a supported destination for Identity Manager's logs.
See the Export Logs to a Log Management System topic to learn how to send Identity Manager's logs to your QRadar system.
Three output formats are available for QRadar-routed logs:
- JSON
- RFC3164
- RFC5424
JSON output
JSON output uses Serilog.Sinks.Network sink.
The following configures a QRadar JSON output for a QRadar server located at 192.168.13.110.
appsettings.json
{
  ...
"Serilog": {
    "Using": [
      "Serilog.Sinks.Network"
    ],
    "MinimumLevel": {
      "Default": "Error",
      "Override": {
          "Usercube": "Information"
      }
    },
    "WriteTo": [
      {
        "Name": "Logger",
        "Args": {
          "configureLogger": {
            "MinimumLevel": {
                "Default": "Information"
            },
            "WriteTo": [
              {
                "Name": "UDPSink",
                "Args": {
                  "uri": "192.168.13.110",
                  "port": "514",
                  "textFormatter": "Serilog.Formatting.Compact.CompactJsonFormatter, Serilog.Formatting.Compact"
                }
              }
            ],
            "Filter": [
              {
                "Name": "ByIncludingOnly",
                "Args": { "expression": "StartsWith(SourceContext, 'Usercube') and EventId.Id >= 500" }
              }
            ]
          }
        }
      }
    ]
  }
}
RFC3164 or RFC5424 output
Using Serilog.Sinks.SyslogMessagesSink, the Serilog.writeTo.configureLogger.Args.format
attribute is set to RFC3164 or RFC5424.
The following configures a QRadar RFC5424 output for a QRadar server located at 192.168.13.110.
appsettings.json
{
  ...
"Serilog": {
    "Using": [
      "Serilog.Sinks.Syslog"
    ],
    "MinimumLevel": {
      "Default": "Error",
      "Override": {
          "Usercube": "Information"
      }
    },
    "WriteTo": [
      {
        "Name": "Logger",
        "Args": {
          "configureLogger": {
            "MinimumLevel": {
                "Default": "Information"
            },
            "WriteTo": [
              {
                "Name": "UdpSyslog",
                "Args": {
                  "host": "192.168.13.110",
                  "port": "514",
                  "appName": "Usercube",
                  "format": "RFC5424",
                  "facility": "Local0",
                  "secureProtocols": "SecureProtocols.None",
                  "outputTemplate": "[{Timestamp:HH:mm:ss} {Level:u3}] {Message:lj}
Application Insights
Identity Manager supports the Application Insights integration. It means that you can monitor the lifecycle of the application through a dedicated interface, which can be useful to measure performance, observe how the application is used or detect performance anomalies.
Configuration
Both the server and the agent support the Application Insights integration. To set it up, you need to create your own Application Insights instance (see Create New Resource). Once done, you should have an instrumentation key. To plug the server or the agent into the Application Insights instance, you simply have to set the key at the root of the appsettings file:
appsettings.json
{
  ...
  "ApplicationInsights": {
    "InstrumentationKey": "YOUR-INSTRUMENTATION-KEY"
  }
}
This configuration will automatically add a Serilog.Sinks.ApplicationInsights to the Serilog
configuration. Thus, declaring explicitly an ApplicationInsights sink in the Serilog configuration
is useless. The ApplicationInsights section does not only affect the logging system, but also
sends metrics periodically such as the percentage of CPU usage.
Logs Monitoring via User Interface
Identity Manager offers the ability to download the application logs directly through the User Interface (UI) via the Monitoring screen in the Administration section on the Dashboard.
SaaS installations support this feature automatically while on-premises installations support this in two ways. The first one is to leverage the path to the logs from the Serilog configuration when writing application logs into a single file. See the example below. The second option is described in the following subsection.
appsettings.json
{
  ...
  "Serilog": {
    "WriteTo": [
        {
          "Name": "File",
          "Args": {
            "path": "../Temp/Server/identitymanager-log.txt",
            "shared": true,
          }
        }
    ]
  }
}
LogsPath
if you store Identity Manager logs thanks to an external mechanism (the web server, etc), then you
have to use the second option in order to enable this feature which is via an ad hoc parameter at
the root of the appsettings called LogsPath indicating the path where the application logs are
located:
appsettings.json
{
  ...
  "Serilog": {
    "WriteTo": [ "Console" ],
    },
  "LogsPath": "C:/inetpub/logs/LogFiles"
}
If logs are all stored in one file, provide the path to the file. If they are stored in multiple separate files within a directory, provide the path to the directory and Identity Manager will handle providing the most recent logs.
Default Configuration
appsettings.json
{
  ...
"Serilog": {
  "WriteTo": [ "Console" ],
  "Using": [ "Serilog.Sinks.File" ],
  "MinimumLevel": "Error",
  "WriteTo": [
      {
        "Name": "File",
        "Args": {
          "path": "../Temp/Server/identitymanager-log.txt",
          "shared": true
        }
      }
  ]
}
}
Configuration Examples
Write log messages
This example configures Serilog to write log messages to the ../Temp/Server/identitymanager-log.txt
file.
appsettings.json
{
  ...
"Serilog": {
  "WriteTo": [ "Console" ],
  "Using": [ "Serilog.Sinks.File" ],
  "MinimumLevel": "Error",
  "WriteTo": [
      {
        "Name": "File",
        "Args": {
          "path": "../Temp/Server/identitymanager-log.txt",
          "shared": true
        }
      }
  ]
}
}
Reduce logging process overhead
This example shows how to reduce the overhead of the logging process for Identity Manager's main thread by delegating work to a background thread, using the Async__Sink.
appsettings.json
{
  ...
"Serilog": {
    "MinimumLevel": {
      "Default": "Error",
      "Override": {
        "Usercube": "Debug"
      }
    },
    "WriteTo": [
      {
        "Name": "Async",
        "Args": {
          "configure": [
            {
              "Name": "File",
              "Args": {
                "path": "C:/Projects/LogTest/identitymanager-test.txt",
                "shared: true,
                "buffered": "true"
              }
            }
          ]
        }
      },
      {
        "Name": "Console"
      }
    ]
  }
}
Troubleshoot
How to troubleshoot Identity Manager when facing technical issues.
Overview
Daily technical issues can lead to some unexpected results in Identity Manager. This page is meant to give some clues and use cases in order to solve usual issues.
For example, the issues described below can happen when there is a network cut, or an application IP address is being changed, or an important password is being modified.
See the Troubleshoot Connector Jobs troubleshooting instructions concerning connector jobs.
Prerequisites
In order to troubleshoot Identity Manager efficiently, the user, usually an application administrator, must have access to:
-
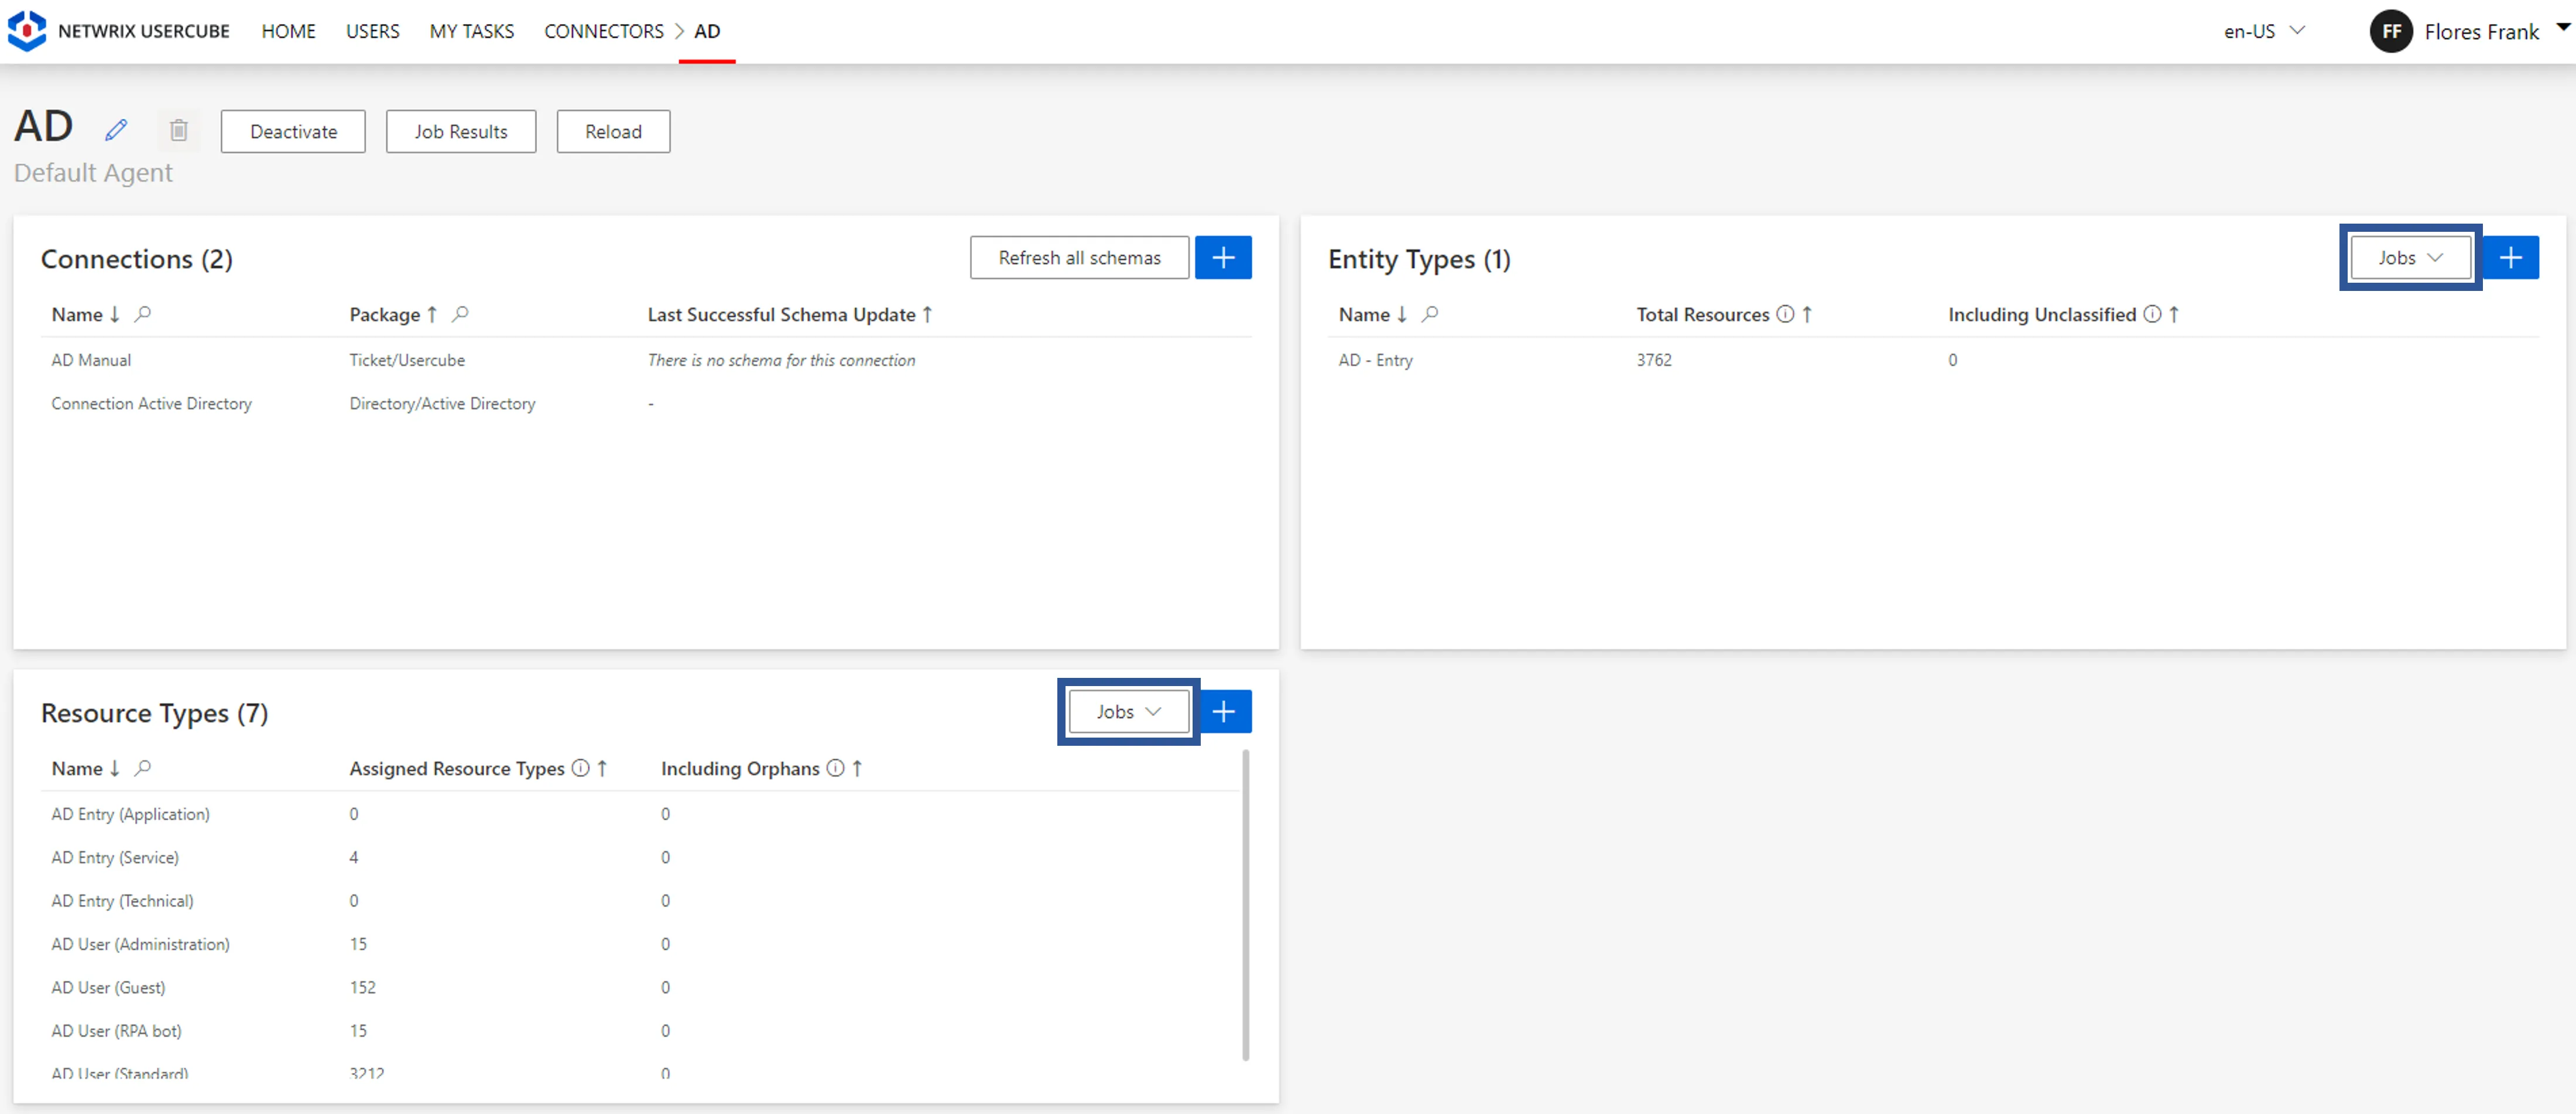
the connector screens, especially the jobs available there;
-
the resource screens (identities, accounts, etc.) with their data, and especially their history and sources;
-
basic workflows, for example the usual helpdesk workflow, that give access to users' entitlements and enable data modification and repair.
Participants and Artifacts
Here integrators give way to managers to handle the solution by themselves.
| Input | Output |
|---|---|
| Implement Identity Manager (required) | Working environment |
Troubleshoot Synchronization Issues
Errored export task
If the export task ends with an error, then you should:
- check the task's logs;
- check the export files' dates in the
Temp/ExportOutputfolder; - if there was an external problem, then relaunch the export in complete mode.
Missing data after incremental synchronization
If the data is incomplete after incremental synchronization, then you should relaunch synchronization in complete mode.
Netwrix Identity Manager (formerly Usercube) recommends scheduling an incremental synchronization approximately every 15 minutes, and a complete synchronization once a day.
Exceeded thresholds
If a synchronization threshold is exceeded, then check whether the threshold is legitimate. If not, it means that the warning comes from a change in the managed system, so you should fix the data directly in the managed system.
See more details on Synchronize Data thresholds.
Troubleshoot Provisioning Issues
Blocked provisioning orders
If provisioning orders are blocked while expected to be automatic, it can come from:
- the Require Provisioning Review option being enabled in the related resource type;
- the role model being computed through the Compute Role Model Task or the corresponding executable, with the block provisioning option;
- a provisioning order being already blocked for the same resource due to a prior operation;
- a correlation/classification rule with a confidence rate below 100%, which means that either important data is missing or the rule is not right.
Verify: After debugging the blocked-order situation, the related blocked orders must be reviewed on the Provisioning Review screen to be unblocked.
Errored provisioning orders
For example, consider a provisioning task supposed to delete 150 accounts, while the relevant service account does not have the relevant writing rights. Thus it ends up with 150 errored provisioning orders.
If provisioning orders end up with an error, then you should check the errors' details in Provisioning Review to determine where the error comes from.
Verify: After debugging the errored-order situation, unblock one provisioning order and relaunch provisioning to make sure the fix gives the expected result. Only then, unblock all related errored orders and relaunch provisioning.
If the error comes from miscalculated properties, for example missing parent dn or duplicated logins, then you should review scalar and/or query rules.
Verify: After debugging the situation, recompute the role model for only one user to make sure the fix gives the expected result. Only then, recompute the role model for all users through the Compute Role Model job of connector screens.
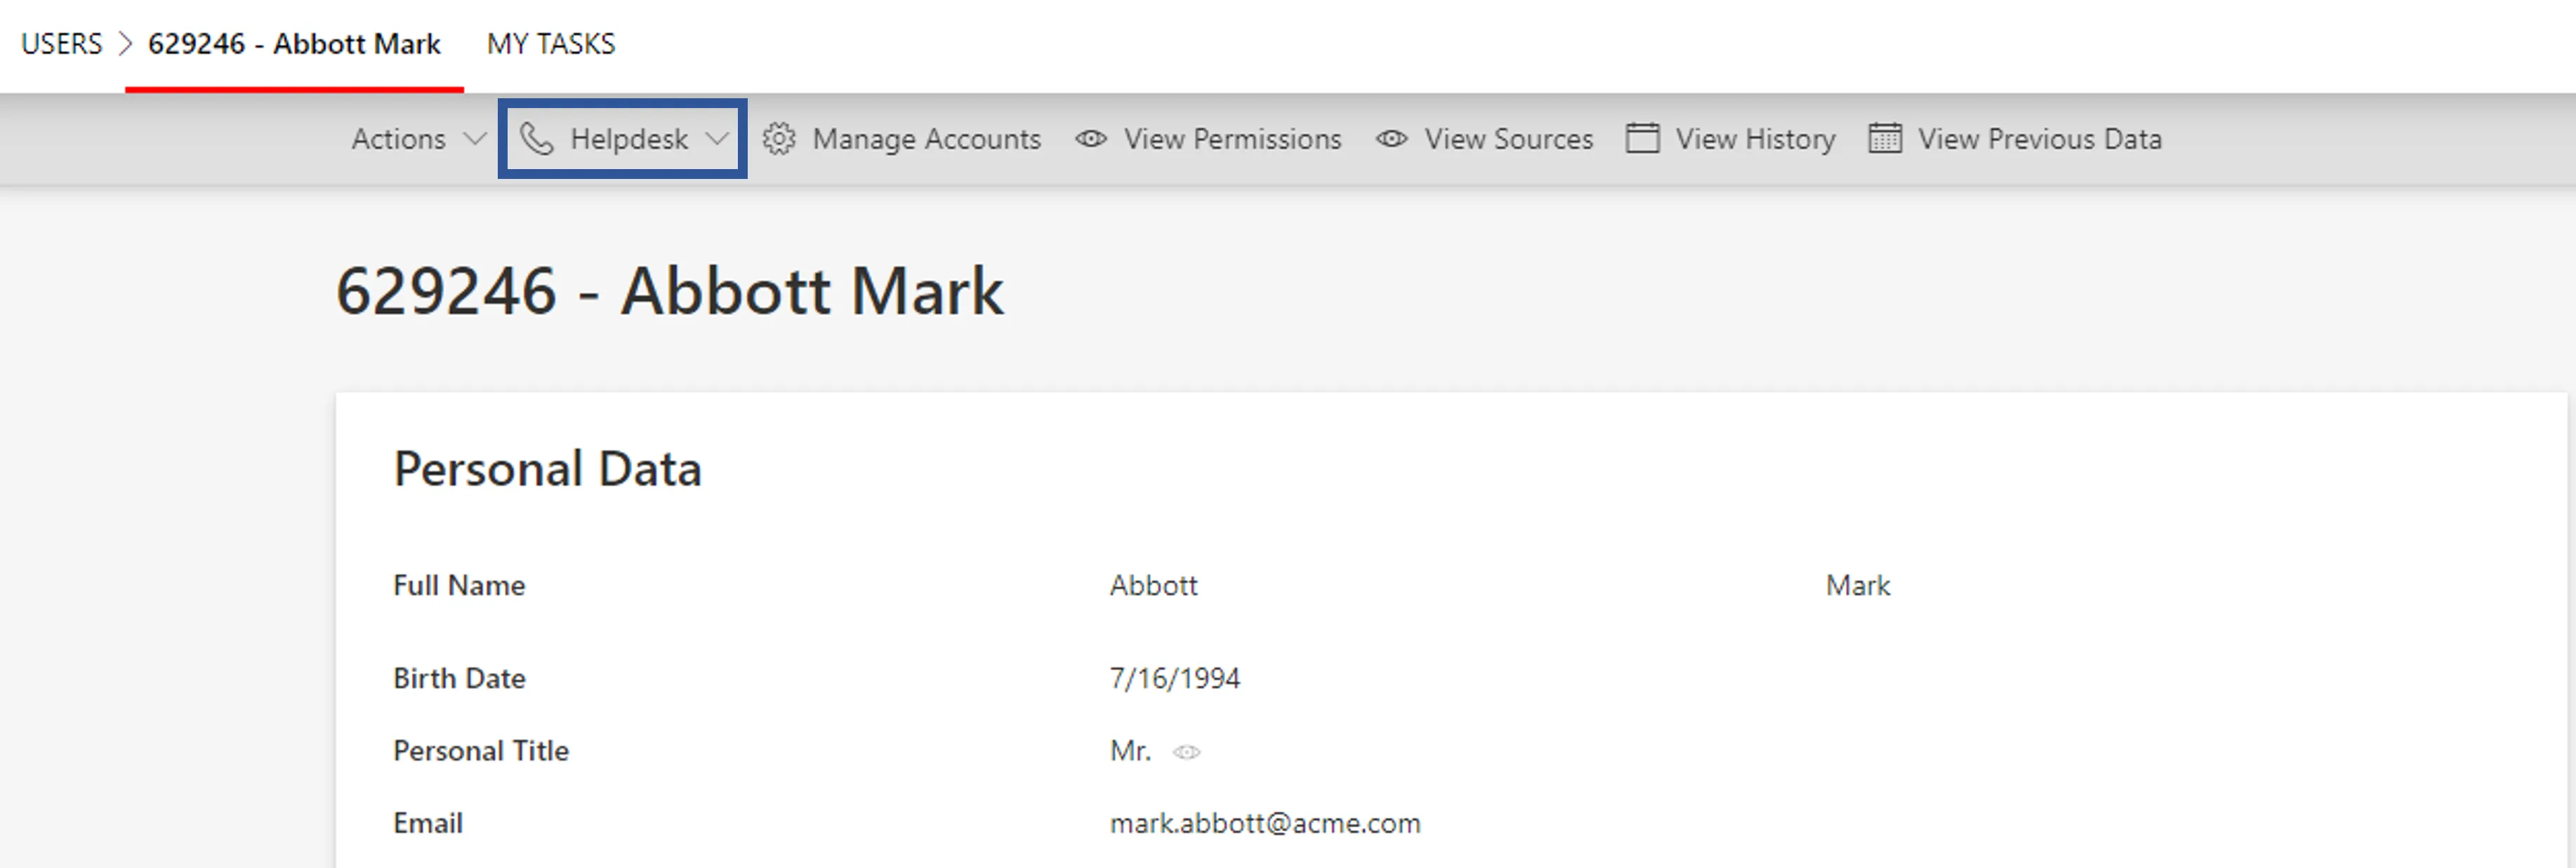
To recompute the role model for only one user, you can use the helpdesk workflow. It will give you access to the user's entitlements via the workflow's Access Permissions step, where you can check the changes without having to validate.
Incorrect provisioned values
If provisioning orders produce incorrect values, then it can come from:
-
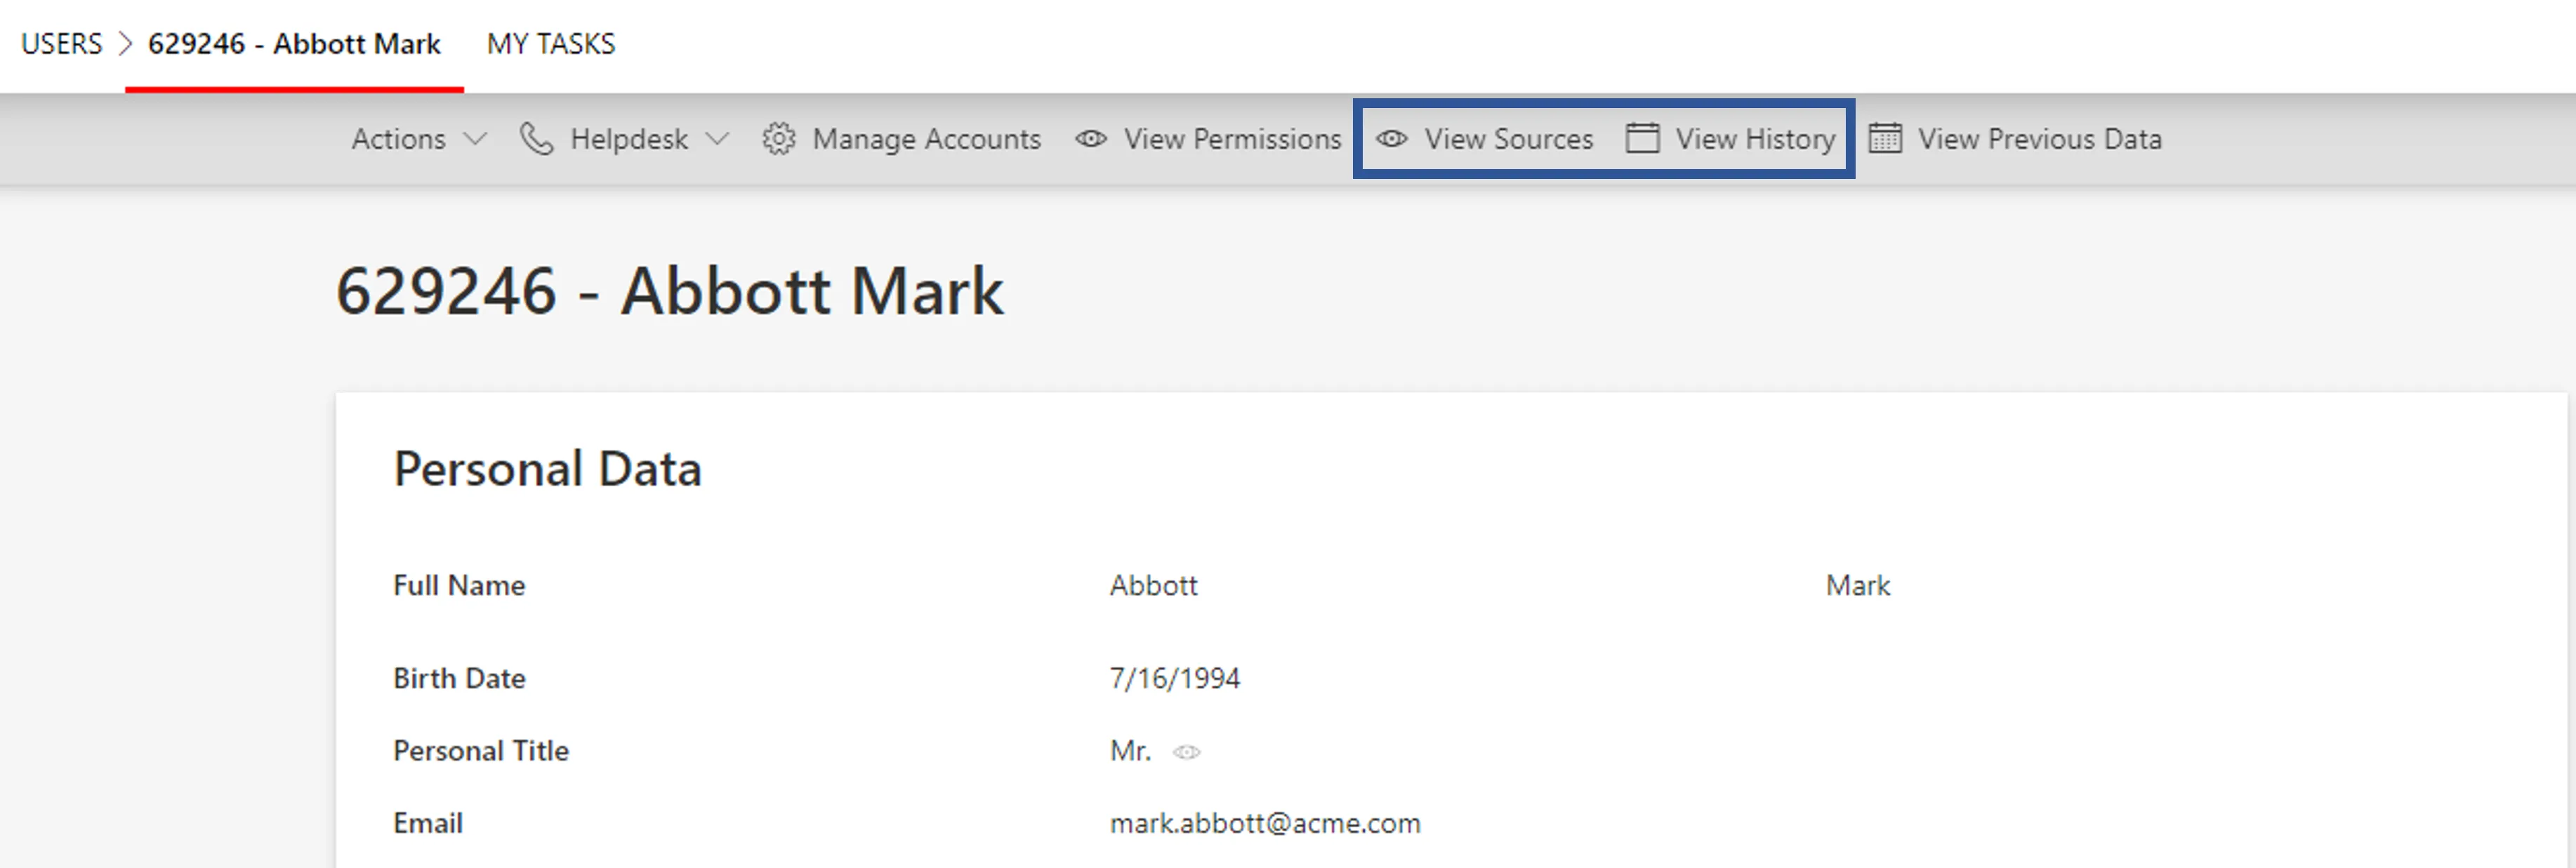
incorrect identity data, in which case you should select a test user, click on View Sources to see which sources contributed to the data, and click on View History to see when the data changed.
-
wrong provisioning rules, i.e. scalar, navigation and/or query rules;
Verify: After debugging the situation, use the helpdesk workflow to edit a field and check the changes for only one user to make sure the fix gives the expected result. Only then, recompute the role model for all users through the Compute Role Model job of connector screens. See more details on how to use the Troubleshoot workflow for debug purposes.
For example, if identity data has changed and HR data has not, then it must come from the rules.
Exceeded thresholds
If a provisioning threshold is exceeded, then check whether the threshold is legitimate. If not, it means that the warning can come from:
-
incorrect identity data, in which case you should select a test user, click on View Sources to see which sources contributed to the data, and click on View History to see when the data changed.
-
wrong provisioning rules, i.e. scalar, navigation and/or query rules;
Verify: After debugging the situation, use the helpdesk workflow to edit a field and check the changes for only one user to make sure the fix gives the expected result. Only then, recompute the role model for all users through the Compute Role Model job of connector screens. See more details on how to use the helpdesk Troubleshoot workflow for debug purposes.
Troubleshoot Entitlement Issues
If users have unexpected entitlements, then you should click on an entitlement and/or access Workflow Overview to see the entitlements' details, for example who requested them, etc.