Configure Cisco ASA Devices
Netwrix Auditor relies on native logs for collecting audit data. Therefore, successful change and access auditing requires a certain configuration of native audit settings in the audited environment and on the Auditor console computer. Configuring your IT infrastructure may also include enabling certain built-in Windows services, etc. Proper audit configuration is required to ensure audit data integrity, otherwise your change reports may contain warnings, errors or incomplete audit data.
CAUTION: Folder associated with Netwrix Auditor must be excluded from antivirus scanning. See the Antivirus Exclusions for Netwrix Auditor knowledge base article for additional information.
You can configure your IT Infrastructure for monitoring in one of the following ways:
-
Automatically through a monitoring plan – This is a recommended method. If you select to automatically configure audit in the target environment, your current audit settings will be checked on each data collection and adjusted if necessary.
-
Manually – Native audit settings must be adjusted manually to ensure collecting comprehensive and reliable audit data. You can enable Auditor to continually enforce the relevant audit policies or configure them manually:
-
On the Cisco ASA Device:
-
The global configuration mode is selected.
-
The
logging enableoption is selected on the Cisco ASA device. -
The
logging hostparameter is set to the host address of the audited CiscoASA device. And UDP port (for, example 514) is used for sending messages.NOTE: Do not select the EMBLEM format logging for the syslog server option.
-
The
logging timestampoption enabled. -
The
logging trapoption is selected from 1 to 6 inclusive.
-
-
To configure your Cisco ASA devices, do the following:
-
Navigate to your Cisco ASA device terminal through the SSH/Telnet connection (for example, use PuTTY Telnet client).
-
Access the global configuration mode. For example:
hostname# configure terminal
hostname(config)#
-
Enable logging. For example:
hostname(config)# logging enable
-
Set the IP address of the computer that hosts Netwrix Auditor Server as the
logging hostparameter. And make sure that the UDP port is used for sending syslog messages (e.g., 514 UDP port). For example:hostname(config)# logging host
<Netwrix Auditor server IP address>Do not select the EMBLEM format logging for the syslog server option.
-
Enable the
logging timestampoption. For example:hostname(config)# logging timestamp
-
Set the
logging trapoption from 1 to 6 inclusive. For example:hostname(config)# logging trap 5
-
Configure the devices to show username for failed logons:
hostname(config)# no logging hide username
Cisco ASA Devices
Review a full list of object types Netwrix Auditor can collect on Cisco ASA network devices.
| Object type | Actions | Event ID |
|---|---|---|
| Cisco ASA devices | ||
| Authentication | - Successful logon | - 716038 - 611101 - 113012 |
| - Failed logon | - 716039 - 611102 - 113021 - 113020 - 113015 - 109031 - 109025 - 109024 - 109022 - 109017 - 109010 - 109008 - 109006 - 107001 - 107002 | |
| Configuration | - Modified / Modify (Failed attempt) | - 111004 - 111010 - 612001 - 612002 - 612003 |
| - Read / Read (Failed attempt) | - 111007 | |
| - Removed / Remove (Failed attempt) | - 111003 - 112001 - 208005 | |
| CPU | - Modified / Modify (Failed attempt) | - 211003 |
| Device state | - Modified / Modify (Failed attempt) | - 199009 |
| Environment (IPMI) | - Modified / Modify (Failed attempt) | - 735002 - 735004 - 735006 - 735007 - 735008 - 735012 - 735014 - 735016 - 735018 - 735019 - 735022 - 735023 - 735025 - 735027 - 735028 - 735029 |
| GroupPolicy | - Add / Added (Failed attempt) | - 502111 |
| - Removed / Remove (Failed attempt) | - 502112 | |
| Logon | - Successful logon | - 605005 |
| - Failed logon | - 308001 - 605004 | |
| RAM | - Modified / Modify (Failed attempt) | - 211004 |
| Session | - Successful Logon | - 716001 - 713228 - 722033 - 722022 - 725001 - 725002 - 725003 - 606001 |
| - Logoff | - 725007 - 722023 - 722030 - 722031 - 716002 - 713259 - 606002 - 302014 - 302304 - 302016 | |
| - Failed Logon | - 722056 - 725006 - 725014 | |
| --- | --- | --- |
| Rule | - Activated | - 733101 |
| URL | - Read / Read (Failed attempt) | - 716003 - 716004 |
| User | - Add / Added (Failed attempt) | - 502101 |
| - Modified / Modify (Failed attempt) | - 502103 - 113006 - 113007 | |
| - Removed / Remove (Failed attempt) | - 502102 |
Configure Cisco IOS Devices
Netwrix Auditor relies on native logs for collecting audit data. Therefore, successful change and access auditing requires a certain configuration of native audit settings in the audited environment and on the Auditor console computer. Configuring your IT infrastructure may also include enabling certain built-in Windows services, etc. Proper audit configuration is required to ensure audit data integrity, otherwise your change reports may contain warnings, errors or incomplete audit data.
CAUTION: Folder associated with Netwrix Auditor must be excluded from antivirus scanning. See the Antivirus Exclusions for Netwrix Auditor knowledge base article for additional information.
You can configure your IT Infrastructure for monitoring in one of the following ways:
-
Automatically through a monitoring plan – This is a recommended method. If you select to automatically configure audit in the target environment, your current audit settings will be checked on each data collection and adjusted if necessary.
-
Manually – Native audit settings must be adjusted manually to ensure collecting comprehensive and reliable audit data. You can enable Auditor to continually enforce the relevant audit policies or configure them manually:
- The global configuration mode is selected.
- The
logging timestampoption enabled. - The
logging trapoption is selected from 1 to 6 inclusive. - The
logging hostparameter is set to the host address where the service is going to be installed. And UDP port (for, example 514) is used for sending messages.
To configure your Cisco IOS devices, do the following:
-
Navigate to your Cisco IOS device terminal through the SSH/Telnet connection (for example, use PuTTY Telnet client).
-
Access the global configuration mode. For example:
Router# configure terminal
-
Enable time stamps in syslog messages:
Router# service timestamps log datetime localtime show-timezone
-
Set the
logging trapoption from 1 to 6 inclusive. For example:Router# logging trap 5
-
Set the IP address of the Netwrix Auditor Server as the logging host parameter. And make sure that the UDP port is used for sending syslog messages (e.g., 514 UDP port). For example:
Router# logging 192.168.1.5
Cisco IOS Devices
Review a full list of object types Netwrix Auditor can collect on Cisco IOS network devices.
| Object type | Actions | Event ID |
|---|---|---|
| --- | --- | --- |
| --- | --- | --- |
| Cisco IOS | ||
| Attribute | - Read | - INFO: AAA/ATTR |
| Authentication | - Successful logon | - IKEv2: |
| - Failed logon | - IKEv2-ERROR: | |
| Configuration | - Modified | - CONFIG_I |
| Device state | - Modified | - UPDOWN - CHANGED |
| Environment | - Modified | - FAN_FAULT - OVER_TEMP |
| Logon | - Successful logon | - LOGIN_SUCCESS |
| - Failed logon | - LOGIN_FAILED | |
| Session | - Successful Logon | - IKEv2: |
| - Logoff | - %FW-6-SESS_AUDIT_TRAIL | |
| - Failed Logon | - IKEv2-ERROR: |
Cisco Meraki Dashboard
Before creating a monitoring plan to audit your Cisco Meraki devices, plan for the account that will be used for data collection. See the Data Collecting Account topic for additional information. You will provide this account in the monitoring plan wizard.
Changes that are collected with the basic authorization:
- Add/Modify/Remove User
- Configuration
- Successful logon
- Failed logon
Changes that are collected with the API:
- Add/Modify/Remove User
- Configuration
Configure Cisco Meraki Dashboard Account
Before you start creating a monitoring plan to audit your Cisco Meraki devices, plan for the data collection should meet the requirements listed below. Then you will provide this account in the item.
For Basic Authorization
Since accounts with multi-factor authentication are not supported, you need to create a special cloud account with read-only permissions and disabled multi-factor authentication.
Follow the steps to configure Cisco Meraki Dashboard item.
Step 1 – Sign in to the Cisco Meraki Dashboard.
Step 2 – Create a dashboard account as described in the following Cisco Meraki article: Getting Started
Step 3 – Make sure that the read-only permissions assigned to the account. For more information about Meraki permissions, refer to the following Cisco Meraki article: Managing Dashboard Administrators and Permissions.
Step 4 – Log in to this account and navigate to My Profile at the top of the dashboard.
Step 5 – Find the section labeled SMS authentication.
Step 6 – Make sure that the SMS authentication parameter is set to OFF. For more information about authentication, refer to the following Cisco Meraki article: Two-Factor Authentication.
NOTE: This account is for Netwrix Auditor purposes. Do not forget to switch back to your account.
To Collect Data via API Key
To work with multi-factor authentication (MFA) accounts, you need to generate an API key during authorization.
Follow the steps to create an API key for the Meraki Dashboard API.
Step 1 – Log in to your Cisco Meraki Dashboard account.
Step 2 – Click on your username in the top-right corner of the dashboard to open the drop-down menu.
Step 3 – Select My profile.
Step 4 – In the My profile page, scroll down to the API access section.
Step 5 – Click on the Generate new API key button. You may be prompted to enter your account password for security verification.
Once generated, the API key will be displayed on the screen. Make sure to copy and save the API key in a secure location, as it won't be displayed again for security reasons.
NOTE: Logons are not collected on the board due to technical limitations from the Meraki API.
Configure Cisco Meraki Devices
To configure Cisco Meraki devices, configure the Syslog server for each of your networks.
Netwrix recommends assigning a unique identificator to each Cisco Meraki device; otherwise, the product may count them as a single anonymous device.
Follow the steps to configure the Syslog server.
Step 1 – Sign in to Cisco Meraki Dashboard.
Step 2 – Navigate to Network wide > Configure > General.
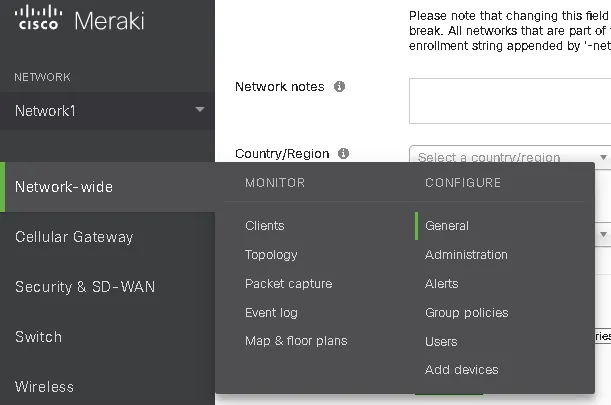
Step 3 – Locate the Reporting section and click Add a syslog server.

Step 4 – In the dialog that opens, complete the following fields:
| Option | Description |
|---|---|
| Server IP | Provide the IP address of the computer that hosts your Netwrix Auditor Server. |
| Port | Provide the port configured in your monitoring plan for Network Devices (514 by default). See theNetwork Devices topic for additional information. |
| Roles | Select the following roles: - Appliance event log - Switch event log - Wireless event log |
Cisco Meraki Devices Configuration
If you need any additional information about the Cisco Meraki devices configuration, refer to Cisco documentation: Syslog Server Overview and Configuration.
Review a full list of object types Netwrix Auditor can collect on Cisco Meraki network devices.
| Object type | Actions | Event ID |
|---|---|---|
| --- | --- | --- |
| --- | --- | --- |
| Cisco Meraki | ||
| Authentication | - Successful Logon | - 716038 - 113012 - client_vpn_connect - authentication on - type=8021x_auth - type=8021x_eap_success - type=splash_auth - type=wpa_auth |
| - Failed Logon | - 113020 - 113015 - type=8021x_eap_failure - type=disassociation | |
| Session | - Successful Logon | - 716001 - 713228 - 722033 - 722022 - 725001 - 725002 - 725003 |
| - Failed Logon | - 716039 - 722056 - 725006 - 725014 | |
| - Logoff | - 716002 - 713259 - 302014 - 302304 - 302016 - 722023 - 725007 - 722030 - 722031 - 113019 - client_vpn_disconnect - type=8021x_deauth - type=8021x_client_deauth - type=wpa_deauth | |
| Rule | - Activated | - ids-alerts - security_event ids_alerted - security_event security_filtering_file_scanned - security_event security_filtering_disposition_change - type=device_packet_flood - type=rogue_ssid_detected - type=ssid_spoofing_detected |
| URL | - Read / Failed read | - 716003 - 716004 |
Configure Fortinet FortiGate Devices
Netwrix Auditor relies on native logs for collecting audit data. Therefore, successful change and access auditing requires a certain configuration of native audit settings in the audited environment and on the Auditor console computer. Configuring your IT infrastructure may also include enabling certain built-in Windows services, etc. Proper audit configuration is required to ensure audit data integrity, otherwise your change reports may contain warnings, errors or incomplete audit data.
CAUTION: Folder associated with Netwrix Auditor must be excluded from antivirus scanning. See the Antivirus Exclusions for Netwrix Auditor knowledge base article for additional information.
You can configure your IT Infrastructure for monitoring in one of the following ways:
-
Automatically through a monitoring plan – This is a recommended method. If you select to automatically configure audit in the target environment, your current audit settings will be checked on each data collection and adjusted if necessary.
-
Manually – Native audit settings must be adjusted manually to ensure collecting comprehensive and reliable audit data. You can enable Auditor to continually enforce the relevant audit policies or configure them manually:
- The target Fortinet Fortigate device must be configured via Command Line Interface (CLI) as described below.
To configure your Fortinet FortiGate devices, enable logging to multiple Syslog servers and configure FortiOS to send log messages to remote syslog servers in CEF format. Do one of the following:
- To configure Fortinet FortiGate devices via Command Line Interface
- To configure Fortinet FortiGate devices through the Fortigate Management Console
To configure Fortinet FortiGate devices via Command Line Interface
-
Log in to the Command Line Interface (CLI).
-
Enter the following commands:
config log syslogd setting
set format cef
To enable CEF format in some previous FortiOS versions, enter the
set csv disablecommand.set csv disable
set facility
<facility_name>set port 514
set reliable disable
set server
<ip_address_of_Receiver>set status enable
end
To configure Fortinet FortiGate devices through the Fortigate Management Console
-
Open Fortigate Management Console and navigate to Log&Report ® Log Config ® Log Setting.
-
Select the Syslog checkbox.
-
Expand the Options section and complete the following fields:
Option Description Name/IP Enter the address of your Netwrix Auditor Server. Port Set to "514". Level Select desired logging level. Facility Netwrix recommends using default values. Data format Select CEF. To enable CEF format in some previous FortiOS versions, unselect the Enable CSV checkbox. -
Click Apply.
Fortinet FortiGate Devices
Review a full list of object types Netwrix Auditor can collect on Fortinet FortiGate devices.
| Object type | Actions | LogID |
|---|---|---|
| Authentication | - Successful logon | - 0100029002 - 0102043039 - 0102043008 - 0102043029 - 0101037138 / act=tunnel-up |
| - Failed logon | - 0100029003 - 0101039426 - 0102043009 - 0102043010 - 0101037121 / XAUTH authentication failed | |
| Configuration | - Copied | - 0100032211 - 0100032300 |
| - Modified / Modify (Failed attempt) | - 0100032102 - 0100032104 - 0100032400 - 0100044544 - 0100044545 - 0100044546 - 0100044547 - 0100032565 - 0100032566 - 0100032567 - 0100032571 - 0100032199 - 0100032202 - 0100032203 - 0100032234 - 0100032235 - 0108035012 - 0100044548 | |
| - Read / Read (Failed attempt) | - 0100032226 - 0100032228 - 0100032229 - 0100032230 | |
| Logon | - Successful logon | - 0100032001 |
| - Failed logon | - 0100032002 - 0100032021 | |
| Rule | - Activated | - 0419016384 - 0419016385 - 0419016386 - 0421016399 - 0211008192 - 0211008194 - 0203008200 - 0212008448 - 0261008450 - 0212008452 - 0212008457 - 0213008704 - 0213008706 - 0263008720 - 0262008960 - 0262008962 - 0262008964 - 0262008966 - 0262008968 - 0262008970 - 0262008972 - 0262008974 - 0211009234 - 0211009236 - 0202009248 - 0954024576 - 0954024579 - 0720018432 - 0720018433 - 0720018434 |
| Session | - Logoff | - 0100032003 - 0102043040 |
| User | - Add / Remove | - 0100032129 - 0100032131 - 0100032132 |
| - Modified / Modify (Failed attempt) | - 0100032130 |
Configure HPE Aruba Devices
To configure your HPE Aruba devices, enable logging to multiple Syslog servers and configure logging levels. Do one of the following:
- To configure HPE Aruba devices via Command Line Interface
- To configure HPE Aruba devices through the Management Console
To configure HPE Aruba devices via Command Line Interface
-
Log in to the Command Line Interface (CLI).
-
Enter the following command to start configuration mode:
configure terminal
-
Specify IP address of the computer that hosts your Netwrix Auditor Server to send Syslog messages to:
logging
<ipaddr>severity information -
Specify event level for the following categories: security, system, user, wireless, network:
logging network level information
logging security level information
logging system level information
logging user level information
logging wireless level information
-
Apply configuration changes:
write memory
To configure HPE Aruba devices through the Management Console
-
Log in to HPE Aruba web interface.
-
Navigate to Mobility Master and select a device or a group of devices you want to monitor with Netwrix Auditor.
-
Navigate to Configuration → System → Logging and click + to add a new Syslog Server.
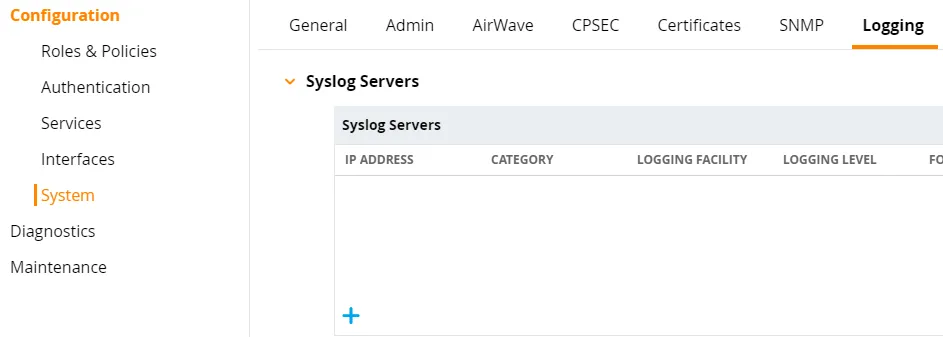
-
In the Add New Syslog Servers dialog, complete the following fields:
Option Description IP address Provide the IP address of the new server. Category Select None. Logging facility Leave empty. Logging level Select Informational. Format Select None. -
Click Submit. The new server is added to the Syslog Servers list.
-
Click Pending Changes on the right.
-
In the Pending Changes for
<X>Managed Controller(s) dialog, select the device you want to apply changes to. -
Click Deploy Changes.
-
If the configuration is correct, you will see the following wizard:

-
Navigate to Configuration → System → Logging and expand the Logging Levels.
-
Select the Informational value for the following parameters:
- network
- system
- wireless
- security
-
Deploy pending changes for the logging level: repeat steps 6 - 8.
HPE Aruba Devices
Review a full list of object types Netwrix Auditor can collect on HPE Aruba devices.
| Object type | Actions | Message ID |
|---|---|---|
| Authentication | - Successful logon | - 103047 - 103082 - 103085 - 105004 - 133008 - 133005 - 133098 |
| - Failed logon | - 522275 - 541003 - 103046 - 103048 - 103067 - 103068 - 103083 - 103084 - 105002 - 105003 - 133009 - 133006 - 133099 - 125021 - 125022 - 125031 - 125033 - 125071 | |
| Configuration | - Add / Added (Failed attempt) - Removed / Remove (Failed attempt) - Modified / Modify (Failed attempt) | - 125012 - (109012 - 124037 - 124036 - 124010 - 325013 - 325014 - 325015 - 325018 - 325019 - 335000 - 335009 - 335016 - 335015 - 335010 - 335013 - 335001 - 305034 - 335002 - 125063 - 125065 - 125067 - 125069 - 125064 - 125066 - 125068 - 125060 - 125061 - 125072 - 133109 - 133022 - 133104 - ECC error detected - Power supply failure |
| Rule | Activated | - 127054 - 127033 - 127068 - 127034 - 127006 - 127086 - 127064 - 127073 - 127079 - 127082 - 127084 - 127080 - 127083 - 127081 - 127085 - 127007 - 127074 - 127036 - 127047 - 127066 - 127043 - 127067 - 127087 - 127078 - 127035 - 127032 - 127072 - 127088 - 127109 - 127071 - 127077 - 127065 - 127075 - 127046 - 127044 - 127045 - 127116 - 127117 - 127052 - 127053 - 127069 - 127070 - 127014 - 127015 - 127016 - 127017 - 127029 - 127030 - 127008 - 127009 - 127010 - 127011 - 127028 - 127061 - 127062 - 127063 - 127039 - 127040 - 127041 - 127042 |
| Session | - Logoff | - 103040 - 103042 - 103056 - 103069 |
| Logon | - Logon succeeded | - 125023 - 125024 - 125032 - 125070 |
| Role | - Add / Added (Failed attempt) | - 125011 |
Configure Juniper Devices
Netwrix Auditor relies on native logs for collecting audit data. Therefore, successful change and access auditing requires a certain configuration of native audit settings in the audited environment and on the Auditor console computer. Configuring your IT infrastructure may also include enabling certain built-in Windows services, etc. Proper audit configuration is required to ensure audit data integrity, otherwise your change reports may contain warnings, errors or incomplete audit data.
CAUTION: Folder associated with Netwrix Auditor must be excluded from antivirus scanning. See the Antivirus Exclusions for Netwrix Auditor knowledge base article for additional information.
You can configure your IT Infrastructure for monitoring in one of the following ways:
-
Automatically through a monitoring plan – This is a recommended method. If you select to automatically configure audit in the target environment, your current audit settings will be checked on each data collection and adjusted if necessary.
-
Manually – Native audit settings must be adjusted manually to ensure collecting comprehensive and reliable audit data. You can enable Auditor to continually enforce the relevant audit policies or configure them manually:
- The target Juniper device must be configured via JunOS Command Line Interface (CLI) as described below.
To configure you Juniper devices, do the following:
-
Launch the JunOS Command Line Interface (CLI).
-
Execute the following commands:
configure
set system syslog host
<host address>any infowhere
<host address>is the IP address of the computer where Netwrix Auditor Server is installed.set system syslog host
<host address>port<port name>where
<host address>is the IP address of the computer where Netwrix Auditor Server is installedAND
<port number>is the name of the UDP port used to listen to network devices (514 port used by default). Network Devicesset system syslog time-format
<current year>commit
Juniper Devices
Review a full list of object types Netwrix Auditor can collect on Juniper network devices.
| Object type | Actions | Event ID |
|---|---|---|
| Logon | - Successful logon | - LOGIN_INFORMATION - Accepted keyboard-interactive/pam - WEB_AUTH_SUCCESS - JADE_AUTH_SUCCESS |
| - Failed logon | - LOGIN_FAILED - SSHD_LOGIN_FAILED LIBJNX_LOGIN_ACCOUNT_LOCKED - WEB_AUTH_FAIL JADE_AUTH_FAILURE | |
| Authentication | - Successful Logon | - FWAUTH_HTTP_USER_AUTH_ACCEPTED - FWAUTH_WEBAUTH_SUCCESS - FWAUTH_FTP_USER_AUTH_ACCEPTED - FWAUTH_TELNET_USER_AUTH_ACCEPTED - DYNAMIC_VPN_AUTH_OK |
| - Failed logon | - FWAUTH_HTTP_USER_AUTH_FAIL - FWAUTH_WEBAUTH_FAIL - FWAUTH_FTP_USER_AUTH_FAIL - FWAUTH_TELNET_USER_AUTH_FAIL - DYNAMIC_VPN_AUTH_FAIL | |
| Configuration | - Modified / Modify (Failed attempt) | - UI_FACTORY_OPERATION - UI_INITIALSETUP_OPERATION - UI_RESCUE_OPERATION - UI_LOAD_EVENT - UI_CFG_AUDIT_OTHER - UI_CFG_AUDIT_SET: - UI_CFG_AUDIT_NEW - UI_CFG_AUDIT_SET_SECRET - UI_COMMIT: - UI_COMMIT_PROGRESS - UI_COMMIT_COMPLETED - UI_COMMIT_AT_COMPLETED - UI_COMMIT_NOT_CONFIRMED - UI_COMMIT_CONFIRMED_REMINDER - UI_COMMIT_AT_ABORT - UI_COMMIT_AT_FAILED - UI_COMMIT_COMPRESS_FAILED - UI_COMMIT_ROLLBACK_FAILED |
| Rule | - Activated | - RT_SCREEN_ICMP - RT_SCREEN_IP - RT_SCREEN_TCP - RT_SCREEN_TCP_DST_IP - RT_SCREEN_TCP_SRC_IP - RT_SCREEN_UDP - AV_VIRUS_DETECTED_MT - ANTISPAM_SPAM_DETECTED_MT - IDP_APPDDOS_APP_ATTACK_EVENT - IDP_APPDDOS_APP_STATE_EVENT - IDP_ATTACK_LOG_EVENT |
Configure PaloAlto Devices
Netwrix Auditor relies on native logs for collecting audit data. Therefore, successful change and access auditing requires a certain configuration of native audit settings in the audited environment and on the Auditor console computer. Configuring your IT infrastructure may also include enabling certain built-in Windows services, etc. Proper audit configuration is required to ensure audit data integrity, otherwise your change reports may contain warnings, errors or incomplete audit data.
CAUTION: Folder associated with Netwrix Auditor must be excluded from antivirus scanning. See the Antivirus Exclusions for Netwrix Auditor knowledge base article for additional information.
You can configure your IT Infrastructure for monitoring in one of the following ways:
-
Automatically through a monitoring plan – This is a recommended method. If you select to automatically configure audit in the target environment, your current audit settings will be checked on each data collection and adjusted if necessary.
-
Manually – Native audit settings must be adjusted manually to ensure collecting comprehensive and reliable audit data. You can enable Auditor to continually enforce the relevant audit policies or configure them manually:
- Create a Syslog Server profile and syslog forwarding for the target PaloAlto device via Web Interface as described below.
To configure your PaloAlto devices, create a Syslog server profile and assign it to the log settings for each log type.
Follow the steps to configure a Syslog server profile.
Step 1 – Connect to your PaloAlto device: launch an Internet browser and enter the IP address of
the firewall in the URL field (https://<IP address>).
Step 2 – In the Web Interface, navigate to Device > Server Profiles > Syslog.
Step 3 – Click Add and specify profile name, for example, "SyslogProf1".
Step 4 – Specify syslog server parameters:
| Parameter | Description |
|---|---|
| Name | Specify unique name for a syslog server. |
| Syslog Server | Provide a server name by entering its FQDN or IPv4 address. |
| Transport | Select UDP. |
| Port | Provide the name of the UDP port used to listen to network devices (514 port used by default). |
| Format | Select IETF. |
| Facility | Netwrix recommends using default values. |
Follow the steps to configure syslog forwarding.
Step 1 – In the Web Interface, navigate to Device > Log Settings.
Step 2 – For System, Config, and User ID logs, click Add and enter unique name of your syslog server.
Step 3 – On the syslog panel, click Add and select the syslog profile you created above.
Step 4 – Click Commit and review the logs on the syslog server.
NOTE: After configuring the monitoring plan, Netwrix Auditor will listen to the logs forwarded by the Palo Alto device.
PaloAlto Devices
Review a full list of object types Netwrix Auditor can collect on PaloAlto network devices.
| Object type | Actions | Event ID |
|---|---|---|
| Logon | - Successful logon | - logged in |
| - Failed logon | - failed authentication for user - authentication failed for user | |
| Authentication | - Successful Logon | - authentication succeeded for user - USERID,login, - globalprotectportal-auth-succ |
| - Failed Logon | - authentication failed for user - globalprotectportal-auth-fail | |
| Configuration | - Modified / Modify (Failed attempt) | - commit |
| Environment | - Read / Read (Failed attempt) | - connect-server-monitor-failure |
| Session | - Logoff | - logged out |
| User | - Add / Added (Failed attempt) | - config mgt-config users - config shared local-user-database user |
| - Modified / Modify (Failed attempt) | - config mgt-config users - config shared local-user-database user | |
| - Removed / Remove (Failed attempt) | - config mgt-config users - config shared local-user-database user |
Permissions for Network Devices Auditing
Before you start creating a monitoring plan to audit your network devices, plan for the account that will be used for data collection – it should meet the requirements listed below. Then you will provide this account in the monitoring plan wizard.
| For... | Requirement |
|---|---|
| - Cisco ASA - Cisco IOS - Cisco FTD - Fortinet - HPE Aruba - Juniper - Palo Alto - Pulse Secure - SonicWall - HPE | You can use any account (not necessarily the credentials used to connect to the device itself), as long as these credentials do not affect Netwrix Auditor or monitored IT infrastructure. Provide this account in the monitoring plan wizard. |
| - Cisco Meraki | See the Configure Cisco Meraki Dashboard Account section for additional information. |
Configure Pulse Secure Devices
-
Connect to your Pulse Secure device: launch an Internet browser and enter the IP address or device DNS name in the URL field (https://
<IP address / Device DNS name>/admin). -
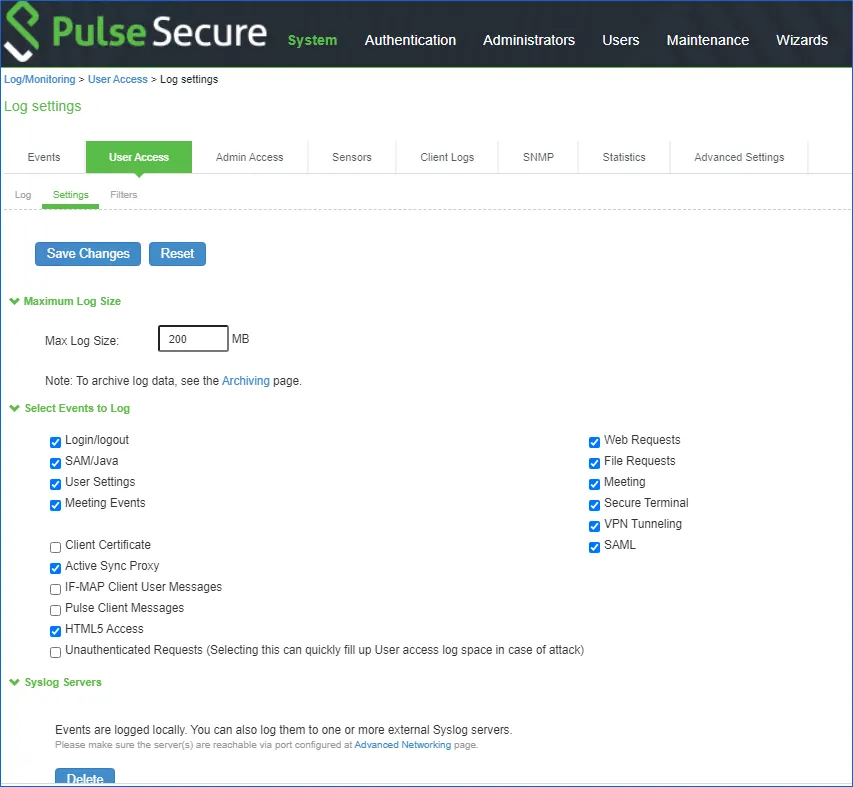
In the Web Interface, navigate to System → Log/Monitoring.
-
Under Log/Monitoring, expand the User Access link.
-
Locate the Settings tab.
-
Under the Select Events to Log, select the following (minimal requirement, select other events if needed):
- Login/Logout
- VPN Tunneling
-
Under the Syslog Servers, complete the following fields:
Option Description Server nameIP Specify the IP address of the computer where resides. Facility Select desired facility. Type Select UDP. Client Certificate Use default values. Filter Select Standard. -
Save your changes.
-
Switch to the Admin Access tab.
-
Under the Select Events to Log, select the following (minimal requirement, select other events if needed):
- Administrator logins
- Administrator changes
-
Repeat the step 6 for Syslog Servers configuration.
-
Save your changes.
-
Navigate to System → Configuration → Advanced Networking.
-
Expand the Select the source port to be used for the following features link.
-
Locate the Syslog parameter and set it to Internal.
Netwrix Auditor must be accessible from the selected network interface
-
Save your changes.
-
Start Netwrix Auditor.
-
Navigate to your monitoring plan for Network Devices. See Monitoring Plans
-
Provide the IP address of the interface you specified on the step 14 as the Computer item for your monitoring plan. See Active Directory
Pulse Secure Devices
Review a full list of object types Netwrix Auditor can collect on Pulse Secure network devices.
| Object Type | Actions | |
|---|---|---|
| Logon | - Successful logon | - user authenticated successfully - user logged in successfully - administrative login succeeded - SuperAdmin session created using token for administrative logon recovery - Admin logged in successfully through the local console |
| - Failed logon | - Login/authentication failed - Login attempt from the local console failed | |
| - Logoff | - user logged out or session timed out - admin logged out or session timed out - SuperAdmin session finished or timed out - Admin logged off from the local console | |
| Authentication | - Successful logon | - VPN Tunneling Successful Logon |
| - Logoff | - VPN connection closed | |
| Configuration | - Modified | - Server shutdown/reboot/restart requested - Platform administrator account added - Console administrator password is disabled or enabled - IKEv2 settings modified - Global SAML Settings modified - SAML Metadata Provider added - SAML Metadata Provider removed - SAML Metadata Provider updated - authentication server added - authentication server deleted - authentication server modified - Sign-in policy created - Sign-in policy deleted - Sign-in policy modified - Sign-in policy multiple user session limit modified - Sign-in policy multiple user session modified - Sign-in policy multiple user session warning notification modified - Updated the order of the sign-in policies - Sign-in policy user access parameters modified - Sign-in page created - Sign-in page deleted - Sign-in page updated - Sign-in notification created - Sign-in notification deleted - Sign-in notification updated - Sign-in SAML modified |
| User | - Added | - user account added |
| - Modified | - user account password changed - user account disabled or enabled - user account unlocked - user account modified - admin rights granted - admin rights revoked | |
| - Removed | - user account removed | |
| Role | - Added | - Role is created |
| - Modified | - Role is modified | |
| - Removed | - Role is deleted | |
| - Copied | - Role is duplicated | |
| Session | - Session start | - VPN Tunneling Session started |
| - Session end | - VPN Tunneling Session ended | |
| Realm | - Added | - Realm added |
| - Modified | - IP added to allowed IP list in Realm authentication policy - IP removed from allowed IP list - IP setting reordered - Source IP restriction modified - browser restriction set - Browser restriction modified - browser restriction removed - Browser restriction reordered - Client-side certificate requirement modified - Certificate attribute modified - Password restriction modified - Minimum password length modified - Host Checker restriction is updated - User Limit restriction is modified - Guaranteed minimum number of users is modified - Maximum number of sessions is modified - Maximum number of users is modified - Realm is modified | |
| - Removed | - Realm deleted | |
| - Copied | - Realm duplicated | |
| - Renamed | - Realm renamed |
Configure SonicWall Devices
Netwrix Auditor relies on native logs for collecting audit data. Therefore, successful change and access auditing requires a certain configuration of native audit settings in the audited environment and on the Auditor console computer. Configuring your IT infrastructure may also include enabling certain built-in Windows services, etc. Proper audit configuration is required to ensure audit data integrity, otherwise your change reports may contain warnings, errors or incomplete audit data.
CAUTION: Folder associated with Netwrix Auditor must be excluded from antivirus scanning. See the Antivirus Exclusions for Netwrix Auditor knowledge base article for additional information.
You can configure your IT Infrastructure for monitoring in one of the following ways:
-
Automatically through a monitoring plan – This is a recommended method. If you select to automatically configure audit in the target environment, your current audit settings will be checked on each data collection and adjusted if necessary.
-
Manually – Native audit settings must be adjusted manually to ensure collecting comprehensive and reliable audit data. You can enable Auditor to continually enforce the relevant audit policies or configure them manually:
- Configure log settings, depending on your device type.
To configure your SonicWall devices, do the following:
To configure SonicWall Web Application Firewall
-
Connect to your SonicWall device. Launch an Internet browser and enter the following in the URL field: https://
<IP address>:84443, where IP address is the IP of the device and 84443 is the default connection port. -
Log in to the device.
-
In the Web Interface, navigate to Log → Settings and configure the following:
Parameter Description - Log Level - Alert Level - Syslog Level Set to "Info". - Enable Audit Log - Send to Syslog Server in Audit Log Settings - Send to Syslog Server in Access Log Settings Select these checkboxes. Primary Syslog Server Enter the address of your Netwrix Auditor Server. Primary Syslog Server Port Provide the name of the UDP port used to listen to network devices (514 port used by default). -
Click Accept.
-
Navigate to Log → Categories.
-
Select the following checkboxes:
- Authentication
- Authorization & Access
- System
- Web Application Firewall
- Geo IP & Botnet Filter In Log Categories (Standard)
-
Click Accept.
To configure SonicWall SMA
-
Connect to your SonicWall device. Launch an Internet browser and enter the following in the URL field: https://
<IP address>:8443, where IP address is the IP of the device and 8443 is the default connection port. -
Log in to the device.
-
In the Web Interface, navigate Log → Settings and configure the following:
Parameter Description - Log Level - Alert Level - Syslog Level Set to "Info". - Enable Audit Log - Send to Syslog Server in Audit Log Settings - Send to Syslog Server in Access Log Settings Select these checkboxes. Primary Syslog Server Enter the address of your Netwrix Auditor Server. Primary Syslog Server Port Provide the name of the UDP port used to listen to network devices (514 port used by default). -
Click Accept.
-
Navigate to Log → Categories.
-
Select the following checkboxes:
- Authentication
- Authorization & Access
- System
- Web Application Firewall
- Geo IP & Botnet Filter In Log Categories (Standard)
-
Click Accept.
To configure SonicWall NS series
- Connect to your SonicWall device. Launch an Internet browser and enter the following in the URL
field: https://
<IP address>:443, where IP address is the IP of the device and 443 is the default connection port. - Log in to the device.
- In the Web Interface, navigate to Manage → Log Settings → Base Setup.
- Select all checkboxes in the Syslog column.
- Click Accept.
- Navigate to Manage → Log Settings → Syslog.
- Set the Syslog Format to Default.
- Click Add.
- In the dialog appears, select Create new address object option in the Name or IP Address combo box.
- Provide name and IP address of the new object.
- Click OK.
- In the Add Syslog Server dialog, find the IP address you specified on the step 10 in the Name or IP Address list.
- Click OK.
- Click Save.
SonicWall Devices
Review a full list of object types Netwrix Auditor can collect on SonicWall network devices.
| Object type | Actions | Event ID |
|---|---|---|
| Logon | - Successful logon | - User login from an internal zone allowed - User login successful - XAUTH Succeeded with VPN - VPN zone remote user login allowed - WAN zone remote user login allowed - PPP: Authentication successful - Local Authentication Success - RADIUS/LDAP Authentication Success - Successful authentication received for Remotely Triggered - IKEv2 Authentication successful - SSL VPN zone remote user login allowed |
| - Failed logon | - User login denied - User login failed - XAUTH Failed with VPN - L2TP PPP Authentication Failed - check username / password - RADIUS/LDAP reports Authentication Failure - Local Authentication Failure - User login to Administration Portal denied - User login failure rate exceeded - User Name authentication Failure locally - ISAKMP_AUTH_FAILED - Guest service limit reached - Guest login denied - Incorrect authentication received for Remotely Triggered - Authentication Timeout during Remotely Triggered - Problem occurred during user group membership retrieval - An error has occurred while sending your - IPsec Authentication Failed | |
| - Logoff | - User logged out - logged out - Guest Session Timeout - Guest Account Timeout - Guest Idle Timeout - Guest traffic quota exceeded | |
| Authentication | - Successful Logon | - Administrator login allowed - CLI administrator login allowed - VPN zone administrator login allowed - WAN zone administrator login allowed - Configuration mode administration session started - Read-only mode GUI administration session started - Non-config mode GUI administration session started - User login successful - Session Start: - EventMessage: Session Start Success |
| - Failed Logon | - Administrator login denied - CLI administrator login denied due to bad credentials - User login failed - The account has been disabled for - is not permitted for this Web App - Authentication for user - Authentication failed - maximum authentication attempts exceeded for - EventMessage: Session Start Failed | |
| - Logoff | - Administrator logged out - CLI administrator logged out - Configuration mode administration session ended - GUI administration session ended - Logged out - Session End: - EventMessage: Session End - Command='Tunnel' | |
| Configuration | - Add / Added (Failed attempt) | - m=1333 - Scheduled settings generated - A new default Self-Signed certificate was generated successfully - Scheduled Tech Support Report generated - Restarted Tech Support Report generated |
| - Modified / Modify (Failed attempt) | - Mail attachment disabled - Watch and report possible SYN floods - Watch and proxy WAN connections when under attack - Always proxy WAN connections - SYN Flood blacklisting enabled by user - SYN Flood blacklisting disabled by user - Administrator name changed - VPN disabled by administrator - VPN enabled by administrator - WLAN disabled by administrator - WLAN enabled by administrator - WLAN disabled by schedule - WLAN enabled by schedule - is added into Group - is removed from Group - m=1334 - Update administrator/user lockout params - Settings imported - Critical Operating System Update failed - msg="WAF restarted - HTTP(S) Cache settings were updated - database has been updated - Web Server Fingerprint Protection enforced - About to reconfigure service: - Finished applying configuration changes - Started - Start failed - Stopped | |
| - Read / Read (Failed attempt) | - m=1203 - m=1204 - Problem loading the URL list - Registration Update Needed, Please restore your existing security service subscriptions - Failed to synchronize license information with Licensing Server - Current settings exported - Error sending - settings sent successfully - Automated scheduled settings successful - Scheduled settings downloaded - Tech Support Report - Tech Support Report sent successfully - Loaded WAF signature database successfully - Error sending - logs sent out successfully | |
| - Remove / Removed (Failed attempt) | - Scheduled settings deleted - Oldest scheduled Tech Support Report deleted - has been deleted - Event Logs cleared - Audit Logs cleared - Access Logs cleared - Deleting log files - Deleting core files - Deleting snapshots older | |
| Device state | - Modified / Modify (Failed attempt) | - Registration Update Needed, Please restore your existing security service subscriptions - Intrusion Prevention (IDP) subscription has expired - Failed to synchronize license information with Licensing Server |
| Folder | - Add / Added (Failed attempt) | - Request='GET /cgi-bin/sonicfiles?RacNumber=9&Arg1= |
| - Read / Read (Failed attempt) | - Request='GET /cgi-bin/sonicfiles?RacNumber=16&Arg1= | |
| - Remove / Removed (Failed attempt) | - Request='GET /cgi-bin/sonicfiles?RacNumber=13&Arg1= | |
| File | - Add / Added (Failed attempt) | - Request='GET /cgi-bin/sonicfiles?RacNumber=31&Arg1= |
| - Read / Read (Failed attempt) | - Request='GET /cgi-bin/sonicfiles?RacNumber=25&Arg1= | |
| - Rename / Renamed (Failed attempt) | - Request='GET /cgi-bin/sonicfiles?RacNumber=14&Arg1= | |
| - Remove / Removed (Failed attempt) | - Request='GET /cgi-bin/sonicfiles?RacNumber=12&Arg1= | |
| Host | - Read / Read (Failed attempt) | - Received AV Alert - The loaded content URL List has expired - CFS Alert - Mail Filter Alert - Mail attachment deleted - Intrusion Prevention (IDP) subscription has expired - Smurf Amplification attack dropped - TCP Xmas Tree dropped - Source routed IP packet dropped - Mail fragment dropped - PASV response spoof attack dropped - PORT bounce attack dropped - PASV response bounce attack dropped - Spank attack multicast packet dropped - IPS Detection Alert - IPS Prevention Alert - Drop WLAN traffic - IDP Detection Alert - IDP Prevention Alert - Ping of death dropped - IP spoof dropped - Possible SYN flood attack detected - Land attack dropped |
| Rule | - Activated | - will be denied - msg="WAF threat detected - Ping of death dropped - IP spoof dropped - Possible SYN flood attack detected - Land attack dropped - Smurf Amplification attack dropped - Possible port scan detected - Probable port scan detected - Probable TCP FIN scan detected - Probable TCP XMAS scan detected - Probable TCP NULL scan detected - Mail attachment deleted - TCP Xmas Tree dropped - Source routed IP packet dropped - Mail fragment dropped - PASV response spoof attack dropped - PORT bounce attack dropped - PASV response bounce attack dropped - Spank attack multicast packet dropped - IPS Detection Alert - IPS Prevention Alert - Drop WLAN traffic - IDP Detection Alert |
| Session | - Add / Added (Failed attempt) | - msg="New HTTP Request to - msg="New HTTPS Request to - msg="New HTTP Session for - msg="New HTTPS Session for |
| - Read / Read (Failed attempt) | - msg="WAF threat detected: - will be denied - Access to proxy server denied - Website found in blacklist | |
| - Logoff | - Connection Closed | |
| User | - Add / Added (Failed attempt) | - Guest account |
| - Modified / Modify (Failed attempt) | - Administrator name changed - out user logins allowed - Guest account - User login disabled from - User account | |
| - Remove / Removed (Failed attempt) | - Guest account - m=1335 |