Alerts Overview Dashboard
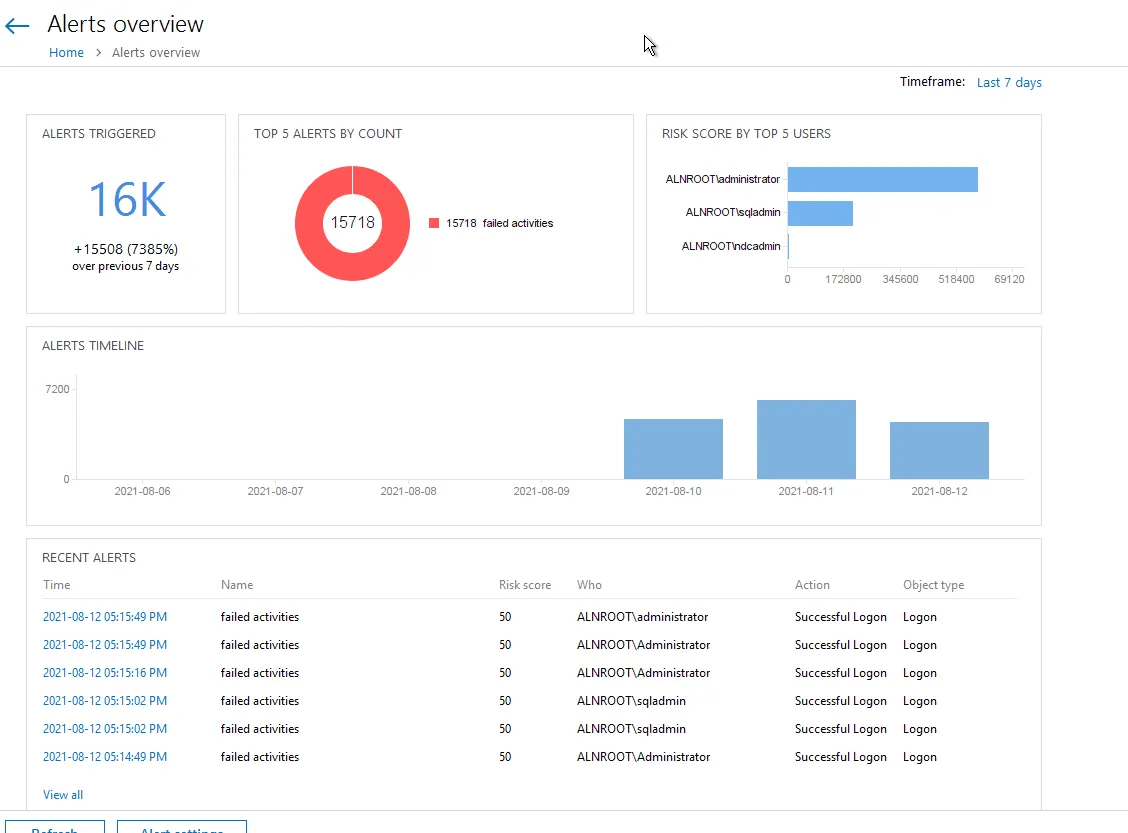
Aggregated statistics on the alerts is provided in the Alerts overview widget. It displays currently triggered alerts with detailed information.
To view the dashboard, on the main Auditor page, click the Alerts tile.
The dashboard includes the following widgets:
- Alerts triggered – Shows amount of alerts triggered for the last 7 days (by default). Use this tile to inspect the trend.
- Top 5 alerts by count – Shows most recently triggered alerts for the selected time period (7 days by default).
- Risk score by top 5 users – Shows potentially harmful users for the selected time period (7 days by default). Clicking the tile opens the Behavior Anomalies dashboard. See the Behavior Anomalies topic for additional information.
- Alerts timeline – Shows the number of alerts triggered at the specific day.
- Recent alerts – Shows all the triggered alerts in chronological order.
Clicking any tile except for Risk score by top 5 users drills down to the Alert history dashboard that provides users with the detailed information about the latest alerts triggered in their IT infrastructure enriched with the actionable chart and timeline.
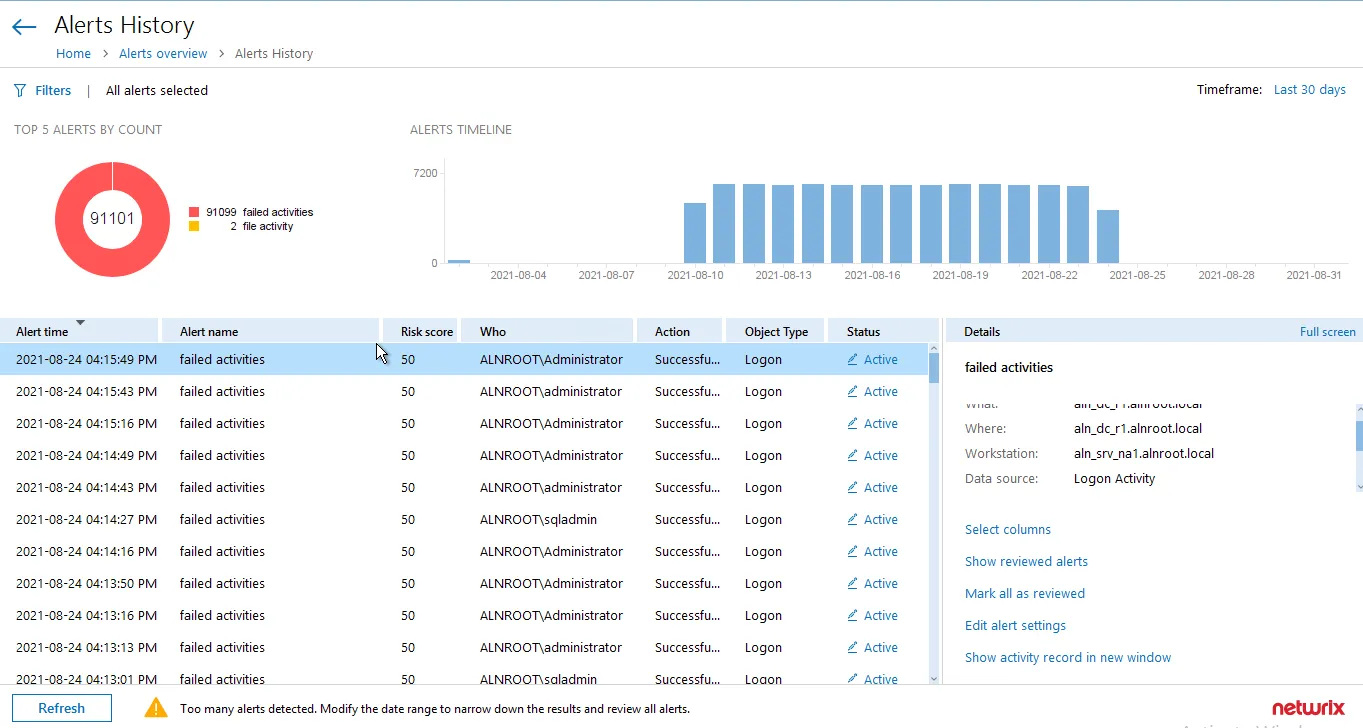
Review detailed information about the triggered alerts and change anomaly status. See the Review User Profiles and Process Anomalies topic for additional information.
On the Details pane, you can review alert details and manage your alerts:
- Select columns – Select columns to be displayed.
- Show reviewed alerts – Click to view all alerts you have already reviewed.
- Mark all as reviewed – Click to mark all alerts in the list as reviewed. Netwrix recommends doing this only if you are completely sure that there are no critical alerts in your infrastructure.
- Edit alerts settings – Click to modify settings of the selected alert. See the Create Alerts topic for additional information.
- Show activity record in new window – Click to view more information about the activity record that triggered an alert. See the Activity Records Statistics topic for additional information.
You can also refresh the alerts information by clicking the Refresh button at the bottom or go to the general alerts settings page clicking the Alert settings. See the Manage Alerts topic for additional information.
Alerts
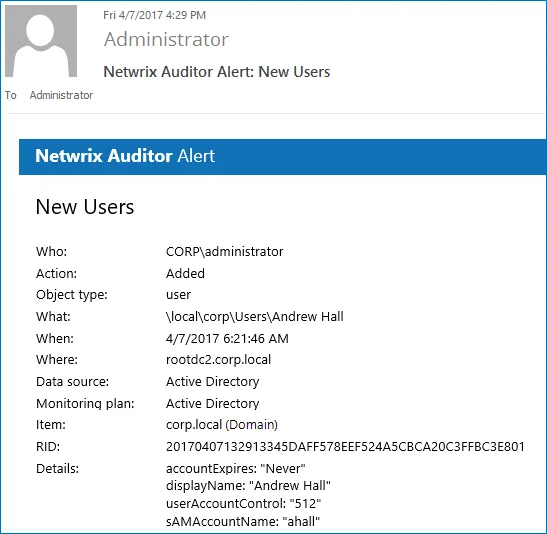
If you want to be notified about suspicious activity, you can configure alerts that will be triggered by specific events. Alerts are sent after the specified action has been detected. Alerts are helpful if you want to be notified about actions critical to your organization security and have to mitigate risks once the suspicious action occurs.
Review the following to take advantage of the Alerts functionality:
- See theManage Alerts topic for additional information on how to edit and enable existing predefined alerts, and create new alerts based on the predefined ones.
- See the Create Alerts topic for additional information on how to create custom alerts with your personal filters.
- If you need to be alerted on specific events in your Event Logs or non-owner mailbox access attempts, see the Create Alerts for Event Log and Create Alerts for Non-Owner Mailbox Access Events topics for additional information.
The example alert is triggered when a new user is created in the monitored domain.
Tags
Netwrix Auditor allows you to apply tags when creating an alert. Applying tags to alerts allows you to distinguish one alert from another or create groups of similar alerts.
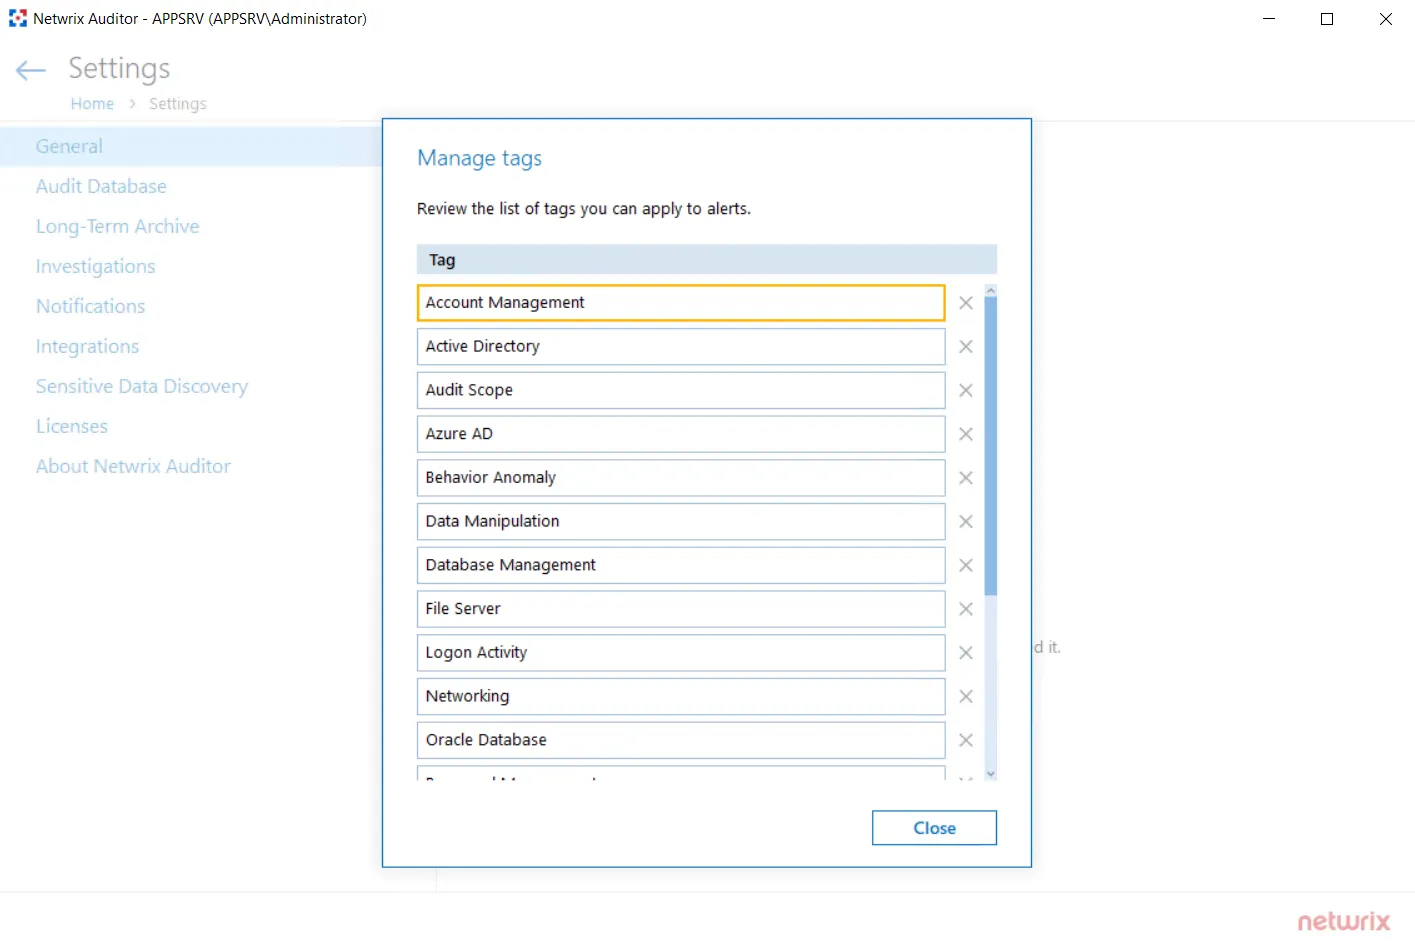
The Tags page contains a complete list of alerts that were created in the product. Currently, you cannot assign or create tags on this page.
To apply tags to an alert, navigate to alert settings and locate the Apply tags section on the General tab. See the Create Alerts topic to receive information about tags applying.