Network Traffic Compression
To reduce network traffic in distributed deployments, multi-site networks and other environments with remote locations that have limited bandwidth, it is recommended to use network traffic compression. For that purpose, special Netwrix utilities should be installed in the audited environment. These utilities will run on the target computers (depending on your monitoring plan), collect, pre-filter data and send it to Auditor Server in a highly compressed format.
With network traffic compression, data from the target machines is collected simultaneously, providing for network load balance and minimizing data collection time. (Unlike that, without network traffic compression the target machines will be processed sequentially, i.e. one at a time.) So, network traffic compression helps to increase scalability and optimize network traffic.
Its key capabilities are as follows:
- Allows Auditor to collect detailed metrics for the servers, log files, hardware and individual processes
- Collects audit data with no recognizable load on the server
- Communicates with Netwrix Auditor Server at predefined intervals, relaying data back to a central repository for storage
Network traffic compression is available for the following data sources:
- Active Directory
- Exchange
- File Servers
- Dell
- NetApp
- Windows Server
- Event Logs
- Group Policy
- Logon Activity
- SharePoint
- User Activity
To learn how to enable this feature, refer to the Create a New Monitoring Plan topic for additional information.
Troubleshooting
This section provides instructions on how to troubleshoot issues that you may encounter while using Netwrix Auditor.
If your issue is not listed in the table below, try searching Netwrix Knowledge Base.
If you need assistance from the Technical Support team, you can open a ticket using the Customer portal as described in the Creating a ticket with Customer portal section.
| Issue | Reason and solution |
|---|---|
| I cannot connect/logon to Auditor. | 1. You may have insufficient permissions. Contact your Auditor Global administrator to make sure that your account is delegated control of the product. 2. You are trying to connect to a remote Auditor specified by its IP address while the NTLM authentication is disabled. Try specifying a server by its name (e.g., EnterpriseWKS). |
| I do not receive any results while searching audit data or generating reports, or I am sure that some data is missing. | 1. No changes were detected. 2. You do not have sufficient permissions to review intelligence data. Contact your Global administrator. 3. Review your filter settings and make sure that your filters are properly configured. Try modifying your search. 4. You are looking for changes that occurred more than 180 days ago. These changes are no longer available for reporting and running searches. Ask your Auditor Global administrator to import audit data for a required date range from the Long-Term Archive. 5. Data collection for this monitoring plan might not have been launched two times yet or there was no data collection after this change; therefore, audit data has not been written to the Audit Database yet. 6. Some settings in Auditor are configured incorrectly. Contact your Auditor administrator to make sure that: - The monitoring plan you want to audit is properly configured, and the monitoring is enabled for each data source individually. - Audit Database settings are properly configured for each data source individually and Disable security intelligence and make data available only in activity summaries is cleared. Netwrix recommends to store all audit data on the same default SQL Server instance. |
| "No plans found" text in the Monitoring plan field. | Contact your Auditor Global administrator or Configurator to make sure that the monitoring plans exist and are properly configured. |
| I see a blank window instead of a report. | Contact your Auditor Global administrator to make sure that you are granted sufficient permissions on the Report Server. To view reports in a web browser - Open a web browser and type the Report Manager URL (found under Settings>Audit Database). In the page that opens, navigate to the report you want to generate and click the report name. You can modify the report filters and click View Report to apply them. |
| I configured report subscription to be uploaded to a file server, but cannot find it / cannot access it. | Subscriptions can be uploaded either to a file share (e.g., \filestorage\reports) or to a folder on the computer where Auditor Server is installed. To access these reports, you must be granted the Read permission. |
When trying to collect event data from Active Directory domain, an error message like this appears in Netwrix Health Log: Monitoring Plan: <Monitoring_Plan_Name> The following error has occurred while processing '<Item_Name>': Error collecting the security log of the domain <Domain_Name>. Failed to process the domain controller <Domain_Controller_Name> due to the following error: The service cannot be started, either because it is disabled or because it has no enabled devices associated with it. | This may happen due to Secondary Logon Service disabled state. To collect event data from the domain, this service must be up and running. Open its properties and start the service. |
| The 'Workstation' field in search, reports, and Activity Summary is reported as 'unknown' | For the full list of possible reasons, please refer to the following Netwrix Knowledge Base article: Why is the "Workstation" field reported as "unknown"? |
Creating a ticket with Customer portal
-
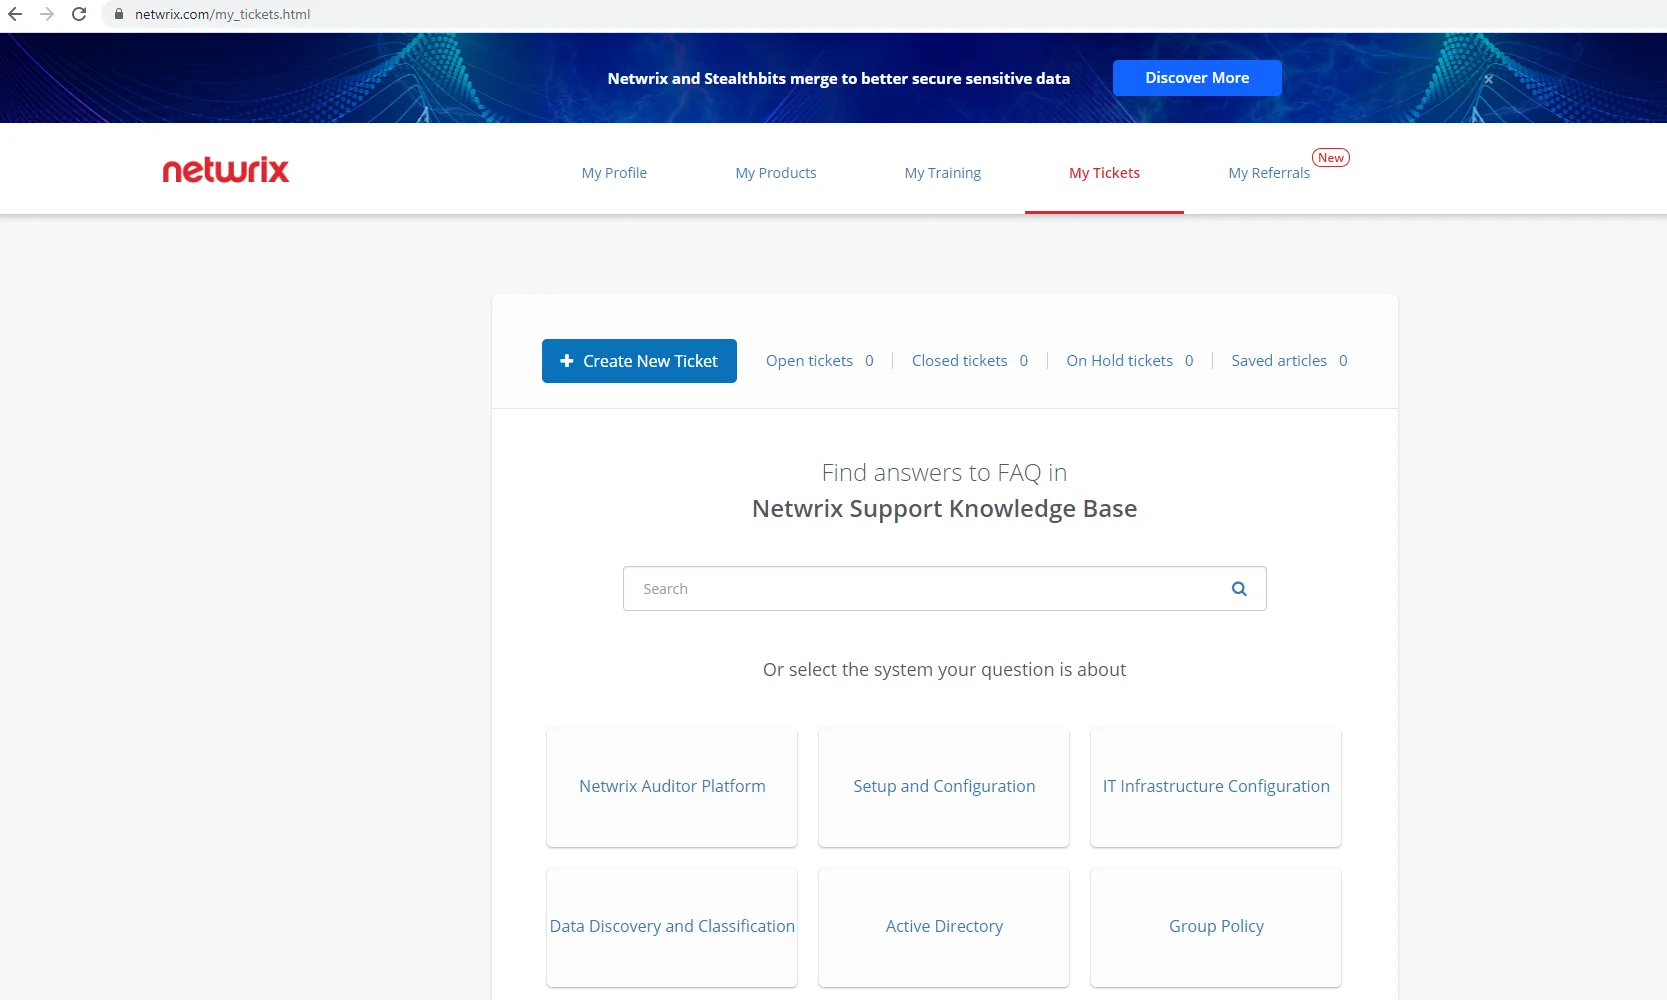
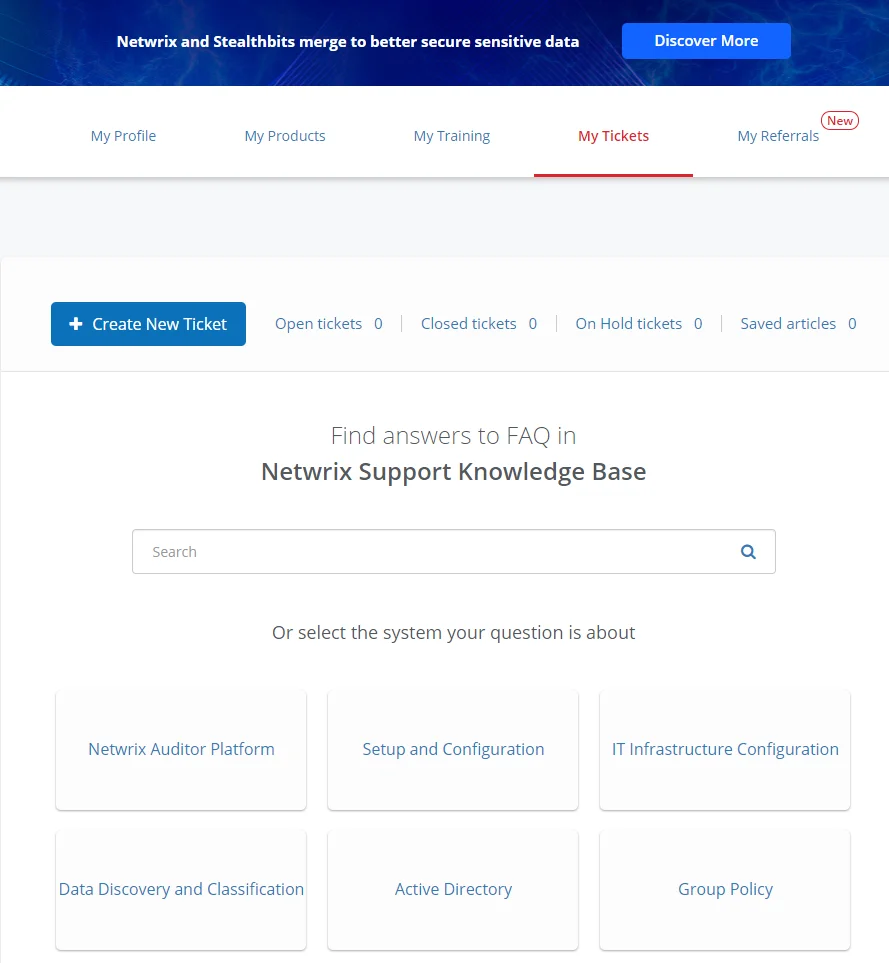
Sign in at https://www.netwrix.com/my_tickets.html.
-
You can search or browse through the Knowledge Base articles here, or click Create New Ticket:
-
Fill in the form, describing the issue, and click Open a ticket.
-
After that, you will be able to attach the files you need (screenshots, emails, reports, etc.).