Alerts Overview Dashboard
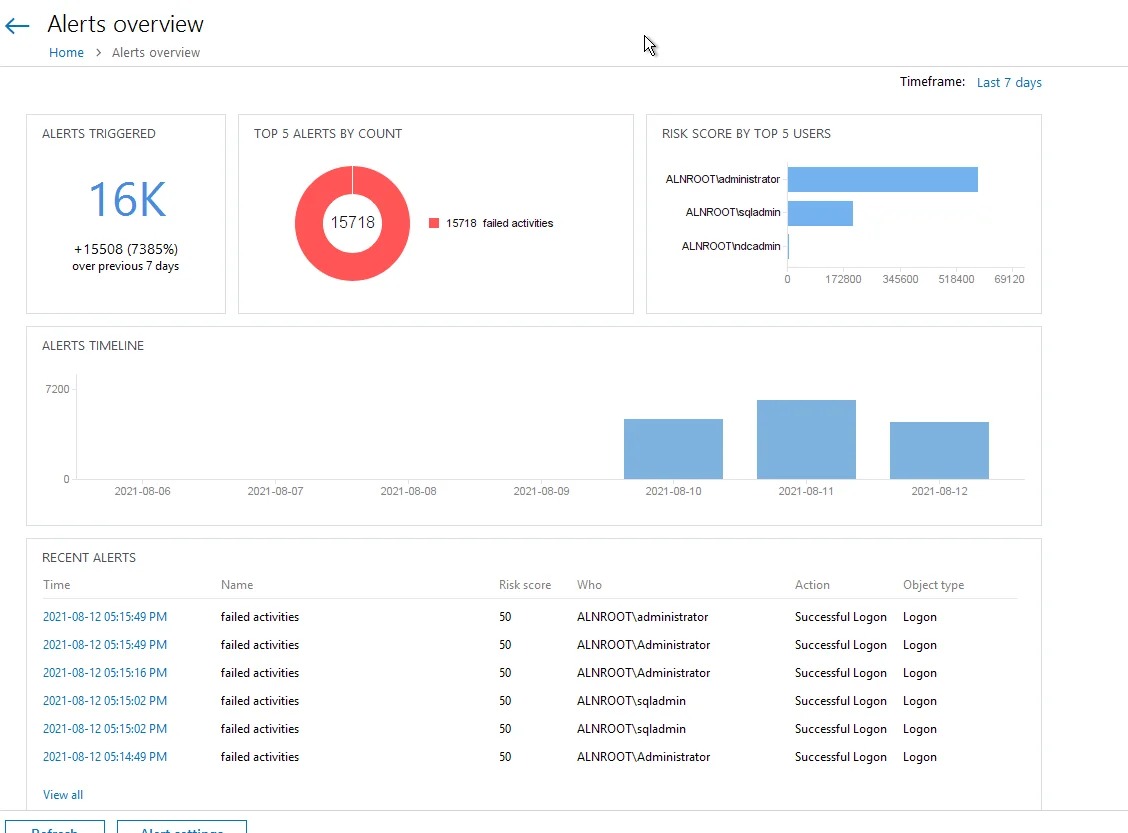
Aggregated statistics on the alerts is provided in the Alerts overview widget. It displays currently triggered alerts with detailed information.
To view the dashboard, on the main Auditor page, click the Alerts tile.
The dashboard includes the following widgets:
- Alerts triggered – Shows amount of alerts triggered for the last 7 days (by default). Use this tile to inspect the trend.
- Top 5 alerts by count – Shows most recently triggered alerts for the selected time period (7 days by default).
- Risk score by top 5 users – Shows potentially harmful users for the selected time period (7 days by default). Clicking the tile opens the Behavior Anomalies dashboard. See the Behavior Anomalies topic for additional information.
- Alerts timeline – Shows the number of alerts triggered at the specific day.
- Recent alerts – Shows all the triggered alerts in chronological order.
Clicking any tile except for Risk score by top 5 users drills down to the Alert history dashboard that provides users with the detailed information about the latest alerts triggered in their IT infrastructure enriched with the actionable chart and timeline.
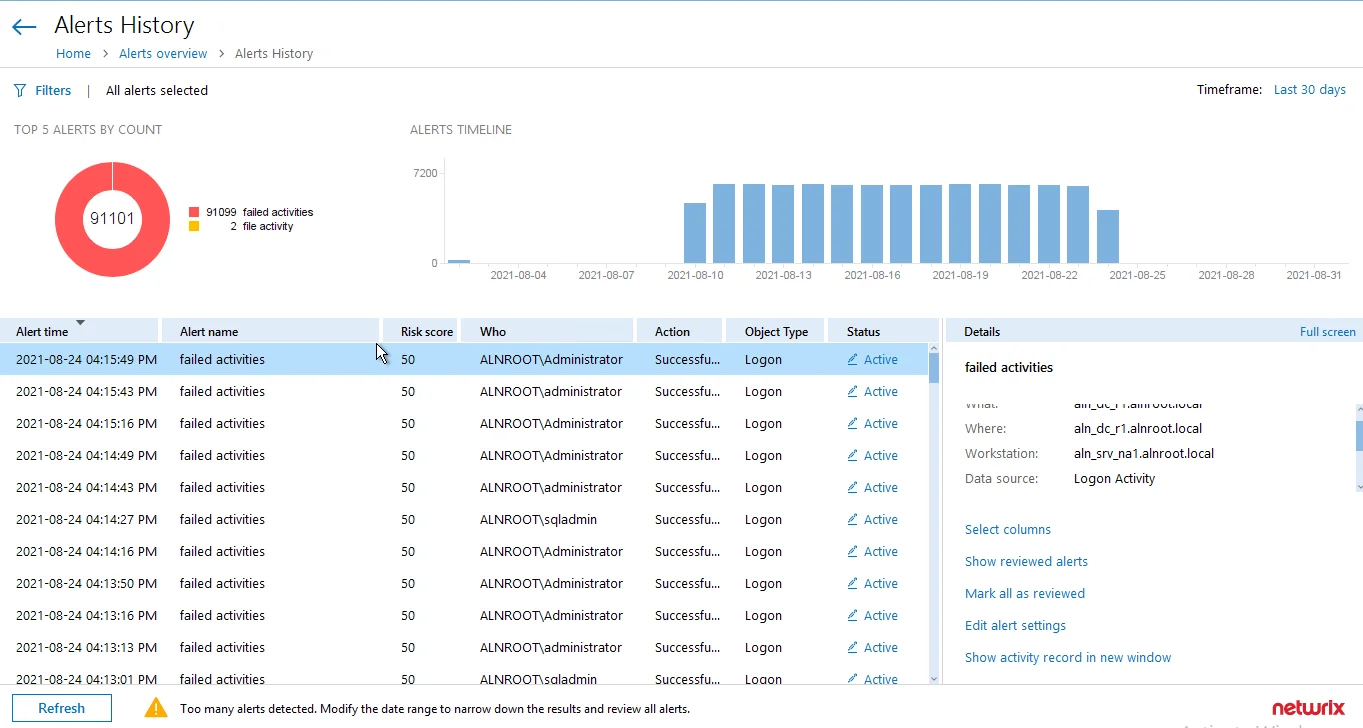
Review detailed information about the triggered alerts and change anomaly status. See the Review User Profiles and Process Anomalies topic for additional information.
On the Details pane, you can review alert details and manage your alerts:
- Select columns – Select columns to be displayed.
- Show reviewed alerts – Click to view all alerts you have already reviewed.
- Mark all as reviewed – Click to mark all alerts in the list as reviewed. Netwrix recommends doing this only if you are completely sure that there are no critical alerts in your infrastructure.
- Edit alerts settings – Click to modify settings of the selected alert. See the Create Alerts topic for additional information.
- Show activity record in new window – Click to view more information about the activity record that triggered an alert. See the Activity Records Statistics topic for additional information.
You can also refresh the alerts information by clicking the Refresh button at the bottom or go to the general alerts settings page clicking the Alert settings. See the Manage Alerts topic for additional information.