Working with Collected Data
To leverage data collected with the add-on, you can do the following in Netwrix Auditor:
- Search for required data. For that, start Netwrix Auditor client and navigate to Search. After specifying the criteria you need, click Search. You will get a list of activity records with detailed information on who did what in the reported time period.
You might want to apply a filter to narrow down your search results to the Netwrix API data source only.
- Also, you can click Tools in the upper-right corner and select the command you need. For
example:
- If you want to periodically receive the report on the results of search with the specified criteria, click Subscribe. Then specify how you want the report to be delivered – as an email or as a file stored to the file share.
- To create an alert on the specific occurrences, click Create alert.
- To export filtered data to PDF or CSV, click Export data.
- You can also configure and receive alerts on the events you are interested in.
Deployment Scenarios
The Add-On can run on any computer in your environment. For example, you can run the add-on on the computer where Auditor is installed, or on a remote server. Depending on the deployment scenario you choose, you will need to define a different set of parameters
Netwrix suggests the following scenarios:
| Scenario | Example: Parameters updated in default settings.xml |
|---|---|
| The add-on runs on the Netwrix Auditor Server with the current user credentials. | <Address>172.28.4.15</Address> <Address>172.28.3.18</Address> |
| The add-on runs on the Netwrix Auditor Server with the explicitly specified user credentials. | <NetwrixAuditorUserName>SecurityOfficer </NetwrixAuditorUserName> <NetwrixAuditorPassword>NetwrixUser </NetwrixAuditorPassword> <Address>172.28.4.15</Address> |
| The add-on runs on a remote computer. Data is written to a remote Netwrix Auditor repository with the current user credentials. | <NetwrixAuditorEndpoint> https://172.28.6.19:9699/netwrix/api/v1/activity_records</NetwrixAuditorEndpoint> <Address>172.28.4.15</Address> |
| The add-on runs on a remote computer. Data is written to a remote Netwrix Auditor repository with the explicitly specified user credentials. | <NetwrixAuditorEndpoint> https://172.28.6.19:9699/netwrix/api/v1/activity_records</NetwrixAuditorEndpoint> <NetwrixAuditorUserName>NetwrixUser </NetwrixAuditorUserName> <NetwrixAuditorPassword>NetwrixIsCool </NetwrixAuditorPassword> <Address>172.28.4.15</Address> |
For security reasons, Netwrix recommends running the script with current user credentials (skipping user credentials). Create a special user account with permissions to both Auditor data and event log and use it for running the script.
Monitoring Scope
Review a full list of all events Netwrix Auditor can collect on Qumulo Cluster.
| Event | Description |
|---|---|
| fs_create_directory | A new directory was created. |
| fs_create_file | A new file was created. |
| fs_create_hard_link | A new hard link was created. |
| fs_create | A filetype other than one of the types captured above was created. |
| fs_delete | An entity (file, link, directory) was deleted from the file storage. |
| fs_rename | An entity (file, link, directory) from the file storage was renamed. |
| fs_read_data | Read operation was performed. |
| fs_write_data | Write operation was performed. |
| fs_write_metadata | Write operation was performed (metadata was written). |
| nfs_create_export | Created NFS Export that the client will mount to. |
| nfs_delete_export | Removed NFS Export that the client will mount to. |
| nfs_modify_export | Modified NFS Export that the client will mount to. |
| nfs_mount | Mount to NFS share. |
| replication_create_source_relationship | A replication object was created. |
| replication_delete_source_relationship | A replication object was deleted. |
| replication_modify_source_relationship | A replication object was modified. |
| smb_create_share | A new SMB file share was created. |
| smb_delete_share | An SMB file share was deleted. |
| smb_modify_share | An SMB file share was modified. |
| snapshot_create_snapshot | A snapshot was created. |
| snapshot_delete_snapshot | A snapshot was deleted. |
| snapshot_modify_snapshot | A snapshot was modified. |
Qumulo
Netwrix Auditor is a visibility platform for user behavior analysis and risk mitigation that enables control over changes, configurations and access in hybrid IT environments to protect data regardless of its location. The platform provides security analytics to detect anomalies in user behavior and investigate threat patterns before a data breach occurs.
Qumulo Hybrid Cloud File Storage delivers real-time visibility, scale, and control of data across on-prem and cloud. Qumulo customers understand storage at a granular level; programmatically configure and manage usage, capacity, and performance; and are continuously delighted with new capabilities, 100% usable capacity and direct access to experts. More information at www.qumulo.com.
To control who does what in the IT infrastructure that includes Qumulo Hybrid Cloud File Storage, organizations need to monitor file-related activity. A typical case is when a user has renamed a directory at the top level, and other users are unable to locate their files anymore. Thus, IT specialists require a way to monitor, search and get notifications on certain file activity so that they can take corrective measures.
For that purpose, you can use a specially designed Netwrix Auditor add-on for Qumulo. It works in collaboration with Netwrix Auditor, supplying data about file operations on your Qumulo Cluster to Netwrix database. Aggregating data into a single audit trail simplifies analysis, makes activity monitoring more cost-effective, and helps you keep tabs on your IT infrastructure.
Major benefits:
- Gain a high-level view of the data you store
- Detect unauthorized activity that might threaten your data
How it Works
The add-on is implemented as a Syslog service that collects activity data from Qumulo Cluster and sends it to Auditor using the Integration API.
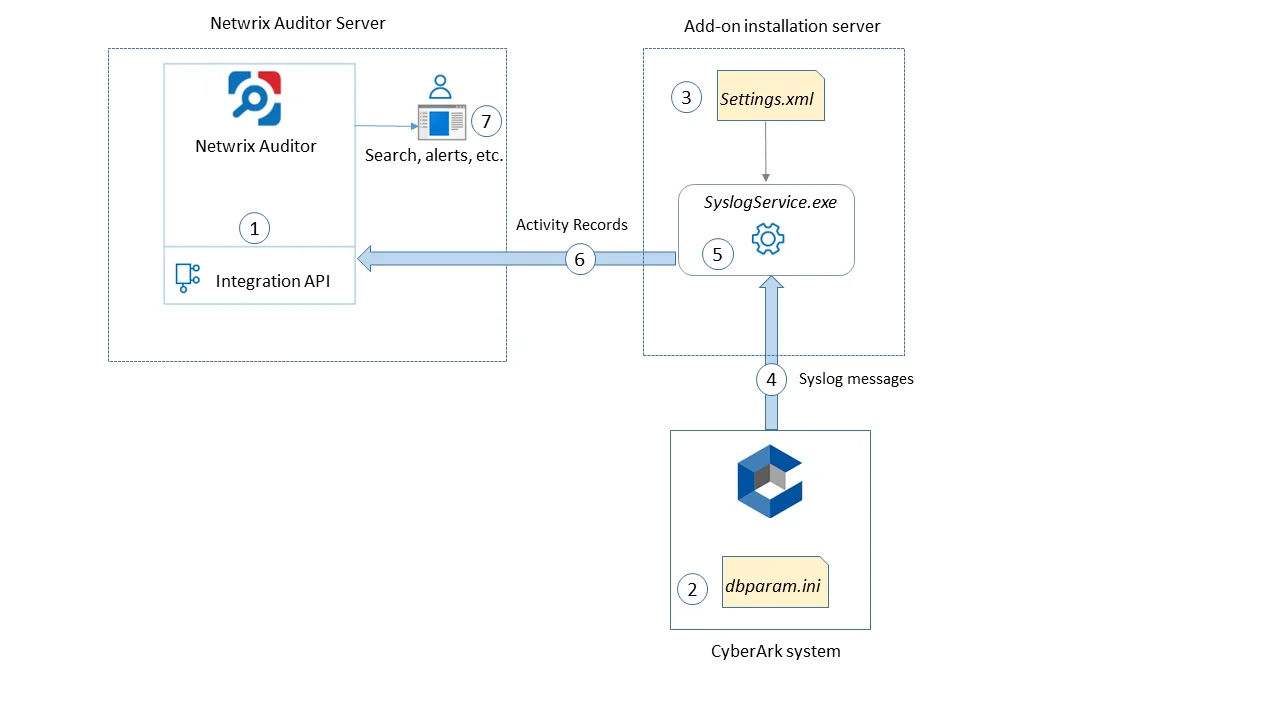
On a high level, the solution works as follows:
-
An IT administrator configures the Integration API settings to enable data collection and storage to the Netwrix database for further reporting, search, etc.
It is recommended to create a dedicated monitoring plan in Netwrix Auditor and add a dedicated item of Integration type to it — then you will be able to filter data in reports and search results by monitoring plan/item name.
-
On the Qumulo side, the IT administrator prepares Syslog configuration settings.
-
Then the administrator opens the settings.xml configuration file and specifies the necessary parameters for add-on operation, including Qumulo Cluster as the source of Syslog messages, Auditor settings, etc. The add-on will operate as a Syslog listener for the Qumulo Cluster.
-
The add-on starts collecting and forwarding activity data: it listens to the specified TCP port and captures the designated Syslog messages. Data communication is performed using the TCP version of Syslog protocol.
-
The add-on processes these Syslog messages into Auditor-compatible format (Activity Records). Each Activity Record contains the "Who-What-When-Where-Action" information (that is, initiator's account, time, action, and other details).
-
Using the Integration API, the add-on sends the activity records to Auditor Server that writes them to the Netwrix_Auditor_API database (SQL server database) and file-based Long-Term Archive. Data is sent periodically, by default every 5 seconds. For more information on the Activity Record structure and capabilities of the Integration API, refer to the Integration API topic.
-
Users open Auditor Client to work with collected data:
- Search for file changes using certain criteria
- Export data to PDF or CSV files
- Save search results as reports
- Subscribe to search results
- Configure and receive alerts
Add-on Delivery Package
The add=on delivery package is a ZIP archive that includes the following files:
| File name | Description |
|---|---|
| install.cmd | Command file that installs and enables Netwrix Syslog service. |
| settings.xml | Contains parameters for the add-on service operation. |
| SyslogService.exe | The Syslog service – main add-on component, implemented as a Syslog service. |
| SyslogService.exe.config | Add-on configuration data. |
You will also need the qumulo.xml file that contains rules for processing Qumulo events. This file is shipped separately.
Prerequisites
Before running the add-on, ensure that all the necessary components and policies are configured as follows:
| Where | Prerequisite to check |
|---|---|
| The Auditor Server side | - Auditor version is 9.96 or higher. - Integration API settings and Netwrix_Auditor_API database are configured properly. See Configure Integration API and Audit Database. - The TCP 9699 port must be open on Windows firewall for inbound connections. - User account under which data will be written to Netwrix_Auditor_API database requires the Contributor role in Netwrix Auditor. See Role-Based Access and Delegation. Alternatively, you can grant it the Global administrator role, or add that account to the Netwrix Auditor Administrators group. |
| The machine where the add-on will be installed | - The TCP 9905 port must be open on Windows firewall for inbound connections. - .NET Framework 4.5 or later must be installed. |
| Qumulo Cluster | Qumulo core version 3.0.5. |
Accounts and rights
It is recommended to create a dedicated account for running install.cmd and SyslogService.exe. The service will connect to Auditor Server using this account, so at least the Contributor role in Auditor is required for it. See Role-Based Access and Delegation for more information.
Considerations and limitations
- For events received with NFS3 protocol, the posix uid will be displayed instead of the initiator's account name in the "Who" field of the Auditor search results and activity summaries.
- If the initiator's account name could not be resolved, then Windows SID or Qumulo auth ID will be displayed in the the "Who" field of the search results and activity summaries.
- Currently, not every detail about permission and attribute changes may be provided by Qumulo Cluster, so they cannot be reported by Auditor.
- If the monitoring plan name in the add-on configuration parameter is specified incorrectly, this may lead to temp files generation and, therefore, to inefficient disk space usage.
Compatibility Notice
(Undefined variable: Add-on.Addon_Qumulo) is compatible with Qumulo core 3.0.5 and with Netwrix Auditor 9.96 and later.
Add-On Parameters
To configure the add-on parameters, you need to edit the settings.xml file in the add-on folder. You must define connection details: Netwrix Auditor Server host, user credentials, etc.
Most parameters are optional, the service uses the default values unless parameters are explicitly
defined (_<parameter>\*\*\_value_\*\*</parameter>\_). You can skip or define parameters depending on
your execution scenario and security policies.
Parameters in settings.xml can be grouped as follows:
- General parameters that affect add- on execution. They are listed in the table below.
- Settings for a certain event source (within the Source section) that can override general settings.
- Internal parameters that should not be modified in most cases. They are listed in .
| Parameter | Default value | Description |
|---|---|---|
| General parameters | ||
| ListenTcpPort | 9905 | Specify TCP port for listening incoming syslog events. |
| NetwrixAuditorEndpoint | https://localhost: 9699/netwrix/api/ v1/activity_records | Netwrix Auditor Server IP address and port number followed by endpoint for posting Activity Records. Assumes that the add-on runs on the computer hosting Auditor Server and uses default port 9699. If you want to run the add-on on another machine, provide a name of the computer where Auditor Server resides (e.g., 172.28.6.15, EnterpriseNAServer, WKS.enterprise.local). To specify a non-default port, provide a server name followed by the port number (e.g., WKS.enterprise.local:9999). Do not modify the endpoint part (/netwrix/api . . . . ) |
| NetwrixAuditor CertificateThumbprint | NOCHECK | Netwrix Auditor Certificate Thumbprint Property. Possible values: - Empty—Check Netwrix Auditor certificate via Windows Certificate Store. - AB:BB:CC.—Check Netwrix Auditor Server certificate thumbprint identifier. - NOCHECK—Do not check Netwrix Auditor certificate. Make sure to select this parameter if you plan to specify servers by their IP. |
| NetwrixAuditorUserName | Current user credentials | Unless specified, the add-on runs with the current user credentials. If you want the add-on to use another account to connect to Auditor Server, specify the account name in the DOMAIN\username format. The account must be assigned the Contributor role in Netwrix Auditor. |
| NetwrixAuditorUserPassword | Current user credentials | Unless specified, the service runs with the current user credentials. Provide a different password if necessary. |
| NetwrixAuditorDateTimeFormat | yyyy-MM-ddTHH:mm:ssZ | Netwrix Auditor time format. By default, set to zero offset. |
| NetwrixAuditorPlan | — | Unless specified, data is written to Netwrix_Auditor_API database and is not associated with a specific monitoring plan. Specify a name of associated monitoring plan in Auditor. In this case, data will be written to a database linked to this plan. If you select a plan name in the add-on, make sure a dedicated plan is created in Auditor, the Netwrix API data source is added to the plan and enabled for monitoring. Otherwise, the add-on will not be able to write data to the Audit Database. |
| NetwrixAuditorPlanItem | — | Unless specified, data is not associated with a specific plan and, thus, cannot be filtered by item name. Specify an item name. Make sure to create a dedicated item in Netwrix Auditor in advance. |
| EventStorePath | — | Select where to store temporary files of syslog messages before the add-on sends them to Netwrix Auditor Server. Netwrix recommends not to store these files out of the service directory. |
| LogLevel | error | Specify logging level: - none - info - warning - error (used by default) - debug |
| WriteCriticalIssues ToEventLog | 0 | Instructs the add-on to write important events (like service start or critical issue) not only to its own log but also to Netwrix event log. - 1=yes - 0=no (default) |
| Parameters within SourceList You can specify parsing rules for each specific event source and define parameters to override general settings, such as time zone, default plan name, etc. | ||
| NetwrixAuditorPlan | — | When specified, overrides the general settings. |
| NetwrixAuditorPlanItem | — | When specified, overrides the general settings. |
| DefaultTsTimezone | — | Define the time zone of syslog events. By default, set to zero offset (UTC). |
| AppNameRegExp | — | Define a custom regular expression pattern to retrieve the application name from your syslog messages. Unless specified, RFC 3164/5424 format is used. If you provide a pattern for application name, this name will be used to determine what rule file will be used to parse syslog messages. The pattern you provide here must match the application name in your custom rule file. |
| AppNameGroupID | — | Define application name value by Group ID only if messages are not formatted in accordance with RFC 3164/5424. Otherwise, leave the default value. |
| RuleFileList PathFile | qumulo.xml | Specify paths to XML file(s) with regular expression parsing rules. You can create a custom file or use rules provided out of the box. Currently, the qumulo.xml rules file is provided by Qumulo. You can specify several rule files. The service will check if the AppName parameter in the first rule file matches the AppNameRegExp and AppNameGroupID regular expression in this file. If not, the service will proceed to the next rule file. |
| AcceptList Address | — | Specify a list of IP addresses of syslog events sources. The service will collect and process events from these sources only. Events collected from any other source will be ignored. The Address parameter may be followed by optional attributes that override parameters specified above: - naplan—A name of associated monitoring plan - naplanitem—A name of associated item - tstimezone—Timezone for Qumulo Cluster For example: <Address naplan="NFSmonitoring" naplanitem="NFS" tstimezone="GMT StandardTime">172.28.3.15 </Address> |
After you modify parameters in the settings.xml file, remember to save the changes and then restart (Undefined variable: Add-on.Addon_Qumulo) service (SyslogService.exe) for them to take effect.
Add-on Internal Parameters
Internal parameters listed in the table below are intended for performance tuning. In most cases the default values should be used.
| Parameter | Default value | Description |
|---|---|---|
| EventsFromMemoryFirst | 1 | Instructs the add-on to save events to temporary storage only if there is no free space in queues: - 1=yes - 0=no |
| ConcurrentSend | -1 | Specifies number of threads for concurrent forwarding of events to Auditor. Default value is -1 (switch off concurrent forwarding). |
| ListenTcpAddress | 0.0.0.0 | Defines destination IP address. In case of multiple network cards, you can specify certain IP address here to listen to its messages only. |
| SenderSleepTime | 30 | Specifies retry interval in seconds to send messages to Auditor (30 - 3600 seconds). |
| TaskLimit | 8 | Specifies number of threads and queues for concurrent handling of events. |
| QueueSizeLimit | 1000 | Specifies maximum number of events to keep in queue before saving to temporary storage or sending to Netwrix API. |
| QueueTimeLimit | 5 | Specifies the length of timeout before events from queue (not full) are saved to temporary storage or sent to Netwrix API: - From 5 to 300 — timeout in seconds. - -1 — disable timeout. |
Maintenance and Troubleshooting
(Undefined variable: Add-on.Addon_Qumulo) operations are logged into the SyslogService.txt file. This file is located in the same folder as SyslogService.exe.
To change the add-on logging level, use the LogLevel parameter in the settings.xml file.
- It is recommended that before the first run you set this parameter to
debug. This will facilitate operations tracking and possible problem solving. - After that it is strongly recommended to re-set this parameter to
error(default value) to prevent the uncontrolled log growth.
If you cannot see collected data in Netwrix Auditor, check the following:
- Service account has sufficient rights to access Netwrix Auditor.
- In Netwrix Auditor settings, go to the Integrations section and make sure the Leverage Integration API is switched to ON. Check the communication port number – default is 9699.
- If you configured a dedicated monitoring plan, make sure data source monitoring is enabled.
- Verify the parameters you provided in settings.xml.
Configure Core Audit for Qumulo File Servers
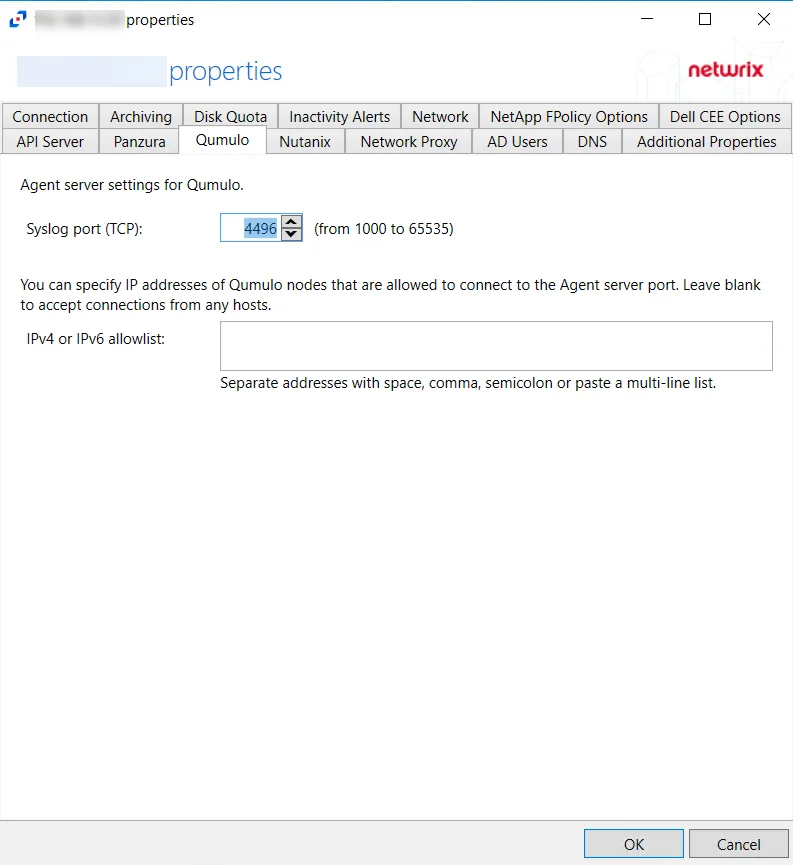
To configure your Qumulo file servers for auditing, you need to connect your device to Active Directory or LDAP (local names are supported) and then configure Remote Syslog Address and port number via Web UI.
To configure Core Audit for Qumulo file servers
-
Log in to the Web UI.
-
Navigate to Cluster and click Audit.
-
Under the Configuration, provide the following:
- Remote Syslog Address – Provide the IP address or the computer listened by Syslog. It should be a third-party Syslog forward service or the machine where Netwrix Auditor is installed.
- Port Number – use the default value (514).

When you see the green line “Connected”, the environment is ready.
For detailed information about Qumulo Web UI. refer to the following Qumulo how-to article: Qumulo Core Audit Logging.
Qumulo
Netwrix Auditor relies on native logs for collecting audit data. Therefore, successful change and access auditing requires a certain configuration of native audit settings in the audited environment and on the Auditor console computer. Configuring your IT infrastructure may also include enabling certain built-in Windows services, etc. Proper audit configuration is required to ensure audit data integrity, otherwise your change reports may contain warnings, errors or incomplete audit data.
CAUTION: Folder associated with Netwrix Auditor must be excluded from antivirus scanning. See the Antivirus Exclusions for Netwrix Auditor knowledge base article for additional information.
You can configure your IT Infrastructure for monitoring in one of the following ways:
-
Automatically through a monitoring plan – This is a recommended method. If you select to automatically configure audit in the target environment, your current audit settings will be checked on each data collection and adjusted if necessary.
-
Manually – Native audit settings must be adjusted manually to ensure collecting comprehensive and reliable audit data. You can enable Auditor to continually enforce the relevant audit policies or configure them manually:
- The Remote Syslog Address and port number must be configured as described in the Configure Core Audit for Qumulo File Servers topic.
Review a full list of object types Netwrix Auditor can collect on Qumulo network devices.
| Action | File | Folder | Share |
|---|---|---|---|
| Added | + | + | + |
| Add (failed attempt) | + | + | - |
| Modified | + | + | + |
| Modify (failed attempt) | - | - | - |
| Moved | + | + | - |
| Move (failed attempt) | - | - | - |
| Read | + | + | - |
| Read (failed attempt) | + | + | - |
| Renamed | + | + | - |
| Rename (failed attempt) | - | - | - |
| Removed | + | + | + |
| Remove (failed attempt) | - | - | - |
| Copied | - | - | - |
NOTE: For Qumulo system Auditor displays the actual time when the event occurred. The 'When' column shows the time when the syslog message arrived.
If an object has been moved between file shares, the product reports the following actions:
-
Read + Removed for the initial object;
-
Added + Modified for the object to a new location.
Permissions for Qumulo Auditing
Before you start creating a monitoring plan to audit your Qumulo or Synology file servers, plan for the account that will be used for data collection – it should meet the requirements listed below. Then you will provide this account in the monitoring plan wizard (or monitored item settings).
You can also use group Managed Service Accounts (gMSA) as data collecting accounts.
See the Use Group Managed Service Account (gMSA) topic and the Group Managed Service Accounts Overview Microsoft article for additional information.
These group Managed Service Accounts should meet the related requirements, as listed below.
The account for data collection can be either local (Qumulo account) or domain-based.
The following permissions are required:
- An account with the "Observers" role to monitor a Qumulo cluster. Assign the Observers role to the user using Cluster > Role Management.
- The account requires Read share permission on the audited shared folders.
- The account requires Read NTFS permission on all objects in the audited folders.