Nutanix Tab
The Nutanix tab provides features to configure settings for monitoring Nutanix devices.
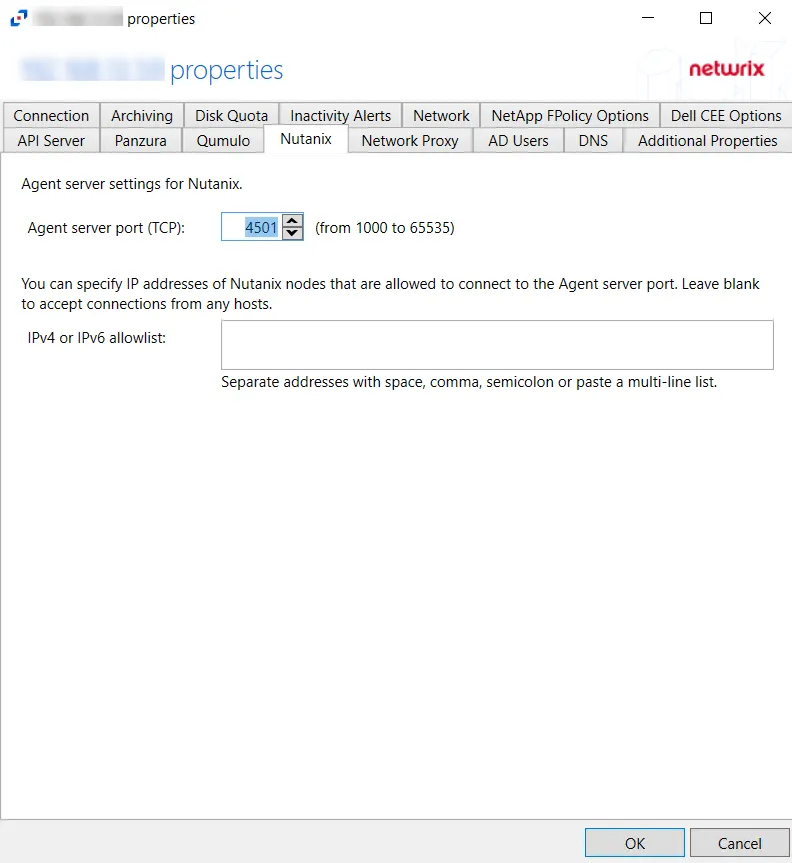
The available Agent server settings for Nutanix are:
-
Agent server port (TCP) – Enter the TCP port that Nutanix will use to connect to the agent. The agent will add the port to the firewall exclusions automatically. The default is 4501.
-
IPv4 or IPv6 allowlist – Specify the IP addresses of the Nutanix nodes, which are allowed to connect to the agent server port. Multiple addresses can be entered separated by space, comma (,), semicolon (;), or as a multi-line list. Leave the box blank to accept connections from any hosts.
NOTE: This setting is optional and it allows you to improve security by limiting the number of IP addresses allowed to connect.
Click OK to commit the modifications. Click Cancel to discard the modifications. The Agent Properties window closes.
Nutanix
Understanding File Activity Monitoring
The Activity Monitor can be configured to monitor the following:
- Ability to collect all or specific file activity for specific values or specific combinations of values
It provides the ability to feed activity data to SIEM products. The following dashboards have been specifically created for Activity Monitor event data:
- For IBM® QRadar®, see the Netwrix File Activity Monitor App for QRadar for additional information.
- For Splunk®, see the File Activity Monitor App for Splunk for additional information.
It also provides the ability to feed activity data to other Netwrix products:
- Netwrix Access Analyzer (formerly Enterprise Auditor)
- Netwrix Threat Prevention
- Netwrix Threat Manager
Prior to adding a Nutanix files host to the Activity Monitor, the prerequisites for the target environment must be met. See Nutanix Files Activity Auditing Configuration for more information.
Remember, the Activity Agent must be deployed to a Windows server that acts as a proxy for monitoring the target environment.
Network Adapter for Nutanix File Server
Ensure that the correct network adapter is specified in the Network page for an agent before adding a Nutanix file server to be monitored.
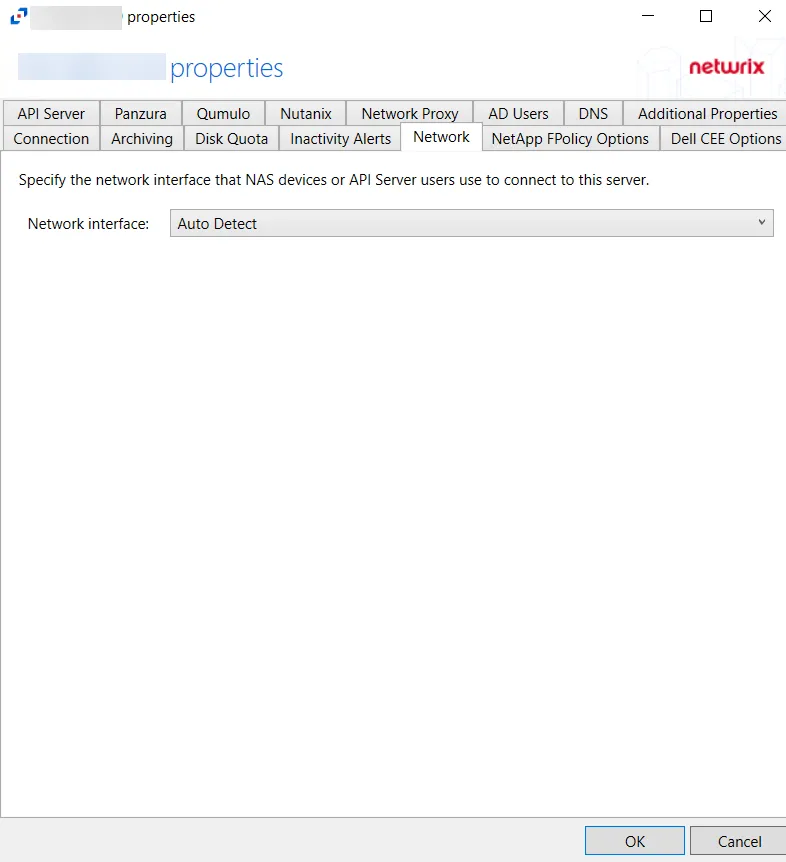
The agent registers the IP address of the network adapter in the Nutanix auditing configuration for activity delivery. Nutanix Files server connects to the agent using the TCP port 4501. See the Network Tab topic for additional information.
Add Nutanix Host
Follow the steps to add a Nutanix files host to be monitored.
Step 1 – In Activity Monitor, go to the Monitored Hosts tab and click Add. The Add New Host window opens.
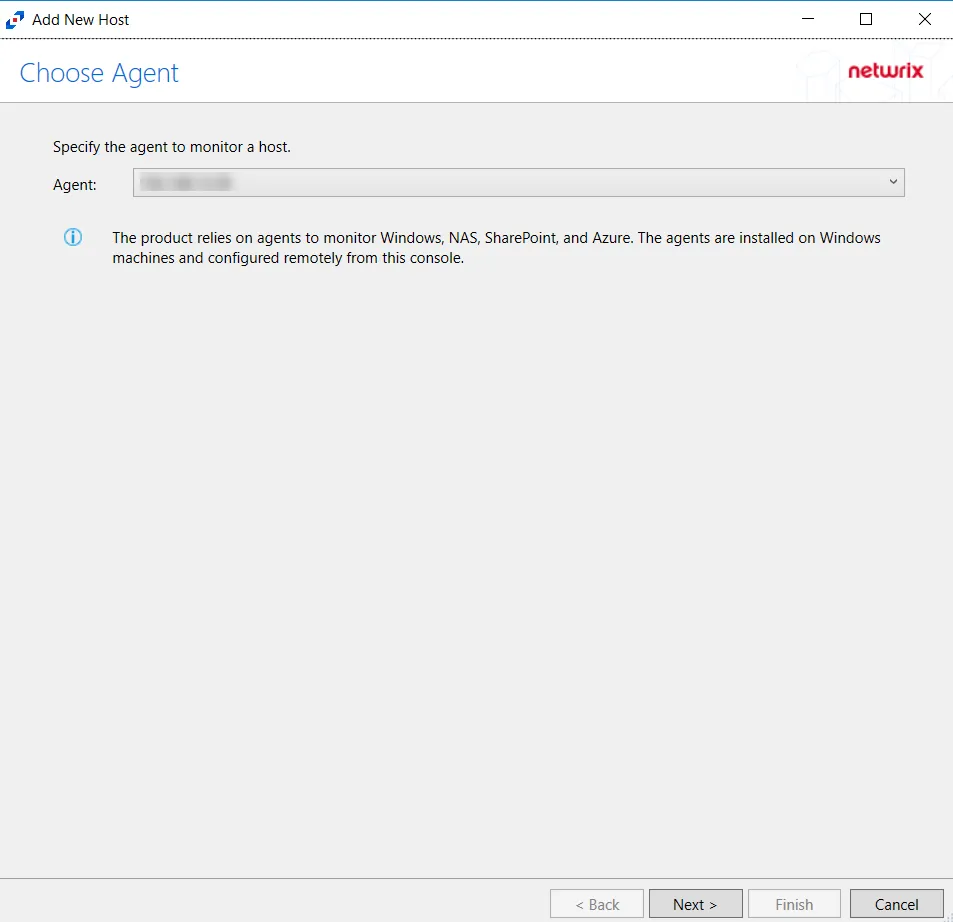
Step 2 – On the Choose Agent page, select the Agent to monitor the file server from the drop-down list. Click Next.
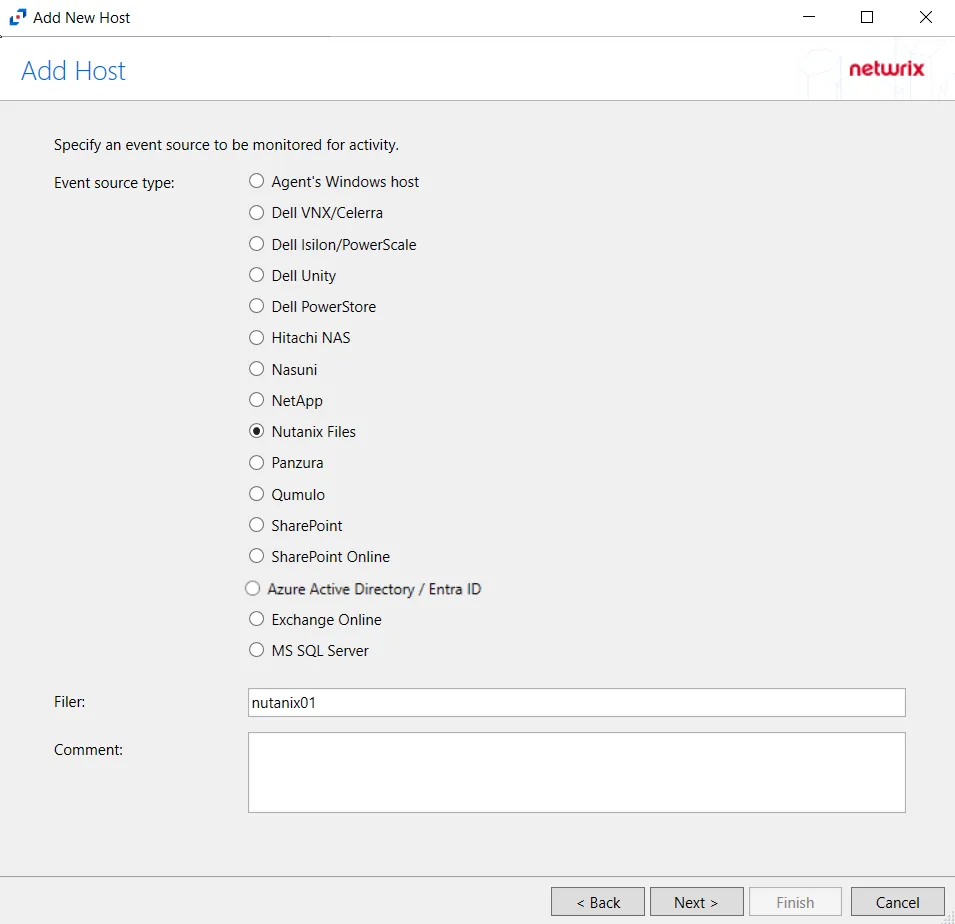
Step 3 – On the Add Host page, select the Nutanix Files radio button and enter the file server name. Click Next.
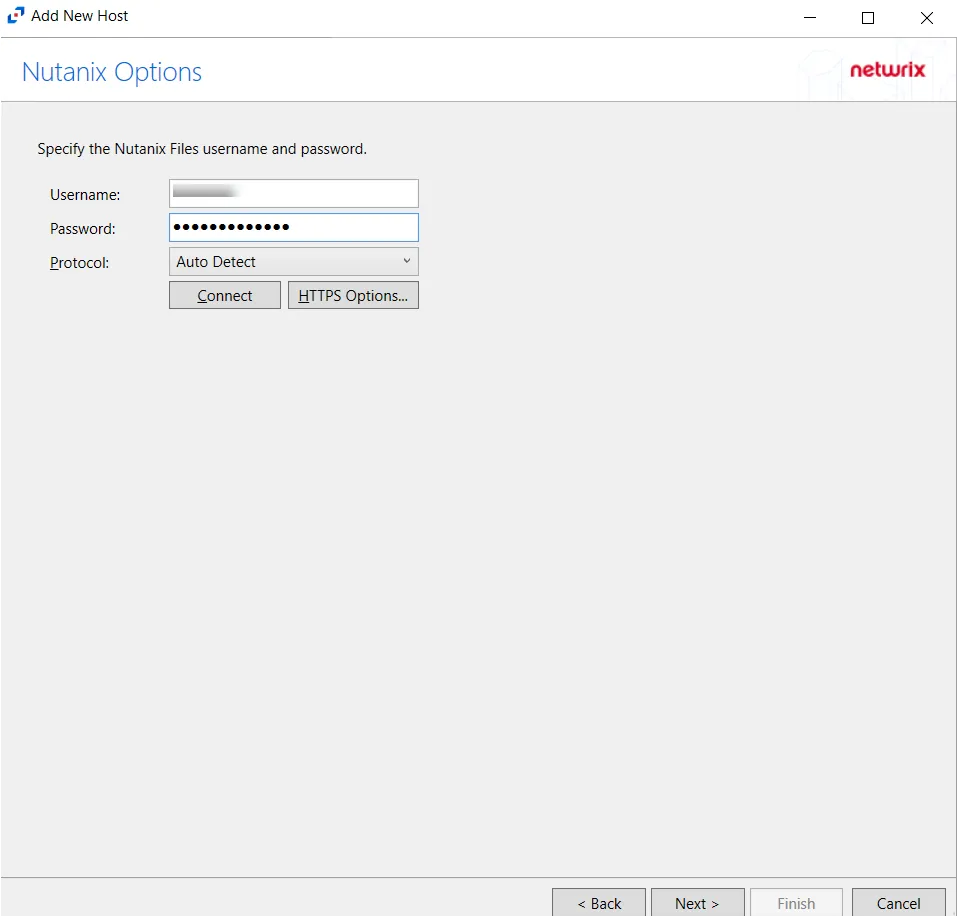
Step 4 – On the Nutanix Options page, enter the user name and password.
NOTE: The credentials used on the Nutanix Options page are for the Nutanix user having REST API access.
- Protocol – Select from the following options in the drop-down list:
- Auto Detect
- HTTPS
- HTTPS, ignore certificate errors
- Connect – Click Connect to connect to the Nutanix device using the selected protocol and validate the connection.
Click Next.
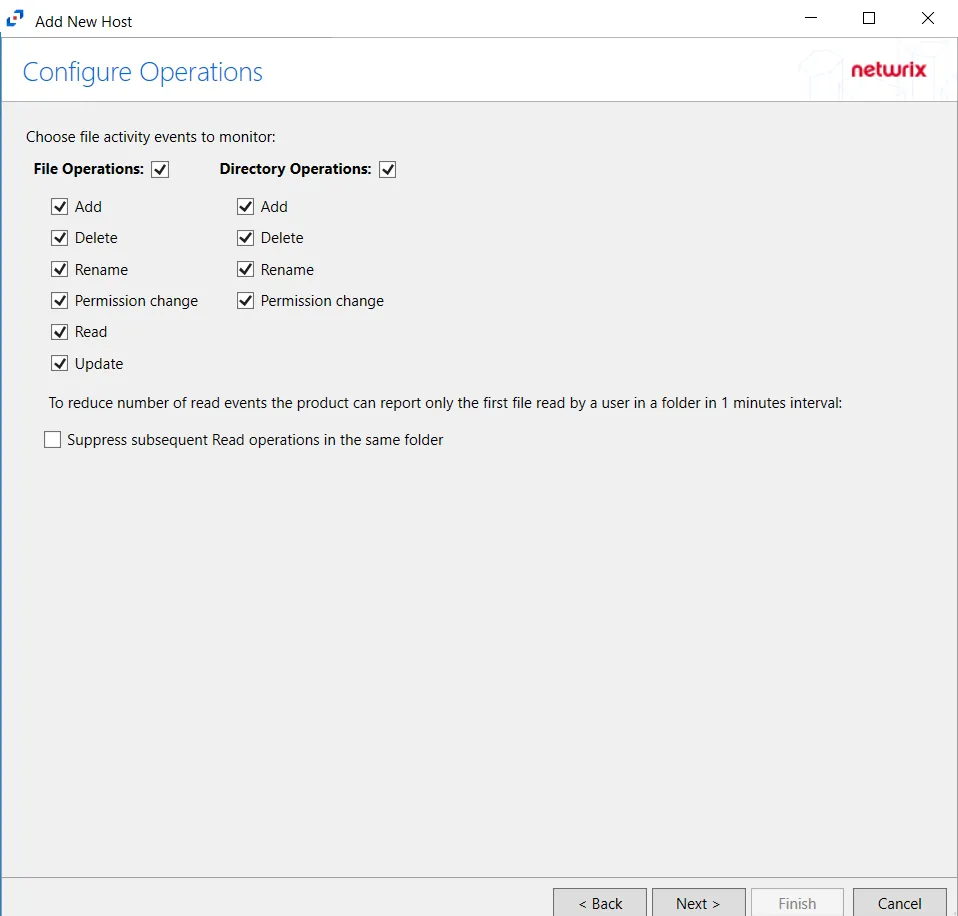
Step 5 – On the Configure Operations page, select the File Operations and Directory Operations to be monitored.
Click Next.
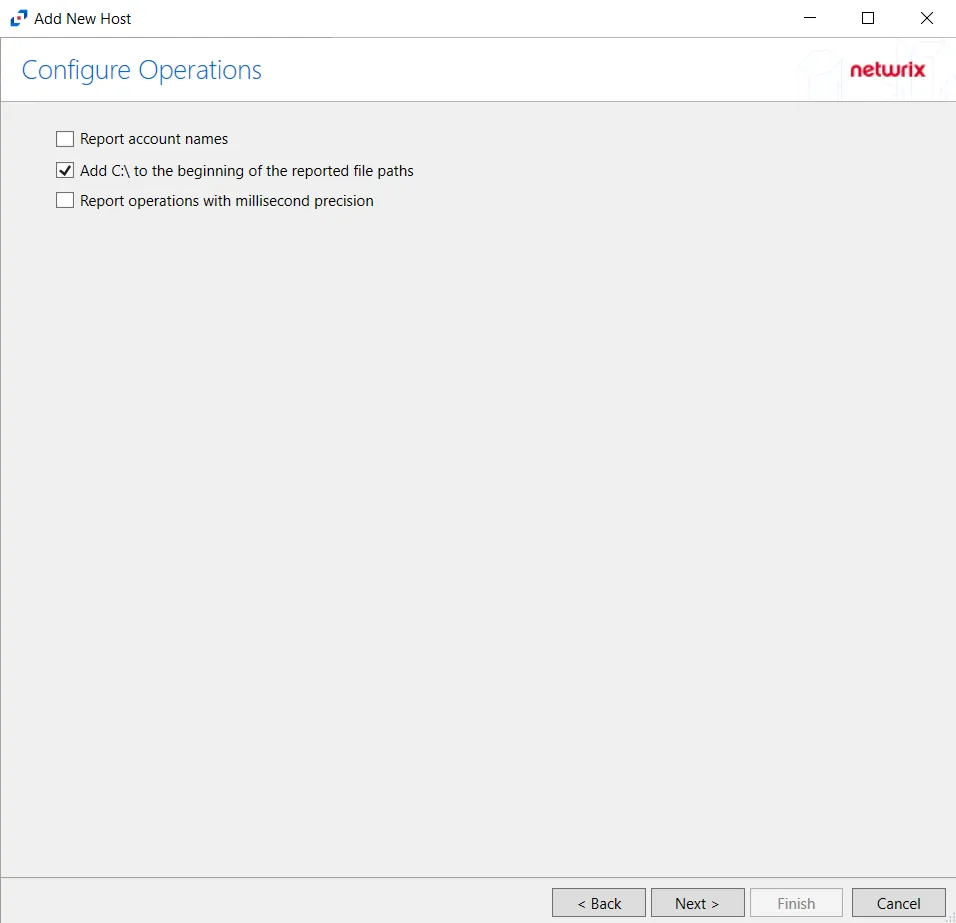
Step 6 – On the Configure Basic Operations page, choose which settings to enable. The “Log files” are the activity logs created by the activity agent on the agent's server. Select one of the following options:
- Report account names: Adds an Account Name column in the generated TSV files.
- Add C:\ to the beginning of the reported file paths: Adds ‘C:\” to file paths to be displayed like
a Windows file path:
- Display example if checked: C:\Folder\file.txt
- Display example if unchecked: /Folder/file.text
- Report operations with millisecond precision - Changes the timestamps of events being recorded in
the TSV log file for better ordering of events if multiple events occur within the same second.
- Access Analyzer 8.1+ is required to use this feature.
Click Next.
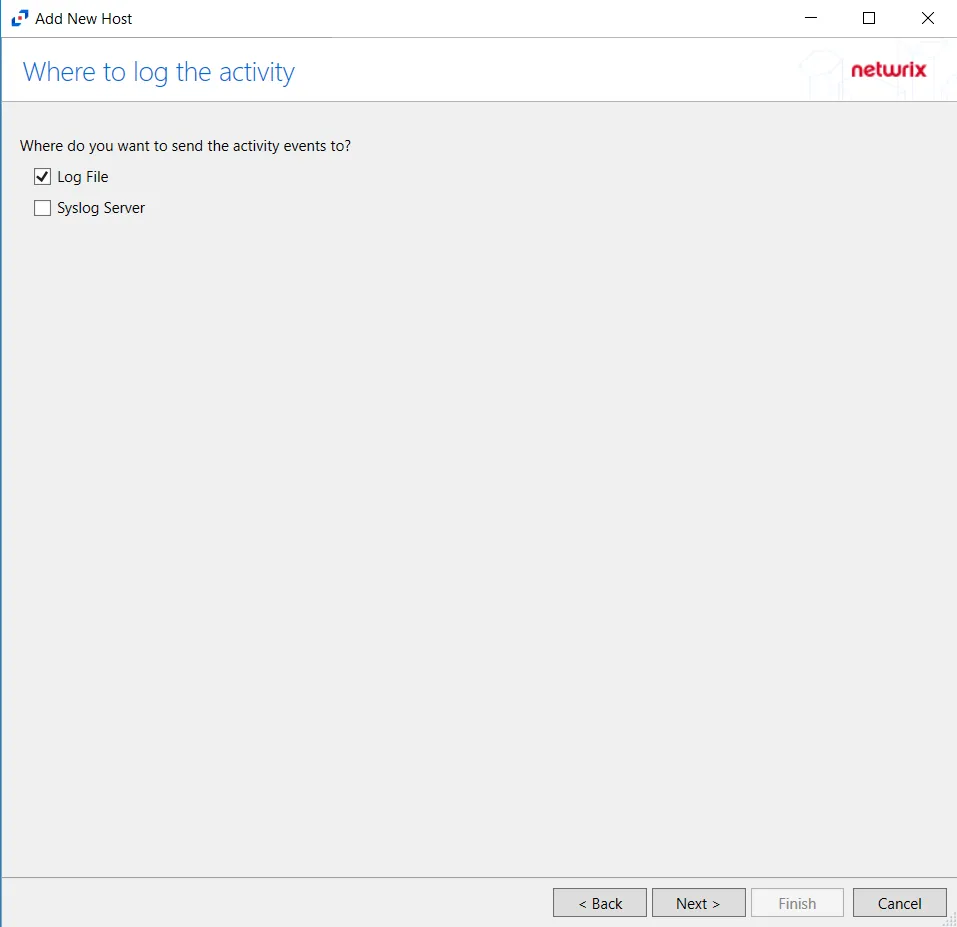
Step 7 – On the Where To Log The Activity page, select whether to send the activity to either a Log File or Syslog Server. Click Next.
NOTE: An option must be selected before moving to the next step.
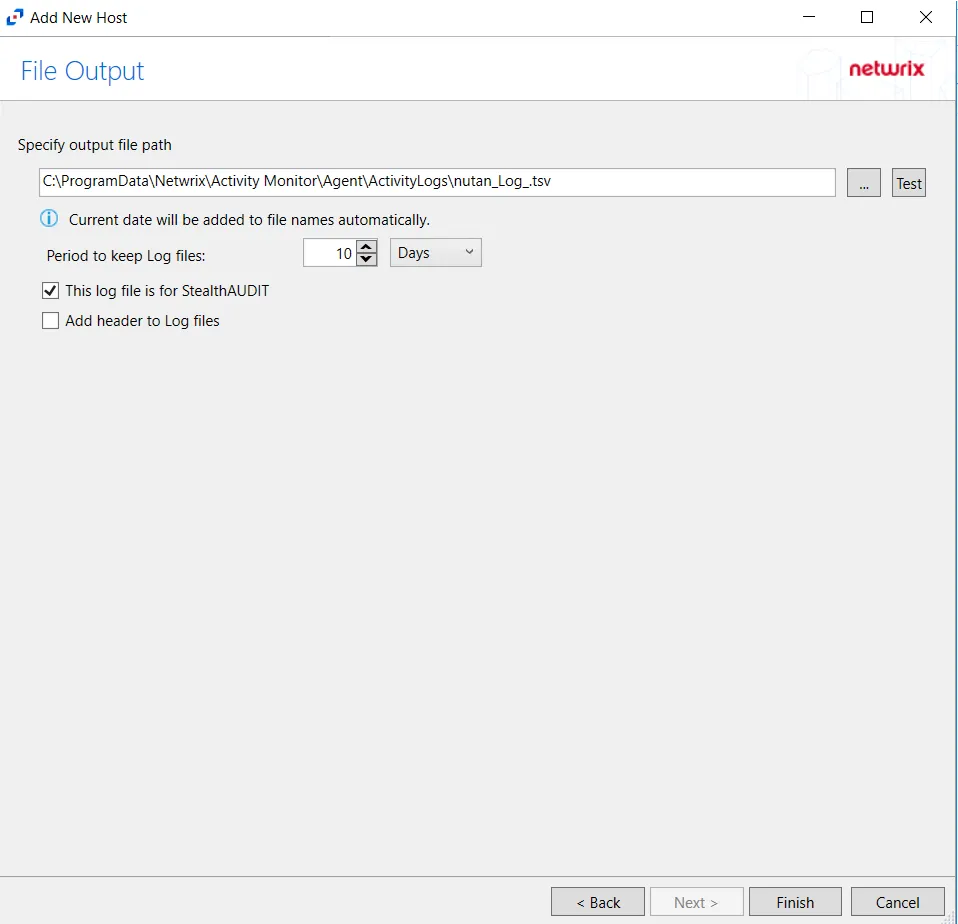
Step 8 – If Log File is selected on the Where To Log The Activity page, configure the File Output page.
-
Specify output file path – Specify the file path where TSV log files are saved on the agent's server. Click the ellipses button (...) to open the Windows Explorer to navigate to a folder destination. Click Test to test if the path works.
-
Period to keep Log files –Log files will be deleted after the period entered as the number of days elapses. The default is 10 days. Use the dropdown to specify whether to keep the Log files for a set amount of Minutes, Hours, or Days. This setting applies to both the local files on the agent's server and to the archived files.
-
This log file is for Access Analyzer – Enable this option to have Access Analyzer collect this monitored host configuration
RECOMMENDED: Identify the configuration to be read by Access Analyzer when integration is available.
NOTE: While Activity Monitor can have multiple configurations for log file outputs per host, Access Analyzer can only read one of them.
-
Add header to Log files – Adds headers to TSV files. This is used to feed data into Splunk.
NOTE: Access Analyzer does not support log files with the header.
Click Next.
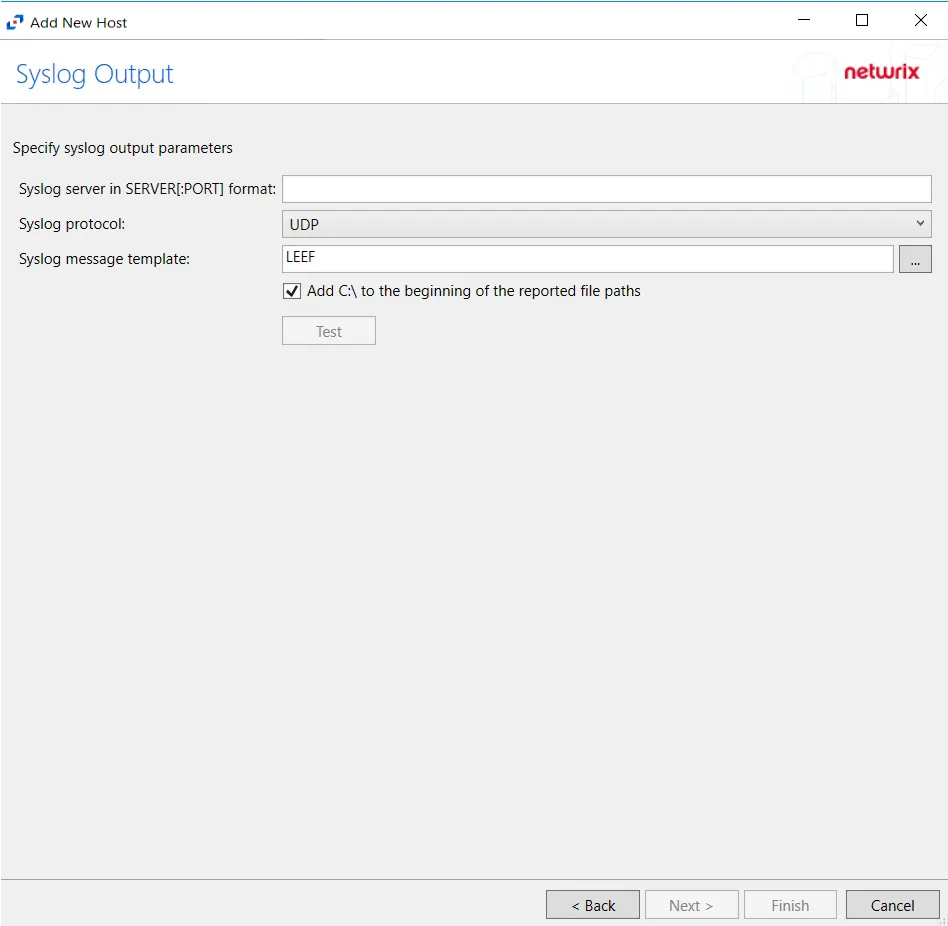
Step 9 – If Syslog Server is selected on the Where To Log The Activity page, configure the Syslog Output page.
-
Syslog server in SERVER[:PORT] format – Type the Syslog server name with a SERVER:Port format in the textbox.
- The server name can be short name, fully qualified name (FQDN), or IP Address, as long as the organization’s environment can resolve the name format used.
-
Syslog Protocol – Identify the Syslog protocol to be used for the Event stream. The drop-down menu includes:
- UDP
- TCP
- TLS
The TCP and TLS protocols add the Message framing drop-down menu. See the Syslog Tab topic for additional information.
-
The Test button sends a test message to the Syslog server to check the connection. A green check mark or red will determine whether the test message has been sent or failed to send. Messages vary by Syslog protocol:
- UDP – Sends a test message and does not verify connection
- TCP/TLS – Sends test message and verifies connection
- TLS – Shows error if TLS handshake fails
See the Syslog Tab topic for additional information.
Click Finish.
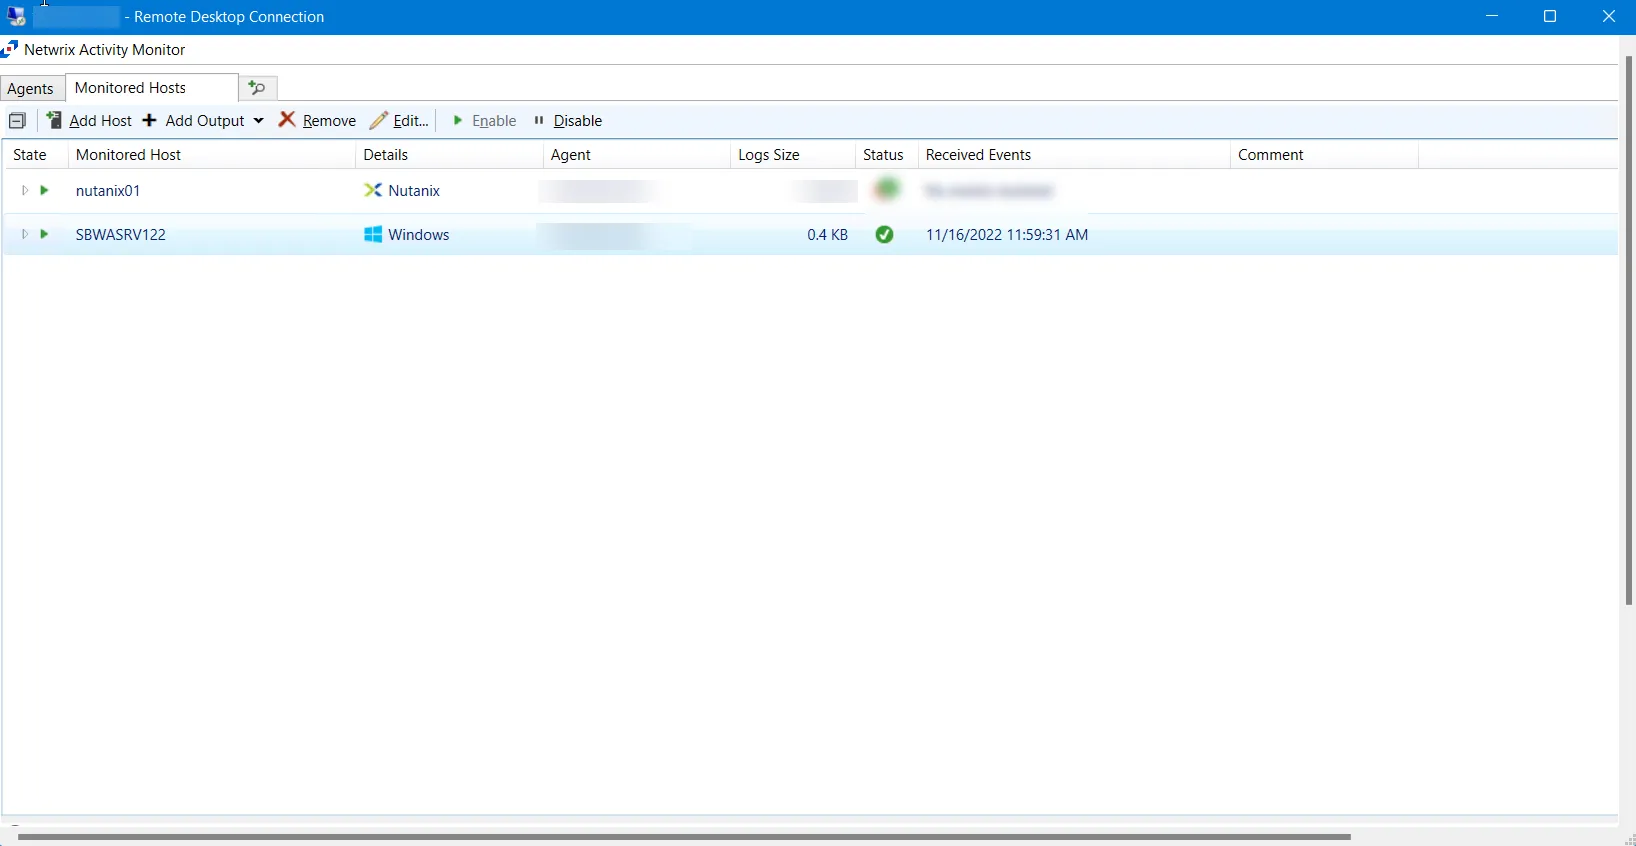
The added Nutanix host is displayed in the monitored hosts table. Once a host has been added for monitoring, configure the desired ouptuts. See the Output for Monitored Hosts topic for additional information.
Host Properties for Nutanix
Configuration settings can be edited through the tabs in the host’s Properties window. The configurable host properties are:
See the Host Properties Window topic for additional information.
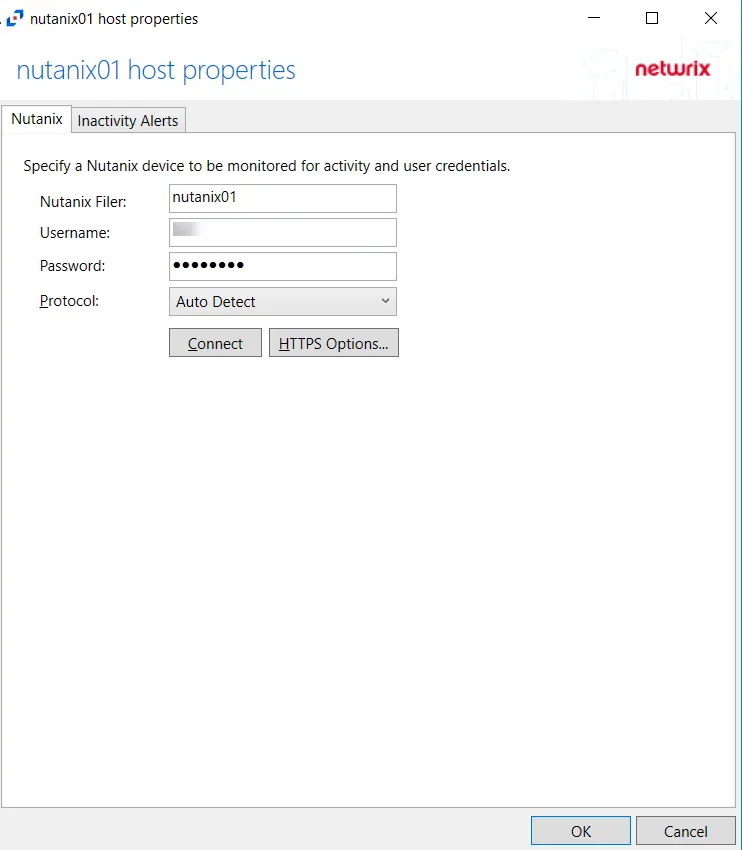
Nutanix Tab
The Nutanix tab allows users to modify settings after a Nutanix host has been configured. Once a Nutanix host is added to the monitored hosts table, the configuration can be edited in the host Properties.
The configurable options are:
-
Nutanix Filer – Enter the name of the filer
-
Username – Enter the user name for the Nutanix account with REST API access
-
Password – Enter the password for the user name
-
Protocol – Select a protocol for the REST API access from the drop-down menu:
- Auto Detect
- HTTPS
- HTTPS, ignore certificate errors
-
Connect – Click to connect using the selected protocol and validate the connection with Nutanix
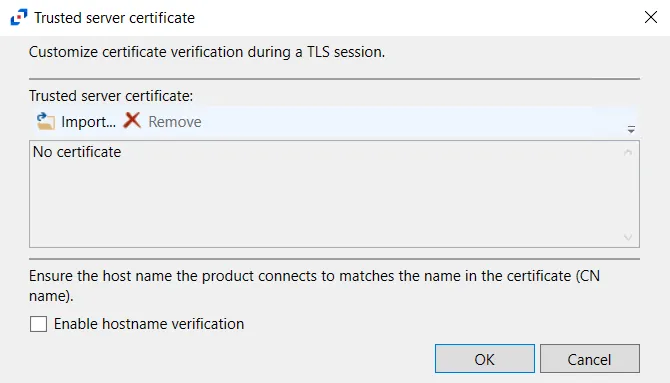 -
HTTPS Options – Opens the Trusted server certificate window to customize the certificate
verification during a TLS session
-
HTTPS Options – Opens the Trusted server certificate window to customize the certificate
verification during a TLS session
- Import – Click to browse for a trusted server certificate
- Remove – Click to remove the selected trusted server certificate
- Enable hostname verification – Select this checkbox to ensure that the host name the product connects and matches the name in the certificate (CN name)
- Click OK to close the window and save the modifications.
NOTE: Nutanix Files does not report events for activity originating from a server where the Activity Monitor Agent is installed.