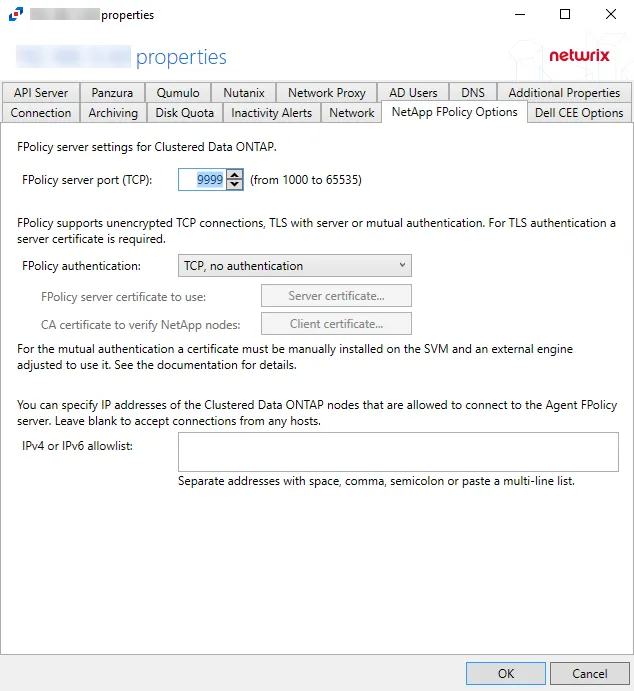
NetApp FPolicy Options Tab
The NetApp FPolicy Options tab provides options to configure FPolicy server settings for monitoring a NetApp Data ONTAP Cluster-Mode device.
The available options are:
-
FPolicy server port (TCP): [number] (from 1000 to 65535) – Enter the FPolicy server port. The default is 9999.
-
FPolicy authentication – Select from the following options in the drop-down list. For TLS server authentication, a Server certificate is required. For TLS, mutual authentication, a Server certificate and Client certificate are required.
- TCP, no authentication – Default setting, with no server authentication required
- TLS, server authentication – Click Server certificate to open the Server certificate window and import a certificate
- TLS, mutual authentication – Click Server certificate to open the Server certificate window and import a certificate, and Client certificate to open the Trusted client or CA certificate window to import a certificate
-
IPv4 or IPv6 whitelist – IP Addresses of the Clustered Data ONTAP nodes, which are allowed to connect to the FPolicy server, can be whitelisted by entering them in the box. IP Addresses should be entered as separate addresses with space, comma, semicolon, or a multi-line list. Leave the box blank to accept connections from any hosts.
Click OK to commit the modifications. Click Cancel to discard the modifications. The Agent Properties window closes.
NetApp
Understanding File Activity Monitoring
The Activity Monitor can be configured to monitor the following:
- Ability to collect all or specific file activity for specific values or specific combinations of values
It provides the ability to feed activity data to SIEM products. The following dashboards have been specifically created for Activity Monitor event data:
- For IBM® QRadar®, see the Netwrix File Activity Monitor App for QRadar for additional information.
- For Splunk®, see the File Activity Monitor App for Splunk for additional information.
It also provides the ability to feed activity data to other Netwrix products:
- Netwrix Access Analyzer (formerly Enterprise Auditor)
- Netwrix Threat Prevention
- Netwrix Threat Manager
Prior to adding a NetApp Data ONTAP host to the Activity Monitor, the prerequisites for the target environment must be met. See the NetApp Data ONTAP Cluster-Mode Activity Auditing Configuration topic or the NetApp Data ONTAP 7-Mode Activity Auditing Configuration topic in the for additional information.
Remember, the Activity Agent must be deployed to a Windows server that acts as a proxy for monitoring the target environment.
Add NetApp Host
Follow the steps to add a NetApp Data ONTAP host to be monitored.
Step 1 – In Activity Monitor, go to the Monitored Hosts tab and click Add. The Add New Host window opens.
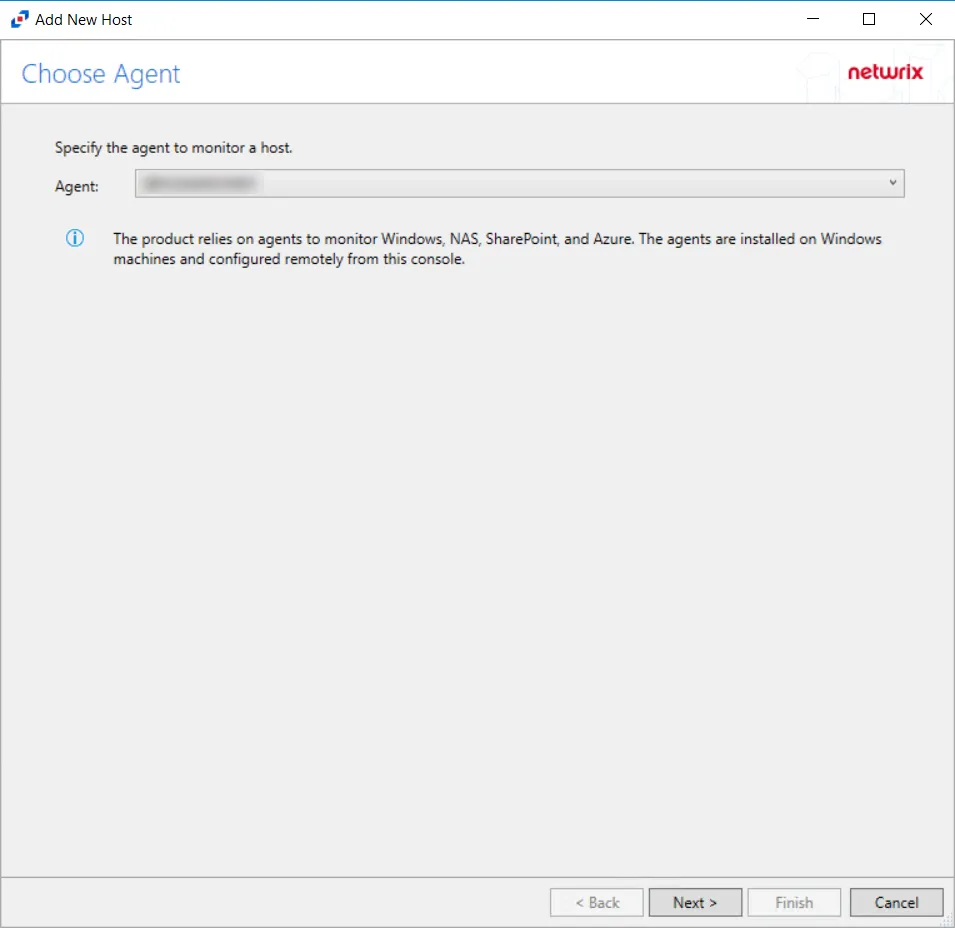
Step 2 – On the Choose Agent page, select the Agent to monitor the storage device. Click Next.
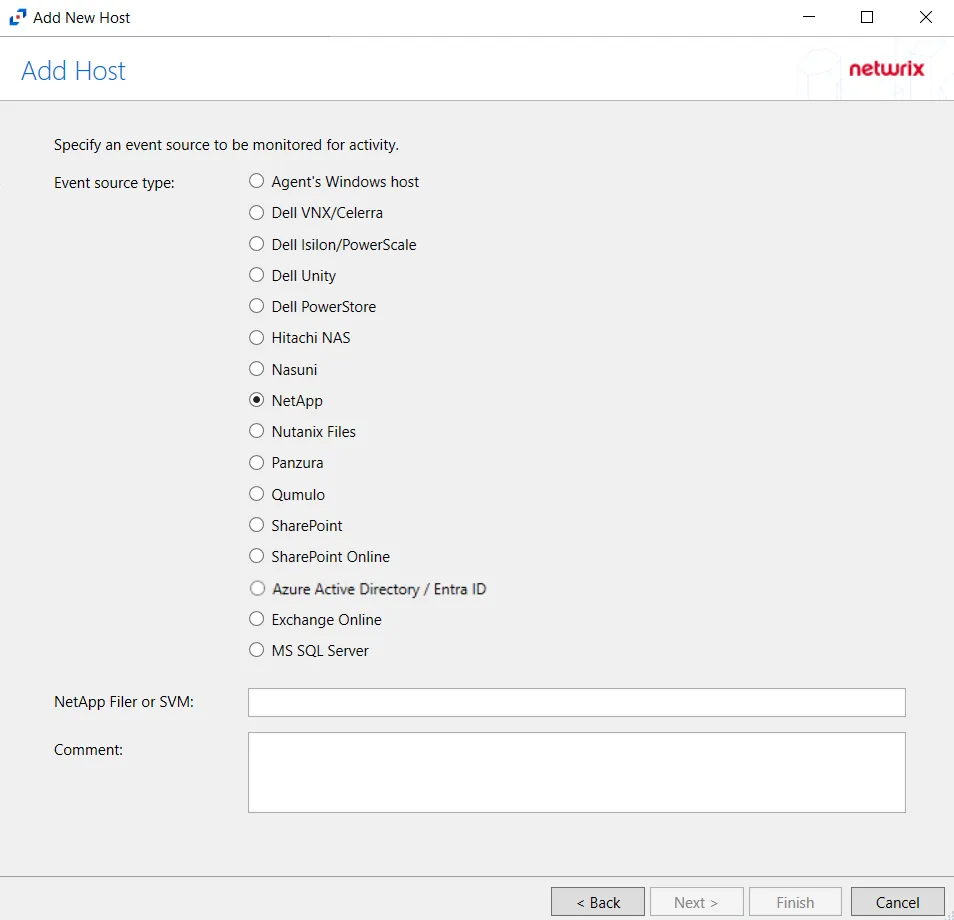
Step 3 – On the Add Host page, select the NetApp radio button. Then, in the NetApp Filer/SVM textbox, enter the following information:
- Cluster-Mode devices – Enter the NetApp Filer/SVM
- 7-Mode devices – Enter the NetApp DNS name. If using vFilers, then it is necessary to use the vFiler name here.
Click Next.
CAUTION: Cluster-Mode is case sensitive. The case of the Filer or SVM name must match exactly to how it is in NetApp's FPolicy configuration.
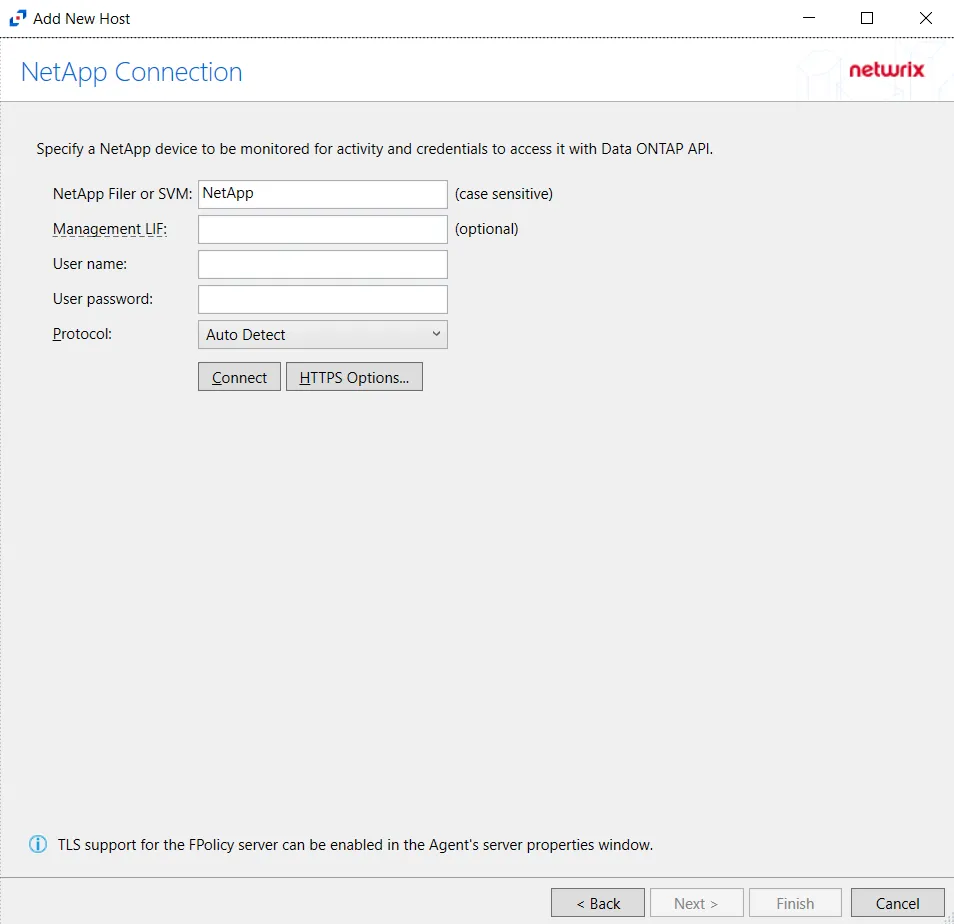
Step 4 – On the NetApp Connection page, enter the following:
- NetApp Filer or SVM – Enter the name of the NetApp Filer or SVM. The name is case sensitive.
- Management LIF – (Optional) If using Cluster Management LIF, a Management LIF can be specified if SVM Management LIF is not used (Vserver Tunneling)
- User name – Enter the user name for the credentials to connect to the NetApp server
- User password – Enter the password for the credentials to connect to the NetApp server
- Protocol – Select from the following options in the drop-down list:
- Auto Detect
- HTTPS
- HTTPS, ignore certificate errors
- HTTP
- Connect – Click to connect using the selected protocol and validate the connection with NetApp
Click Next.
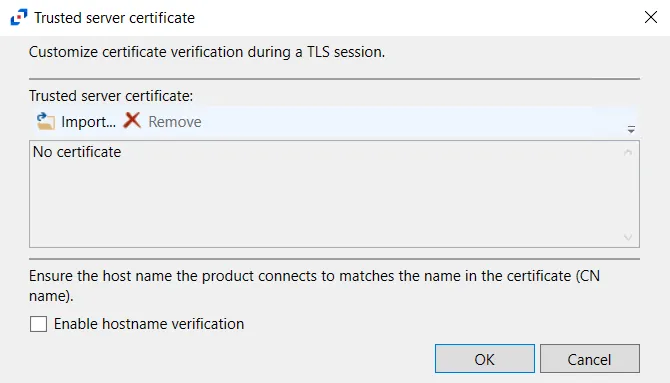
- HTTPS Options – Opens the Trusted server certificate window to customize the certificate
verification during a TLS session
- Import – Click to browse for a trusted server certificate
- Remove – Click to remove selected trusted server certificate
- Enable hostname verification – Select this checkbox to ensure that the host name the product connects to matches the name in the certificate (CN name)
- Click OK to close the window and save the modifications.
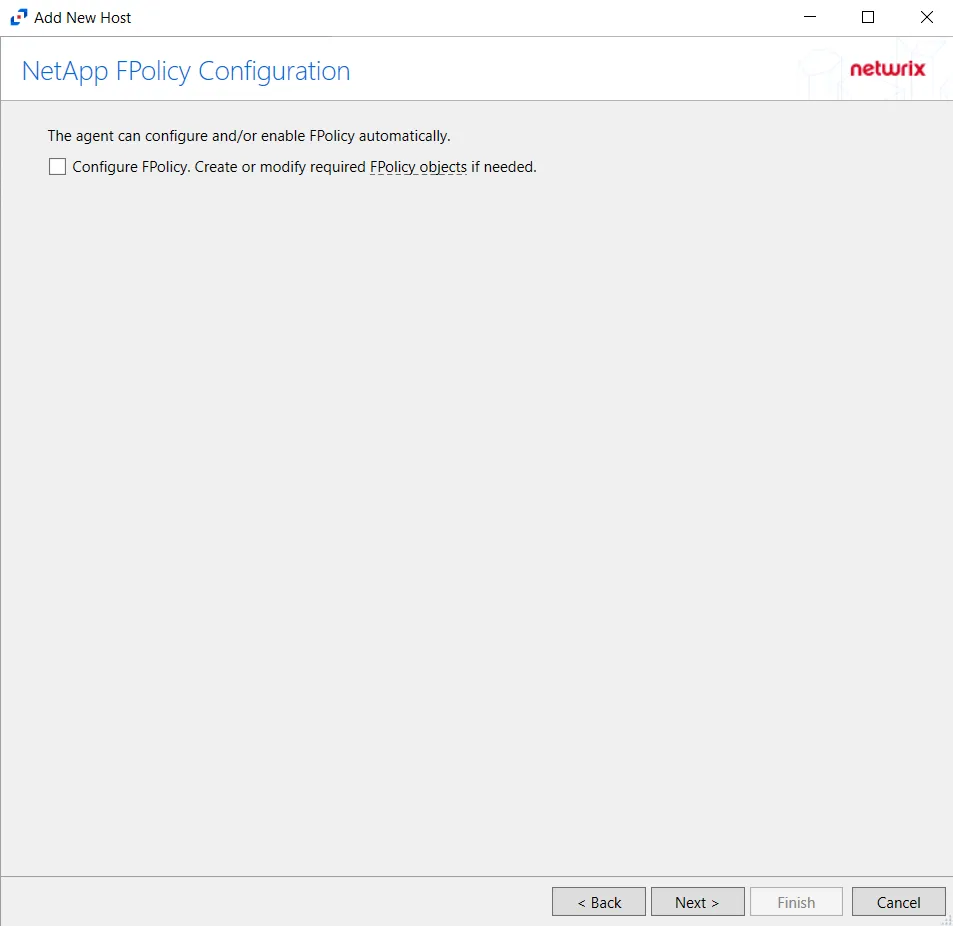
Step 5 – On the NetApp Mode FPolicy Configuration page, choose whether or not to automatically configure FPolicy through Activity Monitor. If that is desired, check the Configure FPolicy option. Any additional permissions required are listed. Be sure to select the appropriate file protocol to configure the FPolicy.
CAUTION: NetApp FPolicy Enable and Connect requires the provisioned user account to have full permissions. For Cluster-mode devices, the credentials are identified as ‘Employing the “Configure FPolicy” Option’.
Additional permissions that are required if enabling Configure FPolicy are:
- Command
vserver fpolicy- Access level:All - Command
security certificate install- Access levelAll(Need for FPolicy TLS only)
Click Next.
Important Notes
RECOMMENDED: For NetApp Cluster-Mode, create a tailored FPolicy manually. If manually configuring the FPolicy, do not select the ConfigureFPolicy checkbox.
If automatic configuration is selected, proceed to the Configure Privileged Access section after successfully adding the host.
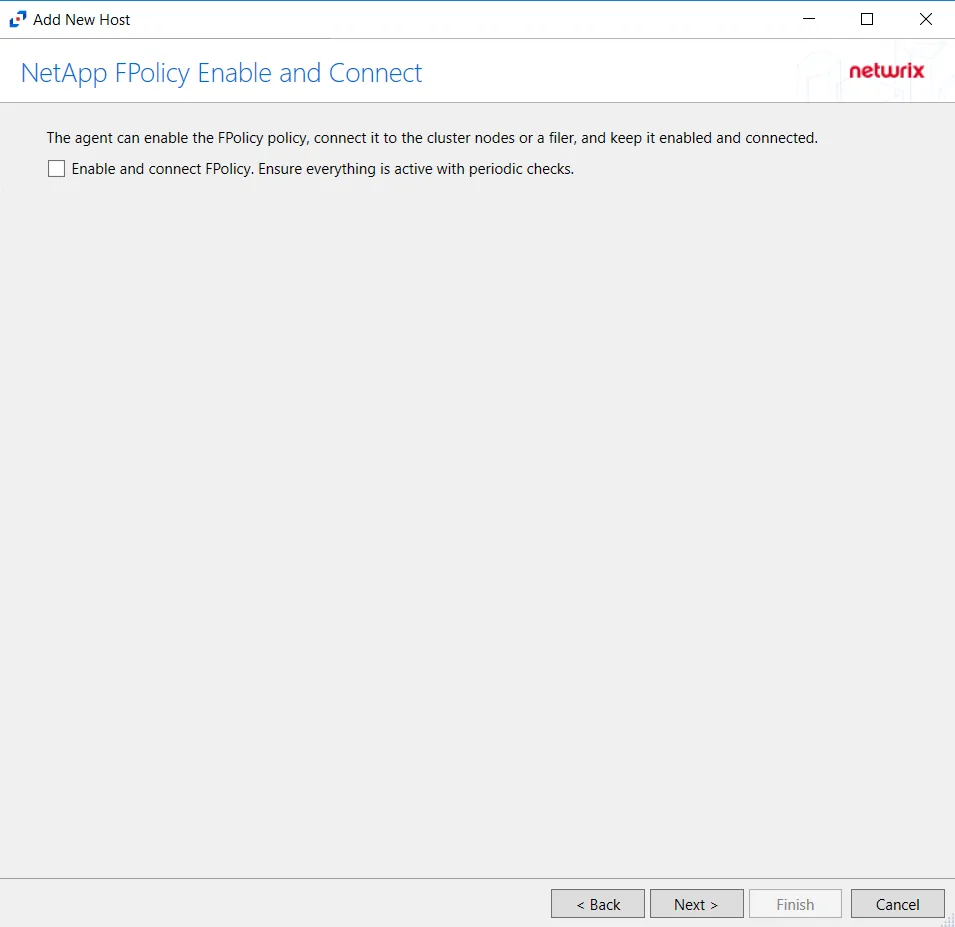
The options on the Configure Operations page require the provisioned user account to have, at a minimum, the less privileged permissions. For Cluster-mode devices, the credentials are identified as ‘Employing the “Enable and connect FPolicy” Option’.
CAUTION: On the NetApp FPolicy Enable and Connect page, choose whether or not to Enable and connect FPolicy, which will “Ensure everything is active with periodic checks.”
Additional permissions that are required if enabling Enable and connect FPolicy are:
- Command
vserver fpolicy disable- Access levelAll - Command
vserver fpolicy enable- Access levelAll - Command
vserver fpolicy engine-connect- Access levelAll - Command
network interface- Access levelreadonly
Important Notes
RECOMMENDED: Enable this functionality. Without this option enabled, it is necessary to manually connect the FPolicy every time it is disconnected for any reason. For reliable, high availability file monitoring, use this option.
Click Next.

Step 6 – On the Protocols page, select which protocols to monitor. The protocols that can be monitored are:
- All
- CIFS
- NFS
Click Next.
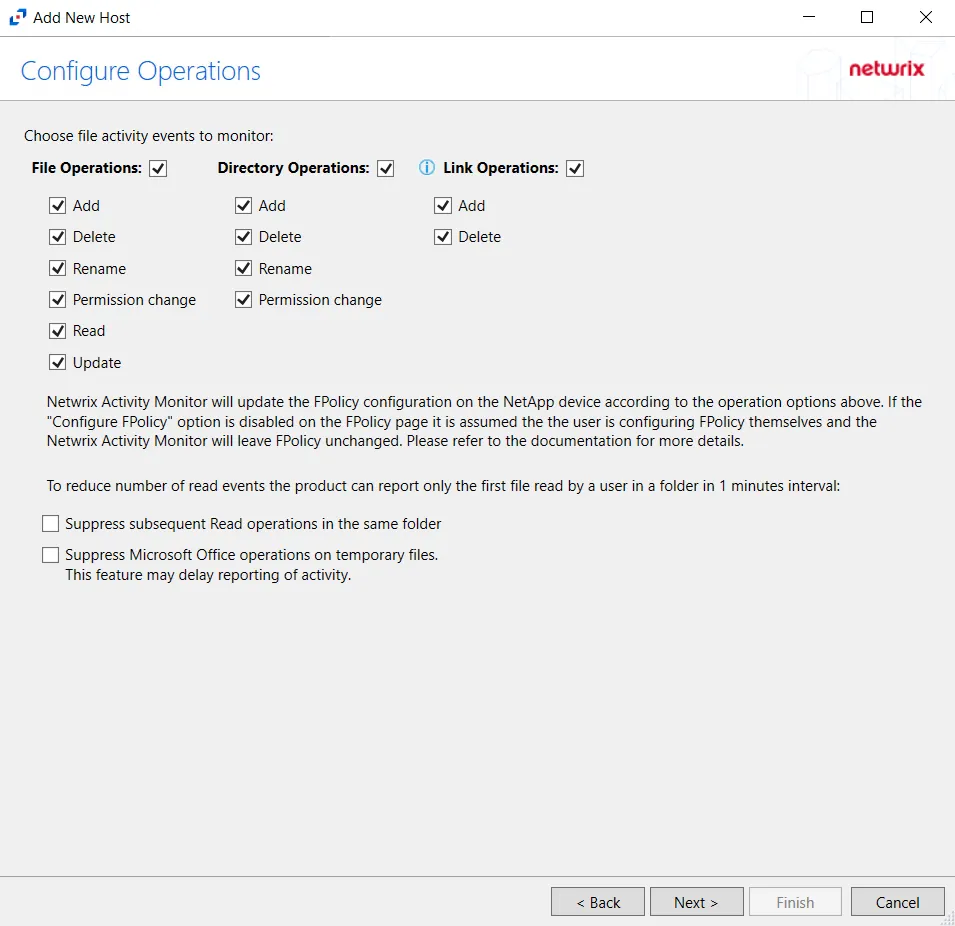
Step 7 – On the Configure Operations page, select the File Operations and Directory Operations to be monitored.
NOTE: NetApp Data ONTAP Cluster-Mode Device folders are now readable by checking the Read / List option listed under Directory Operations. This option is also accessible within the NetApp server’s properties > Operations tab.
If the Configure FPolicy option is enabled, then Activity Monitor updates the FPolicy according to these settings. If it was not enabled, then the manually configured FPolicy must be set to monitor these operations. Only operations being monitored by the FPolicy are available to the activity agent.
Additional options include:
CAUTION: Enabling the Suppress subsequent Read operations in the same folder option can result in Read events not being monitored.
- Suppress subsequent Read operations in the same folder – Logs only one Read operation when subsequent Read operations occur in the same folder. This option is provided to improve overall performance and reduce output log volume.
- Suppress Microsoft Office operations on temporary files – Filters out events for Microsoft Office temporary files. When Microsoft Office files are saved or edited, many temporary files are created. With this option enabled, events for these temporary files are ignored.
Click Next.
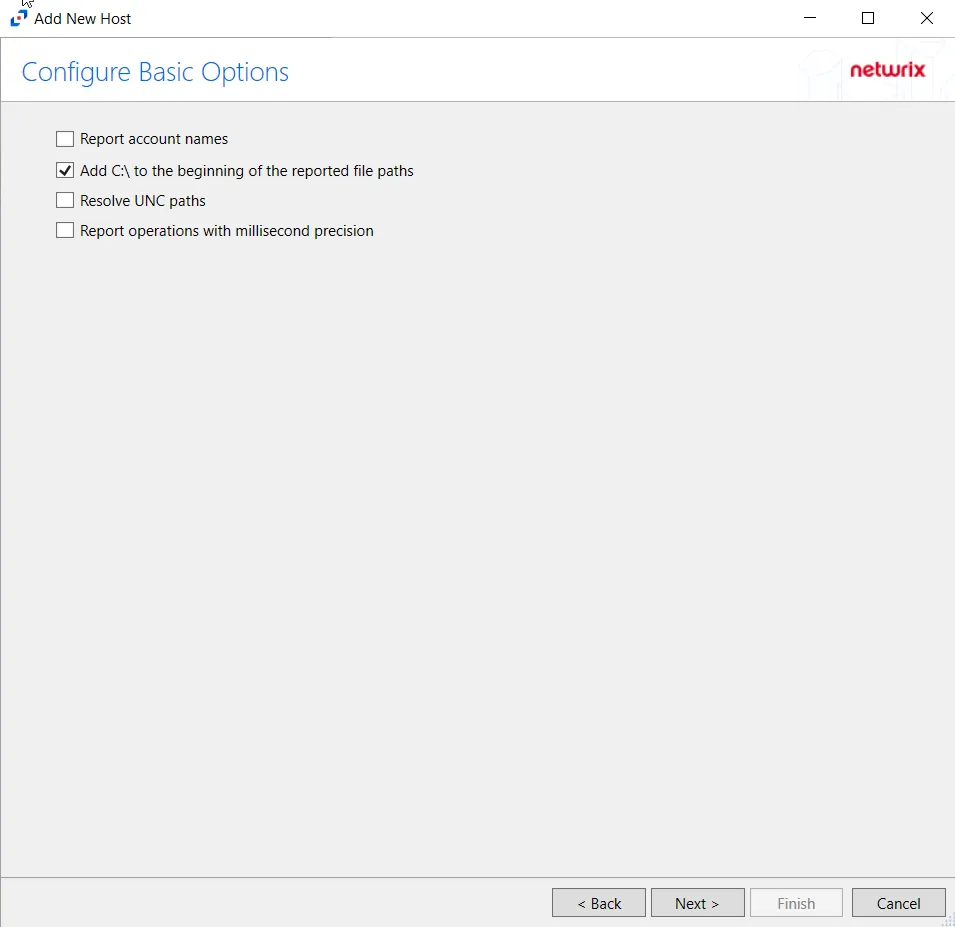
Step 8 – On the Configure Basic Options page, choose which settings to enable. The “Log files” are the activity logs created by the activity agent on the proxy host. Select the desired options:
- Report account names – Adds an Account Name column in the generated TSV files
- Add C:\ to the beginning of the reported file paths – Adds ‘C:\” to file paths to be displayed
like a Windows file path:
- Display example if checked – C:\Folder\file.txt
- Display example if unchecked – /Folder/file.text
- Report UNC paths – Adds a UNC Path column and a Rename UNC Path column in the generated TSV files
- This option corresponds to the REPORT_UNC_PATH parameter in the INI file. It is disabled by
default. The UNC Path is in the following format:
- For CIFS activity –
\\[HOST]\[SHARE]\[PATH] - Example CIFS activity –
\\ExampleHost\TestShare\DocTeam\Temp.txt - For NFS activity –
[HOST]:/[VOLUME]/[PATH] - Example NFS activity –
ExampleHost:/ExampleVolume/DocTeam/Temp.txt
- For CIFS activity –
- When the option is enabled, the added columns are populated when a file is accessed remotely through the UNC Path. If a file is accessed locally, these columns are empty. These columns have also been added as Syslog macros.
- This option corresponds to the REPORT_UNC_PATH parameter in the INI file. It is disabled by
default. The UNC Path is in the following format:
- Report operations with millisecond precision – Changes the timestamps of events being recorded in
the TSV log file for better ordering of events if multiple events occur within the same second
- Access Analyzer 8.1+ is required for this feature
Click Next.
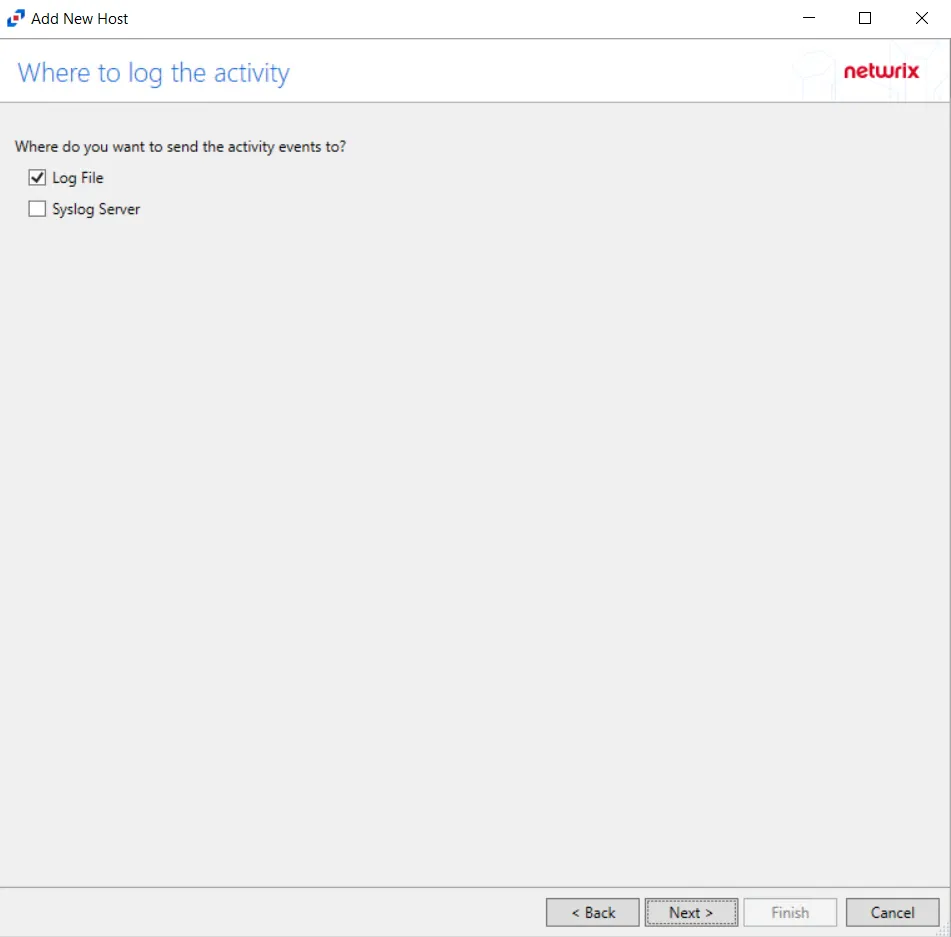
Step 9 – On the Where To Log The Activity page, select whether to send the activity to either a Log File or Syslog Server. Click Next.
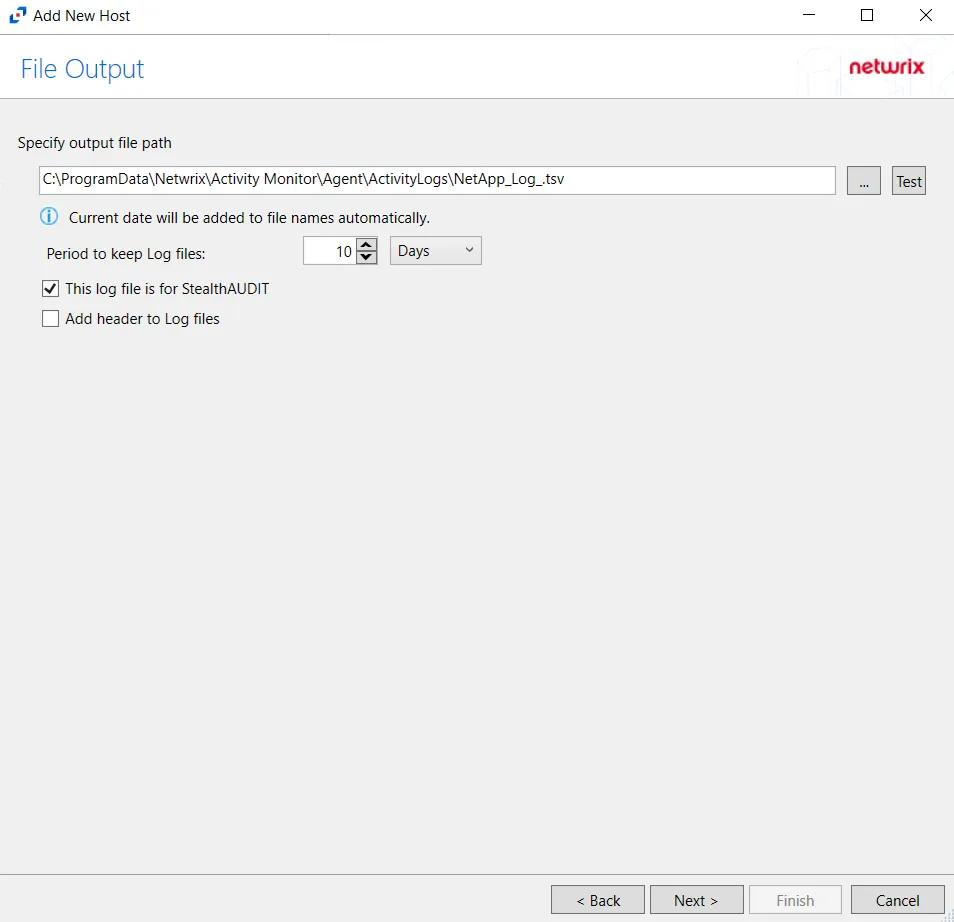
Step 10 – If Log File) is selected on the Where To Log The Activity page, the File Output page can be configured.
-
Specify output file path – Specify the file path where log files are saved. Click the ellipses button (...) to open the Windows Explorer to navigate to a folder destination. Click Test to test if the path works.
-
Period to keep Log files – Log files will be deleted after the period entered number of days entered. The default is 10 days. Use the dropdown to specify whether to keep the Log files for a set amount of Minutes, Hours, or Days.
-
This log file is for Access Analyzer – Enable this option to have Netwrix Access Analyzer (formerly Enterprise Auditor) collect this monitored host configuration
RECOMMENDED: Identify the configuration to be read by Netwrix Access Analyzer (formerly Enterprise Auditor) when integration is available.
- While Activity Monitor can have multiple configurations per host, Netwrix Access Analyzer (formerly Enterprise Auditor) can only read one of them.
-
Add header to Log files – Adds headers to TSV files. This is used to feed data into Splunk.
Click Next.
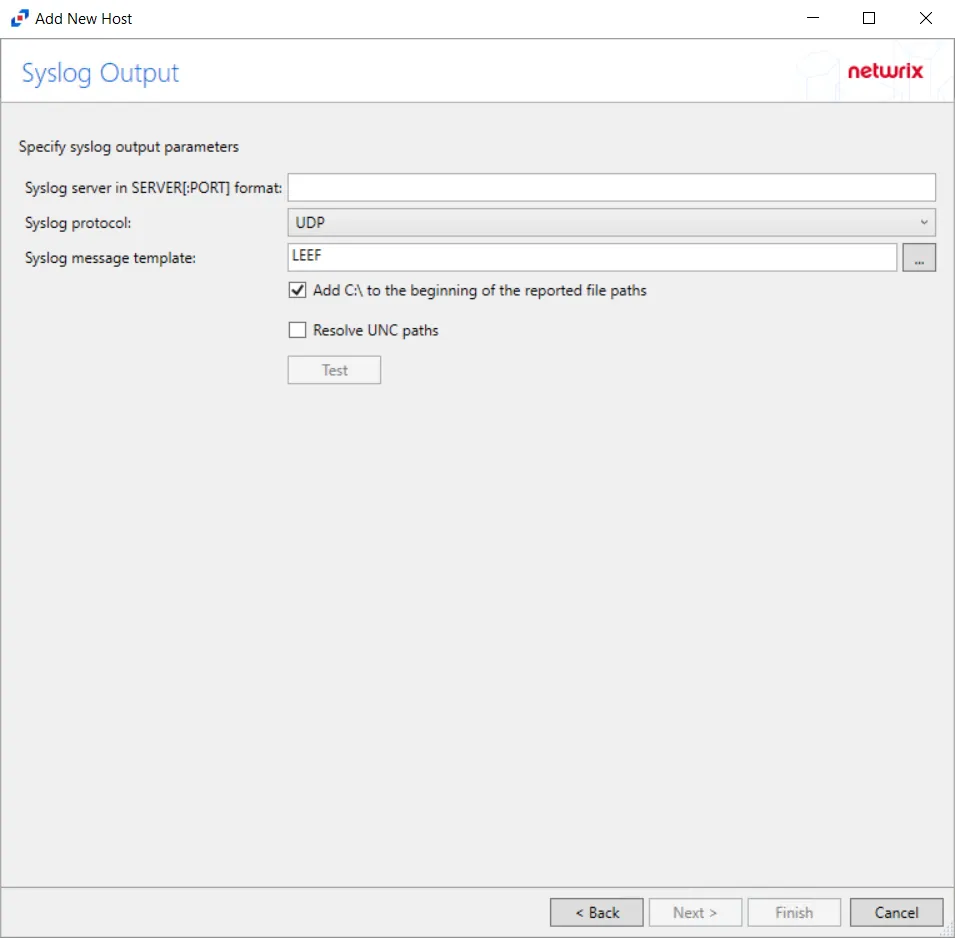
Step 11 – If Syslog Server is selected on the Where To Log The Activity page, the Syslog Output page can be configured.
-
Syslog server in SERVER[:PORT] format – Type the Syslog server name with a SERVER:Port format in the textbox.
- The server name can be short name, fully qualified name (FQDN), or IP Address, as long as the organization’s environment can resolve the name format used. The Event stream is the activity being monitored according to this configuration for the monitored host.
-
Syslog Protocol – Identify the Syslog protocol to be used for the Event stream. The drop-down menu includes:
- UDP
- TCP
- TLS
The TCP and TLS protocols add the Message framing drop-down menu. See the Syslog Tab topic for additional information.
-
The Test button sends a test message to the Syslog server to check the connection. A green check mark or red will determine whether the test message has been sent or failed to send. Messages vary by Syslog protocol:
- UDP – Sends a test message and does not verify connection
- TCP/TLS – Sends test message and verifies connection
- TLS – Shows error if TLS handshake fails
See the Syslog Tab topic for additional information.
Click Finish.
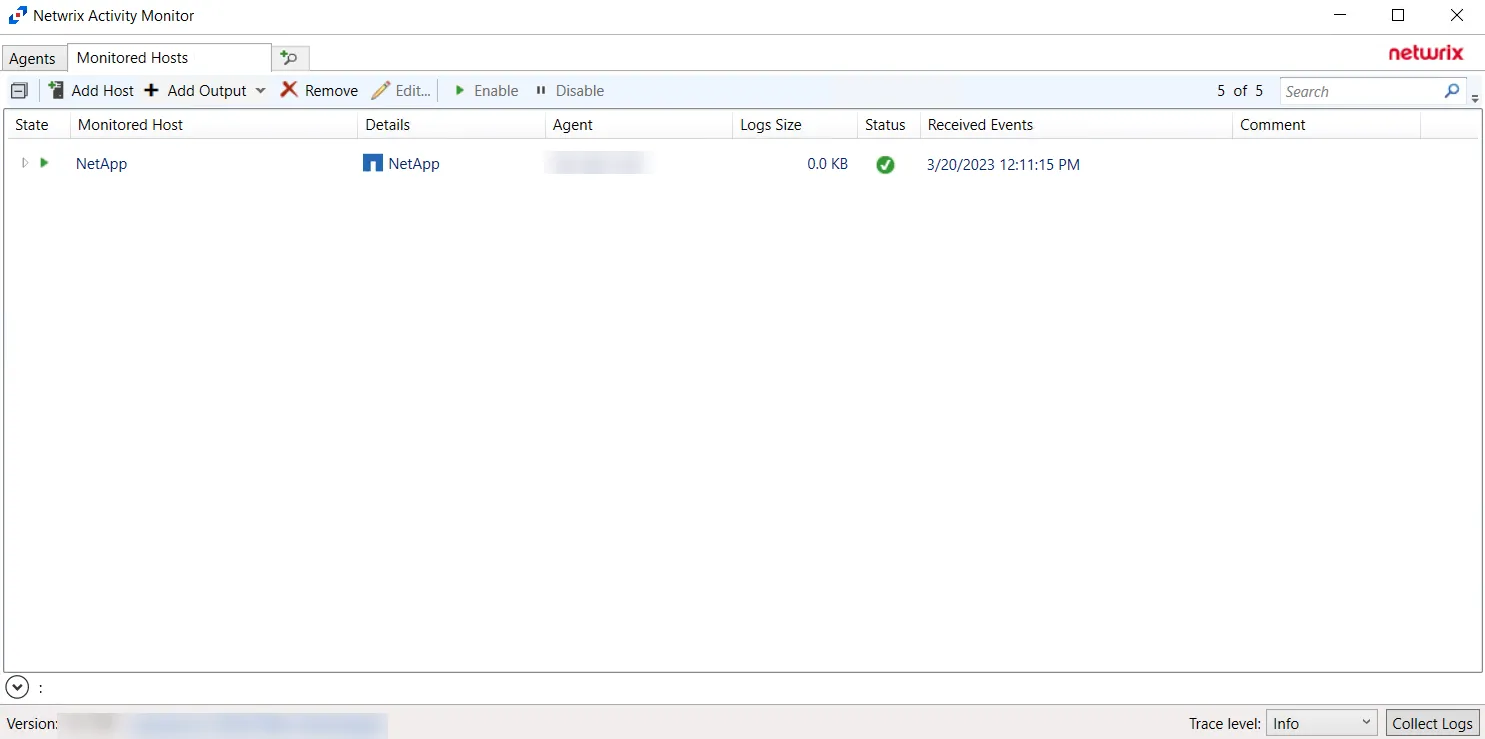
The added NetApp host is displayed in the monitored hosts table. Once a host has been added for monitoring, configure the desired ouptuts. See the Output for Monitored Hosts topic for additional information.
Remember, if automatic configuration of the FPolicy was selected, it is necessary to Configure Privileged Access.
Configure Privileged Access
If automatic configuration of the FPolicy is used for NetApp Data ONTAP Cluster-Mode devices, it is necessary to configure privileged access. Follow the steps to configure privileged access. Remember, this requires the provisioned user account to have full permissions, identified as the credentials ‘Employing the “Configure FPolicy” Option’.
Step 1 – On to the Monitored Hosts tab, select the desired host and click Edit. The host’s Properties window opens.
Step 2 – On the FPolicy tab, select the Privileged Access tab. Select the Allow privileged access checkbox and provide the Privileged user name in the textbox.
NOTE: This option is only available if the Configure FPolicy option is enabled.
Privileged access must be allowed and configured with appropriate credentials to leverage Access Analyzer permission (FSAA) scans for this NetApp device
For information on the other options for this tab, see the FPolicy Tab section.
Host Properties for NetApp
Configuration settings can be edited through the tabs in the host’s Properties window. The configurable host properties are:
See the Host Properties Window topic for additional information.
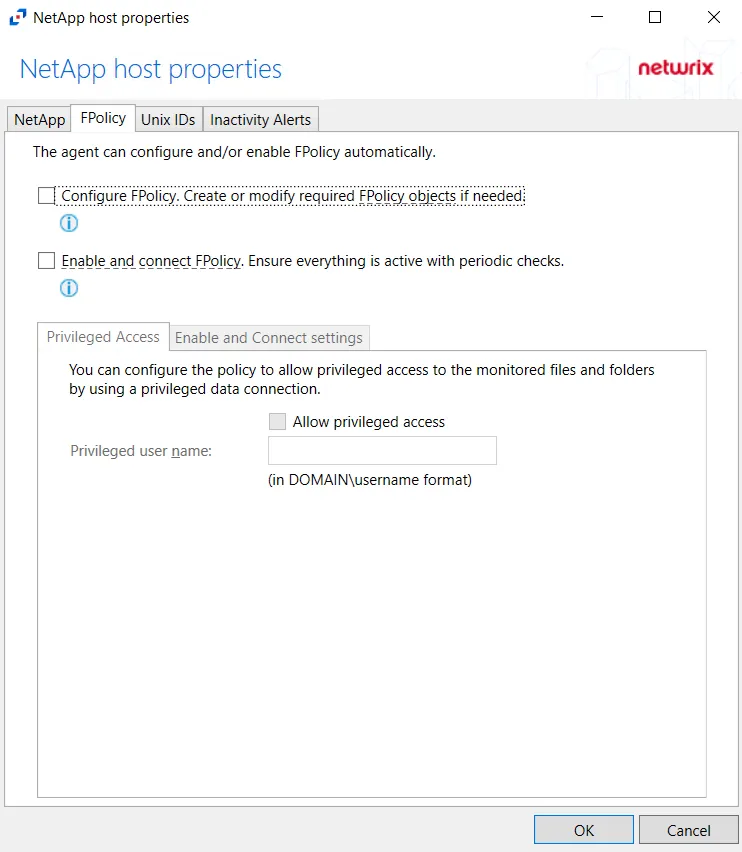
FPolicy Tab
The FPolicy tab allows users to modify FPolicy settings for NetApp devices, privileged access, and enabling/connecting to cluster nodes.
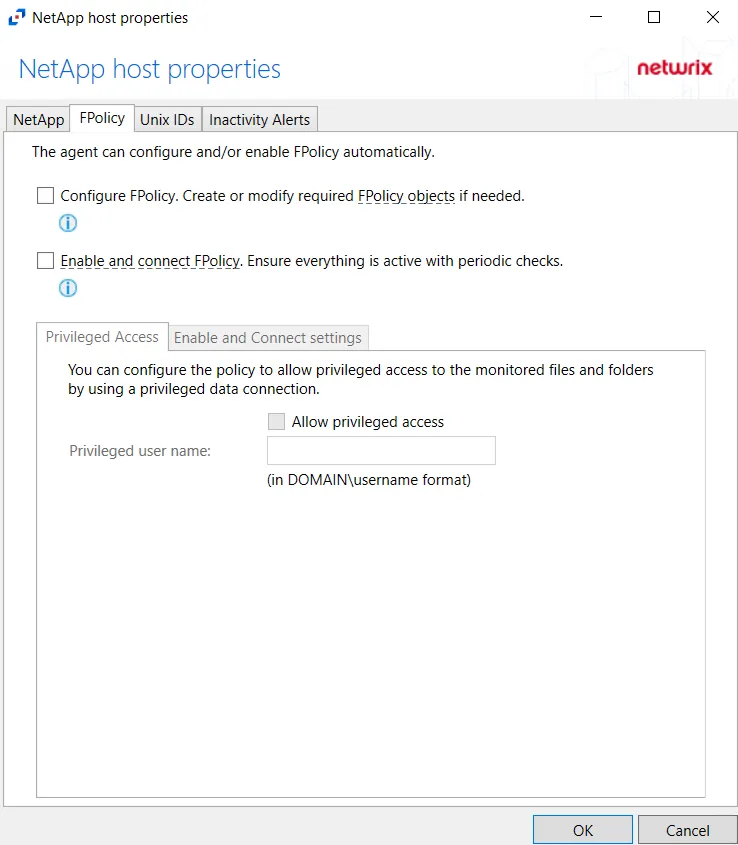
On the FPolicy tab, the agent can configure and/or enable FPolicy automatically. The recommended setting is dependent on the type of NetApp device being targeted. The permissions required for each option are listed. See the NetApp Data ONTAP 7-Mode Activity Auditing Configuration topic or the NetApp Data ONTAP Cluster-Mode Activity Auditing Configuration topic for additional information.
At the bottom are two additional tabs with setting options. On this tab, specify the protocols to monitor by selecting the radio buttons.
Privileged Access Tab
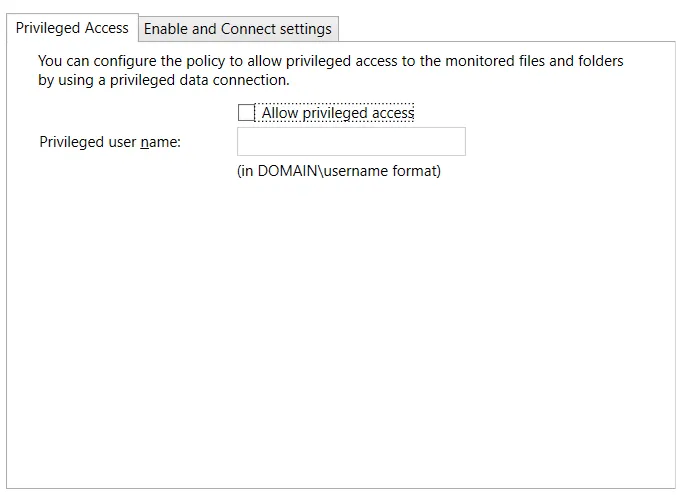
The Privileged Access tab is enabled when the Configure FPolicy checkbox is selected at the top. The Privileged Access tab must be configured if automatic configuration of the FPolicy for NetApp Data ONTAP Cluster-Mode devices is used. See the Configure Privileged Access topic for additional information.
Enable and Connect settings Tab
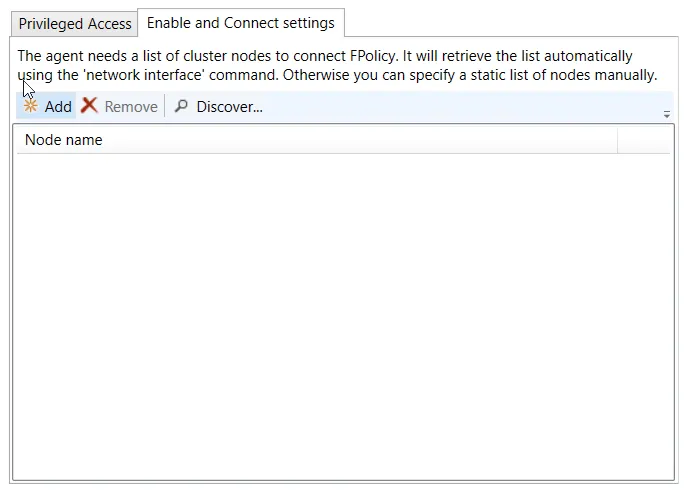
The Enable and Connect settings tab is enabled when the Enable and connect FPolicy checkbox is selected.
NOTE: Adding nodes are not needed if set user is using a role that has Network Interface permissions.

Add a list of cluster nodes to connect to FPolicy by clicking Add, which opens the Add or Edit Cluster Node window. Enter at least one cluster node in the textbox. Separate multiple nodes with either commas (,), semicolons (;), or spaces. Click OK and the node(s) is displayed in the Node name list.
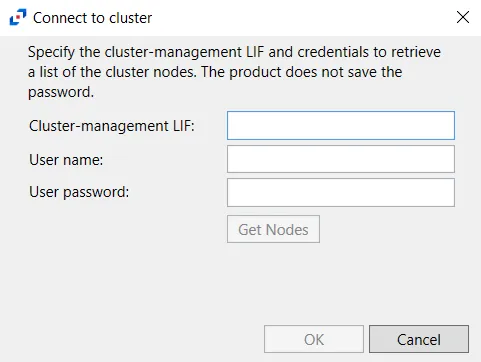
Click Discover to open the Connect to cluster window and retrieve nodes from the cluster.
Specify the Cluster-management LIF and then enter user credentials which will be used to retrieve a list of the cluster nodes. This credential must have at least read-only rights to run the system node show command on the cluster. Click Get Nodes. If a successful connection is not achieved, the message indicates the error. If a successful connection is achieved, the message indicates how many cluster nodes were discovered. Click OK and all discovered nodes are displayed in the Node name list.
Use the Remove button to remove the selected node from the list.
Changing the FPolicy Heartbeat Interval
The activity agent periodically checks for and re-enables any StealthAUDIT filter policies which had been disabled for any reason, i.e. a network outage. Follow the steps to change the frequency of checks.
Step 1 – Using Regedt32 navigate to:
HKEY_LOCAL_MACHINE\SYSTEM\CurrentCotrolSet\Services\FPolicyServerSvc\Parameters
Step 2 – Right-click on TimeInterval and select Modify.
Step 3 – Change “Base” to Decimal.
Step 4 – Set the “Value Data” to an integer value which represents how often, in minutes, the service should poll corresponding NetApp filers.
Step 5 – Restart both the Stealthbits NetApp File Activity Monitoring Service (FPolicyServerSvc) and the Stealthbits Logging Service for Network Appliances (FSACLogging) on the activity agent server.
The activity agent now checks for disabled filter policies according to the modified heartbeat interval.
Resources Required for NetApp Monitoring
Each individual NetApp filer being monitored impacts local system resources and requires disk space. These vary based on configuration settings chosen along with user activity. Average FPolicy and associated Logging service resource consumption may be around 2% CPU usage and 10 MB of RAM. Average disk space required per daily activity log file retained locally may be around 300 MB per filer.
NetApp Tab
The NetApp tab on a host’s Properties window allows users to modify settings, which are populated with the information entered when the NetApp host is added to the monitored hosts table.
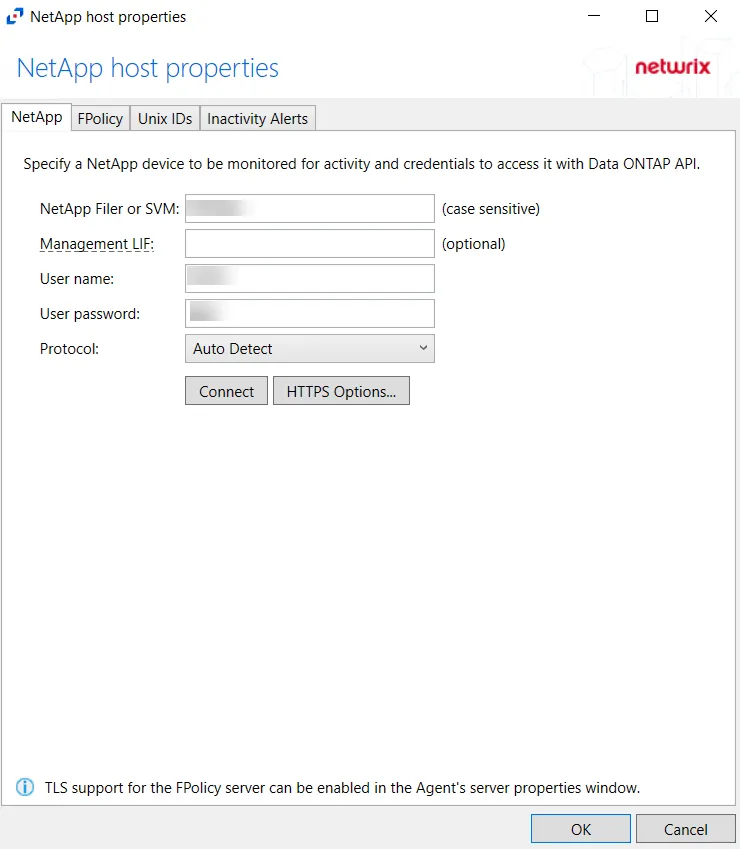
Modify the targeted NetApp device by specifying a NetApp device to be monitored for activity and credentials to access it with the Data ONTAP API.
- Protocol – Select from the following options in the drop-down list:
- Auto Detect
- HTTPS
- HTTPS, ignore certificate errors
- HTTP
- Connect – Click to connect using the selected protocol and validate the connection with NetApp
-
HTTPS Options – Opens the Trusted server certificate window to customize the certificate
verification during a TLS session
- Import – Click to browse for a trusted server certificate
- Remove – Click to remove the selected trusted server certificate
- Enable hostname verification – Select this checkbox to ensure that the host name the product connects and matches the name in the certificate (CN name)
- Click OK to close the window and save the modifications.