SharePoint Online
Understanding SharePoint Activity Monitoring
The Activity Monitor can be configured to monitor the following SharePoint changes:
- Document is checked out
- Document is checked in
- Object is deleted
- Object is updated
- Child object is deleted
- Child object is undeleted
- Child object is moved
- Search operation is performed
- Security group is created
- Security group is deleted
- Security principal is added to a security group
- Security principal is removed from a security group
It also provides the ability to feed activity data to other Netwrix products:
- Netwrix Access Analyzer (formerly Enterprise Auditor)
Prior to adding a SharePoint Online host to the Activity Monitor, the prerequisites for the target environment must be met. See the SharePoint Online Activity Auditing Configuration topic for additional information.
Remember, the Activity Agent must be deployed to a Windows server that acts as a proxy for monitoring the target environment.
Add SharePoint Online Host
Follow the steps to add a SharePoint Online host to be monitored.
Step 1 – In the Activity Monitor, go to the Monitored Hosts tab and click Add. The Add New Host window opens.
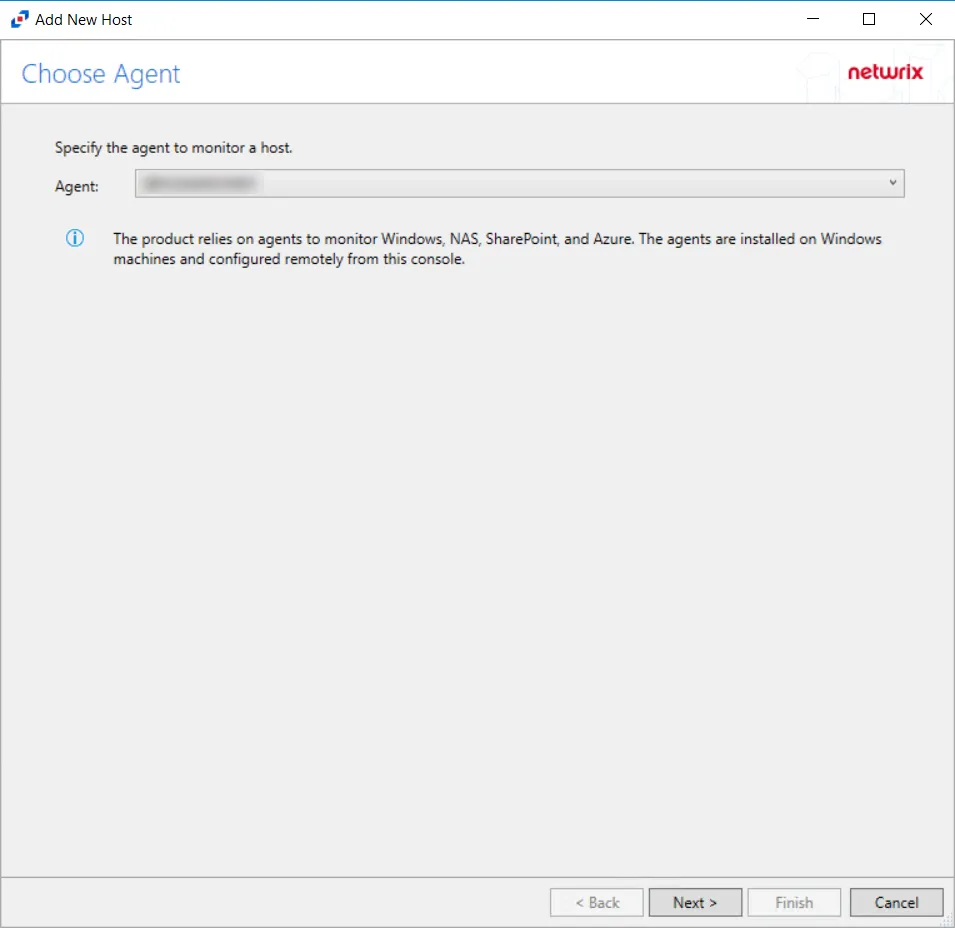
Step 2 – On the Choose Agent page, select the Agent to monitor SharePoint Online.
CAUTION: The domain name must match the SharePoint Online host name in order to properly integrate SharePoint Online activity monitoring with Access Analyzer.
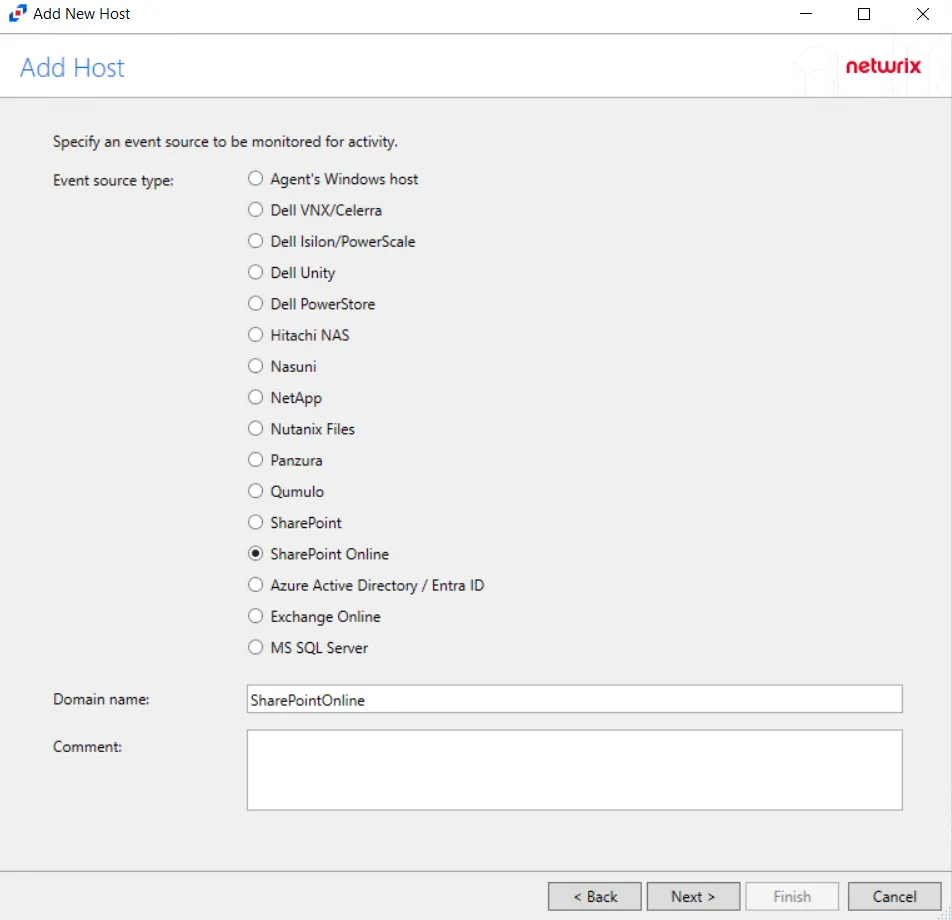
Step 3 – On the Add Host page, select the SharePoint Online radio button and enter the Microsoft Entra ID (formerly Azure AD) domain name. Click Next.
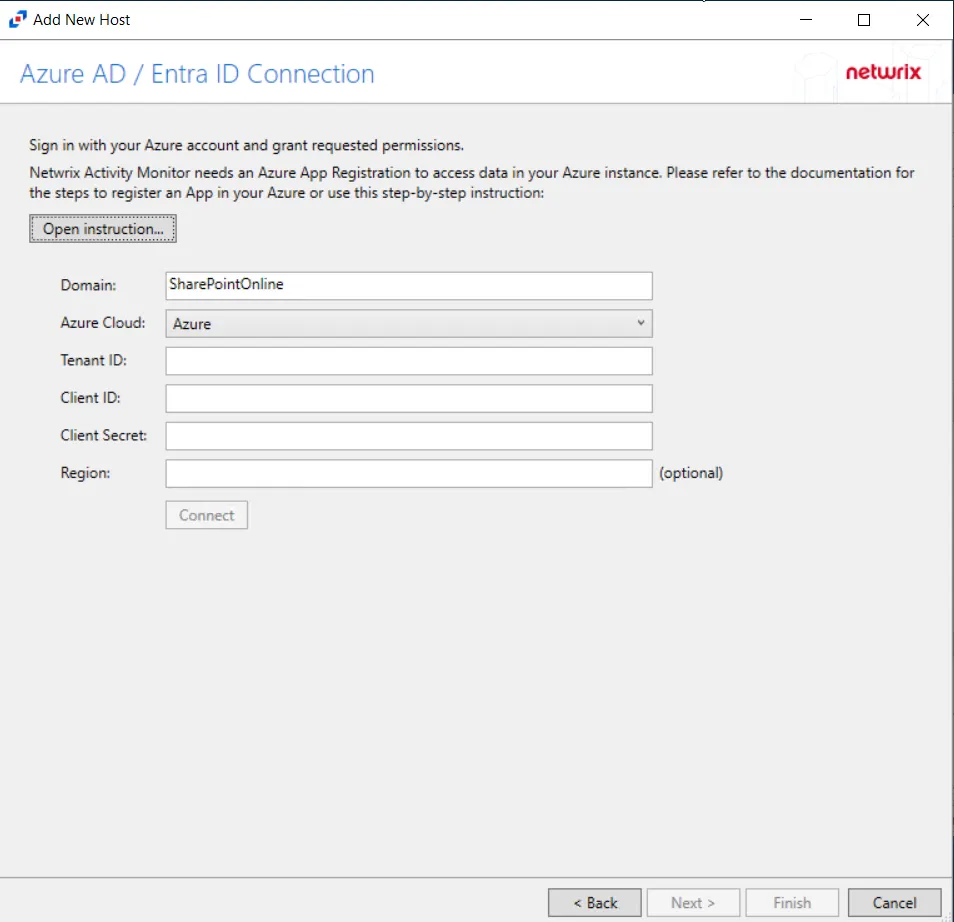
Step 4 – On the Azure AD / Entra ID Connection page, enter a Client ID and Client Secret, then click Sign-In to grant permissions to read the auditing and directory data. Click Open Instruction... for steps on registering the Activity Monitor with Microsoft Entra ID.
-
After clicking Sign-In, the Sign in to your account window opens.
-
Sign-in with a Global Administrator account.
-
Approve consent for the organization.
NOTE: Activity Monitor does not store credentials. The credentials are used to enable API access using the Client ID and Secret.
-
See the SharePoint Online Activity Auditing Configuration topic for additional information.
Click Next.
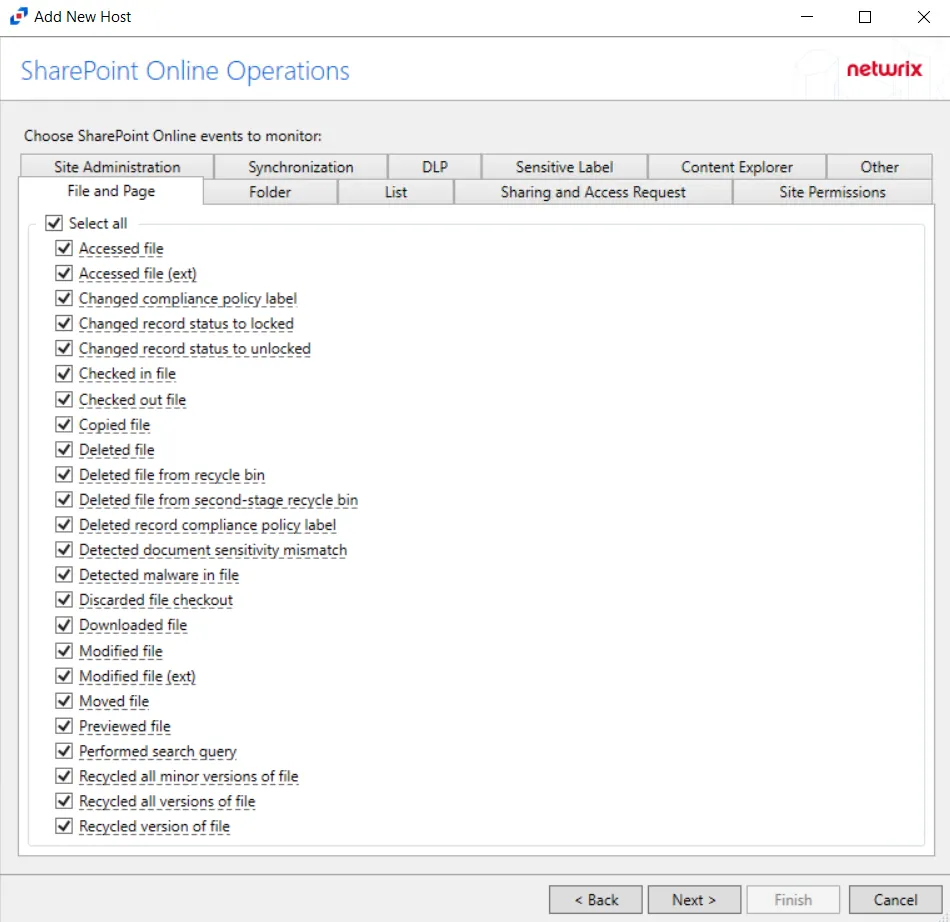
Step 5 – On the SharePoint Online Operations page, configure the options found in the following tabs:
- File and Page
- Folder
- List
- Sharing and Access Request
- Site Permissions
- Site Administration
- Synchronization
- DLP
- Sensitive Label
- Content Explorer
- Other
These options can be configured again in a SharePoint Online host's properties window. See the Operations Tab for additional information. Click Next.
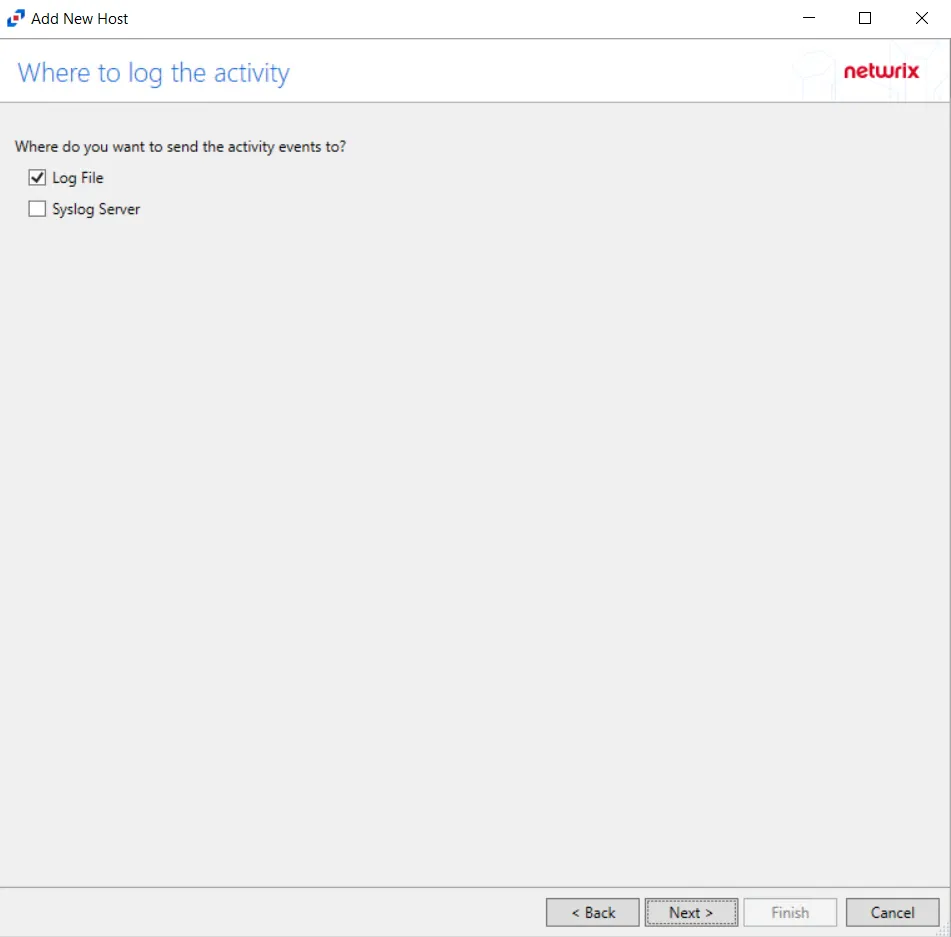
Step 6 – On the Where To Log The Activity page, select whether to send the activity to either a Log File or Syslog Server. Click Next.
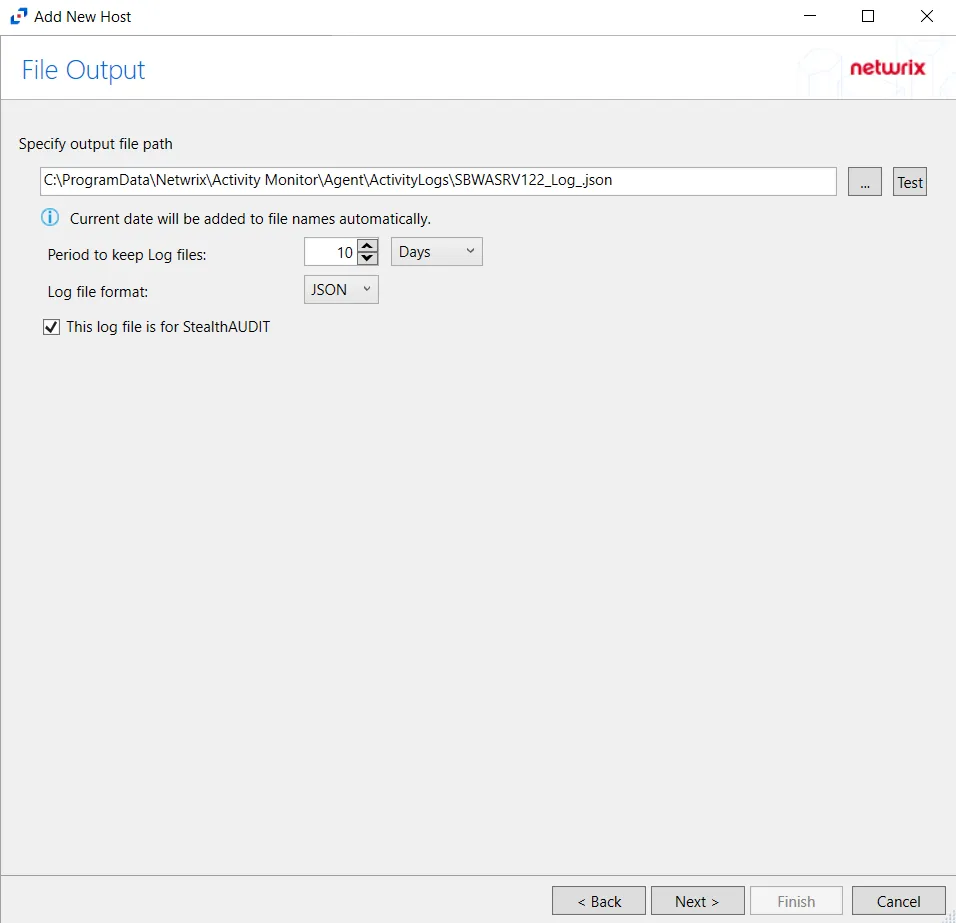
Step 7 – If Log File is selected on the Where To Log The Activity page, the File Output page can be configured. The configurable options are:
-
Specify output file path – Specify the file path where log files are saved. Click the ellipses button (...) to open the Windows Explorer to navigate to a folder destination. Click Test to test if the path works.
-
Period to keep Log files – Log files will be deleted after the period entered number of days entered. The default is 10 days. Use the dropdown to specify whether to keep the Log files for a set amount of Minutes, Hours, or Days.
-
This log file is for Netwrix Enterprise Auditor (StealthAUDIT) – Enable this option to have Access Analyzer collect this monitored host configuration
RECOMMENDED: Identify the configuration to be read by Netwrix Access Analyzer (formerly Enterprise Auditor) when integration is available.
- While the Activity Monitor can have multiple configurations per host, Netwrix Access Analyzer (formerly Enterprise Auditor) can only read one of them.
Click Next.
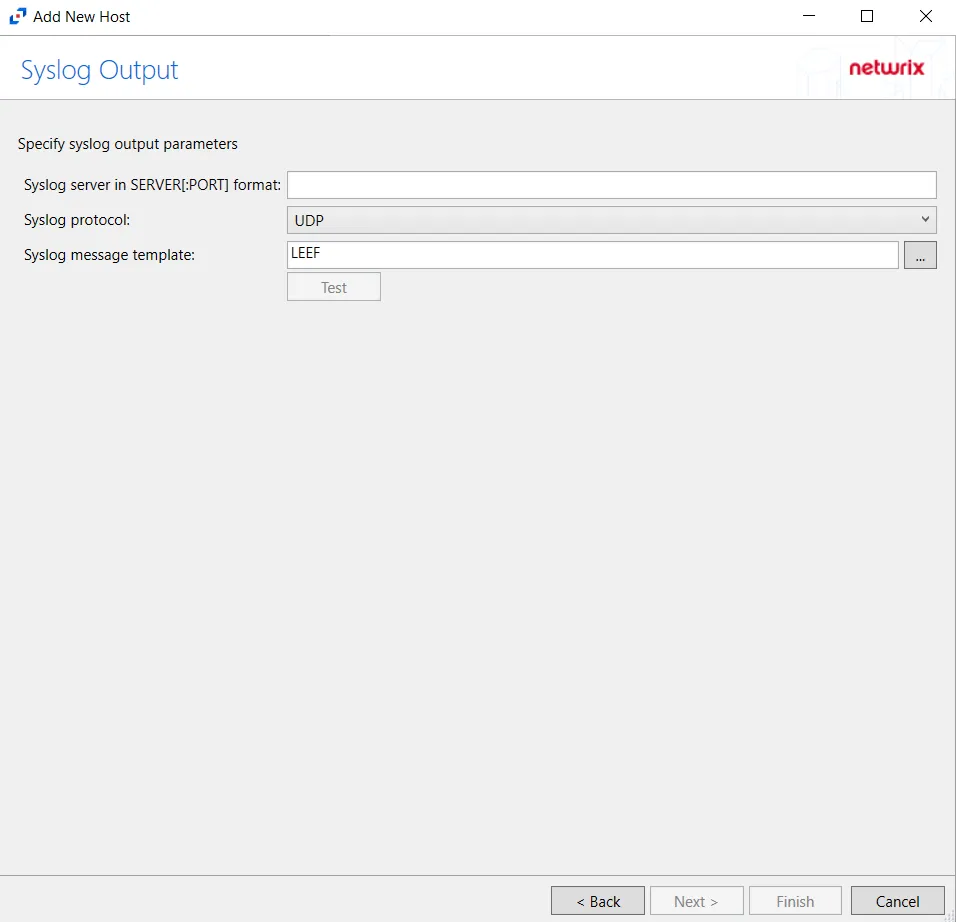
Step 8 – If Syslog Server is selected on the Where To Log The Activity page, the Syslog Output page can be configured. The configurable options are:
-
Syslog server in SERVER[:PORT] format – Type the Syslog server name with a SERVER:Port format in the textbox.
- The server name can be short name, fully qualified name (FQDN), or IP Address, as long as the organization’s environment can resolve the name format used. The Event stream is the activity being monitored according to this configuration for the monitored host.
-
Syslog Protocol – Identify the Syslog protocol to be used for the Event stream. The drop-down menu includes:
- UDP
- TCP
- TLS
The TCP and TLS protocols add the Message framing drop-down menu. See the Syslog Tab topic for additional information.
-
The Test button sends a test message to the Syslog server to check the connection. A green check mark or red will determine whether the test message has been sent or failed to send. Messages vary by Syslog protocol:
- UDP – Sends a test message and does not verify connection
- TCP/TLS – Sends test message and verifies connection
- TLS – Shows error if TLS handshake fails
See the Syslog Tab topic for additional information.
Click Finish.
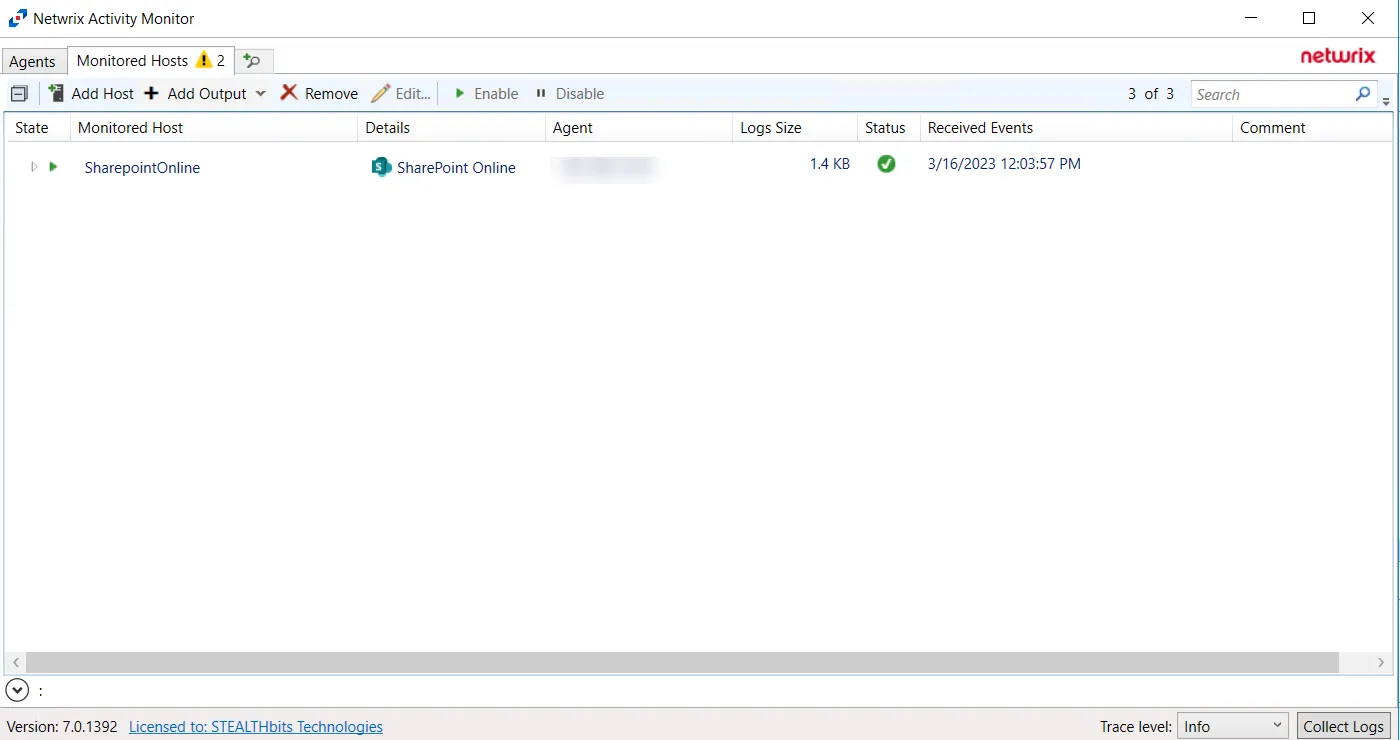
The added SharePoint Online host is displayed in the monitored hosts table. Once a host has been added for monitoring, configure the desired ouptuts. See the Output for Monitored Hosts topic for additional information.
Host Properties for SharePoint Online
Configuration settings can be edited through the tabs in the host’s Properties window. The configurable host properties are:
See the Host Properties Window topic for additional information.