Add New Host Window
Once an agent has been deployed, you can configure a host to be monitored by clicking the Add Host button on the Monitored Hosts tab.
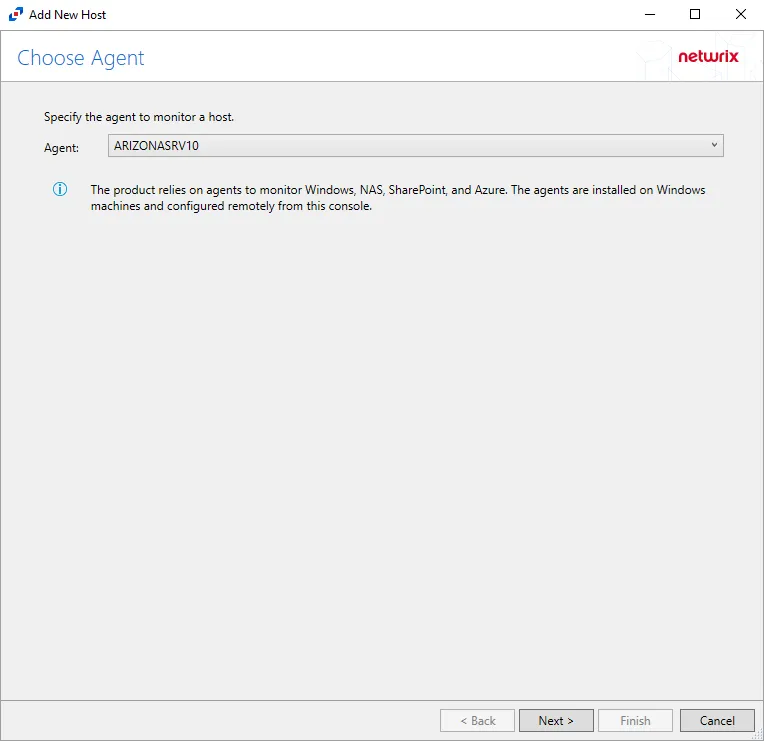
The window opens for all types of hosts that can be monitored with an Activity Agent. See the following topics for additional information:
- CTERA Activity Auditing Configuration
- Dell Celerra or VNX
- Dell Isilon/PowerScale
- Dell PowerStore
- Dell Unity
- Exchange Online
- Hitachi
- Microsoft Entra ID
- Nasuni
- NetApp
- Nutanix
- Panzura
- Qumulo
- SharePoint
- SharePoint Online
- SQL Server
- Windows
Monitored Hosts Tab
Understanding Monitored Hosts
There are many types of hosts or platforms that can be monitored using the Activity Agent or Linux Agent:
- Windows
- Dell Celerra or VNX
- Dell Isilon/PowerScale
- Dell PowerStore
- Dell Unity
- Hitachi
- Linux – Configuration of a Linux host is done during agent deployment. See the Linux Agent Deployment topic for additional information.
- Nasuni
- NetApp
- Nutanix
- Panzura
- Qumulo
- Microsoft Entra ID (formerly Azure AD)
- SharePoint
- SharePoint Online
- Exchange Online
- SQL Server
See the Add New Host Window topic for additional information.
Agents
An agent must be deployed to the server to be monitored for:
- Linux
- SharePoint
- Windows
For all other hosts, the agent is deployed to a Windows proxy server.
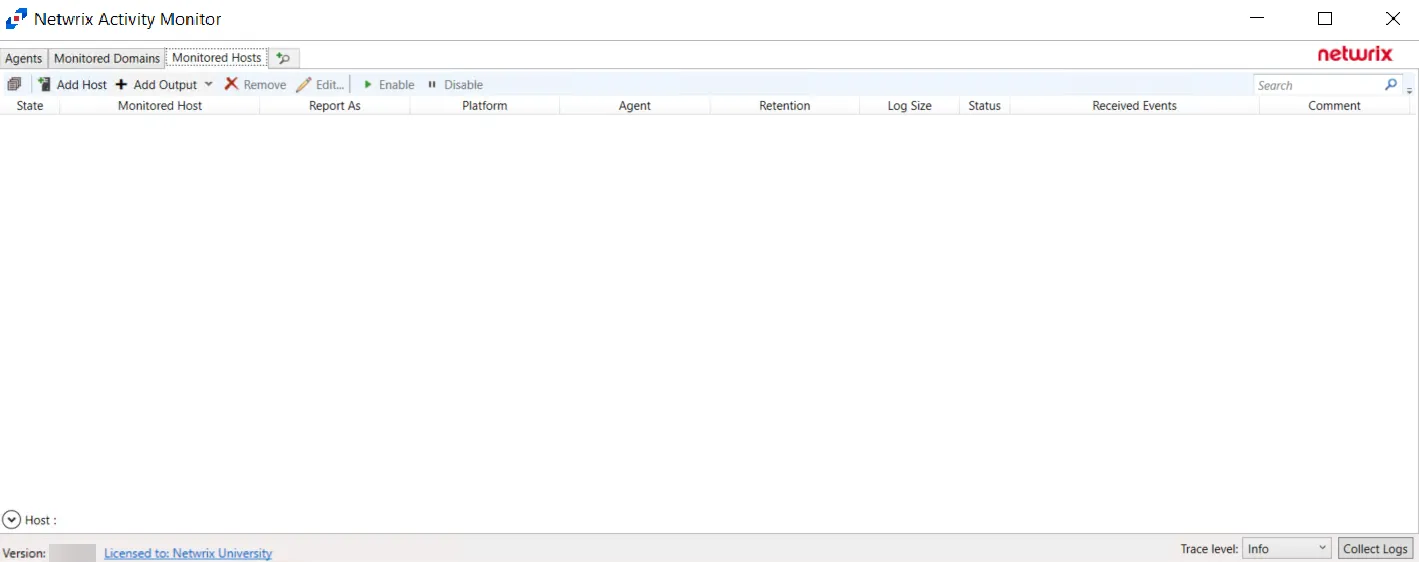
Tab
Once the agent(s) installation is complete, hosts can be added for monitoring. The tab is not visible within the console until at least one agent has been deployed.
This tab is comprised of a button bar and a table of hosts being monitored. A list of outputs is listed under each monitored host. These are destinations to which events are forwarded.
Button Bar
The button bar allows users to take the following actions:
- Toggle Collapse – Expands and collapses all Monitored Hosts for viewing or hiding host's outputs
- Add Host – Opens the Add New Host window to configure monitoring of a new host or platform. See the section for instructions on adding the desired target environment.
- Add Output – Opens the Add New Output windows to create new output for the selected host or hosts.
- Remove – Remove the selected hosts or outputs from the monitored hosts table and end monitoring. A window prompts for confirmation to remove the selected hosts or outputs.
- Edit – Opens the selected hosts or outputs' Properties window to modify monitoring settings
- Enable – Resume monitoring which has been stopped or paused
- Disable – Stop or pause monitoring of the selected hosts or outputs
Bulk Actions
All actions in the button bar except Add Host can be used in the bulk mode. That means youI.e. one can select several hosts or outputs and edit, disable, enable, remove them, or add new outputs at the same time.
Bulk editing allows the user to selectively modify hosts or outputs. For example, with bulk editing it is possible to add a user to Account Exclusions, or set the retention period for log files, or disable reporting of Directory Read operations, etc.
To initiate bulk editing, select multiple hosts or outputs (Ctrl+A and Ctrl+Shift+A may help
here), and click the Edit Edit button. The Properties window shows divergent settings as blank
or in the unknown state or with the <-Different-Values-> marker for the list-like settings. Leave
the <-Different-Values-> marker to preserve the difference in each selected object, or delete it
to remove all divergent elements. When the window closes, only changed properties are saved to all
selected objects, leaving unchanged properties untouched.
Table
The monitored hosts table provides the following information:
- State — State of the monitored host. The two states are Enabled and Disabled.
- Monitored Host – Name or IP Address of the host being monitored
- Report As — How the Monitored Host is being reported as. This can be customized in the host's properties.
- Details — Displays additional details about the monitored host, such as the Platform and the Log Path.
- Agent – Name or IP Address of the server where the activity agent is deployed
- Retention – Number of days for which the activity log files are retained
- Log Size – Size of the activity log files
- Status – Indicates the status of activity monitoring for the host. See the Error Propagation topic for additional information.
- Received Events – Timestamp of the last event received
- Comment – Comment provided by user:
- Often this indicates the desired output, e.g. Access Analyzer.
- This can be useful if adding the same monitored host multiple times with different configurations for different outputs.
- If a Activity Monitor Agent has been deployed to a Windows server where an activity agent is deployed, then the Comment identifies the host as "Managed by Activity Monitor", and that 'monitored host' is not editable. Add the host again for other outputs.
Hosts can have more than one output. To view a host's outputs, expand the host by clicking the white arrow to the left of the Monitored Host name.
For integration with Netwrix Access Analyzer (formerly Enterprise Auditor), only one configuration of a 'monitored host' can be set as the Netwrix Access Analyzer (formerly Enterprise Auditor) output. After a 'monitored host' has been added, use the Edit feature to identify the configuration as being for Netwrix Access Analyzer (formerly Enterprise Auditor) on the Log Files tab of the host's Properties window. See the Log Files Tab topic for additional information.
Monitoring Status
The Status collapsible section located above the Status Bar of the Activity Monitor provides visibility into a host's monitoring state and history of state changes. Host monitoring status is depicted in the Monitored Hosts table under the Status column. Users can expand the Status section to view more information on various status conditions.
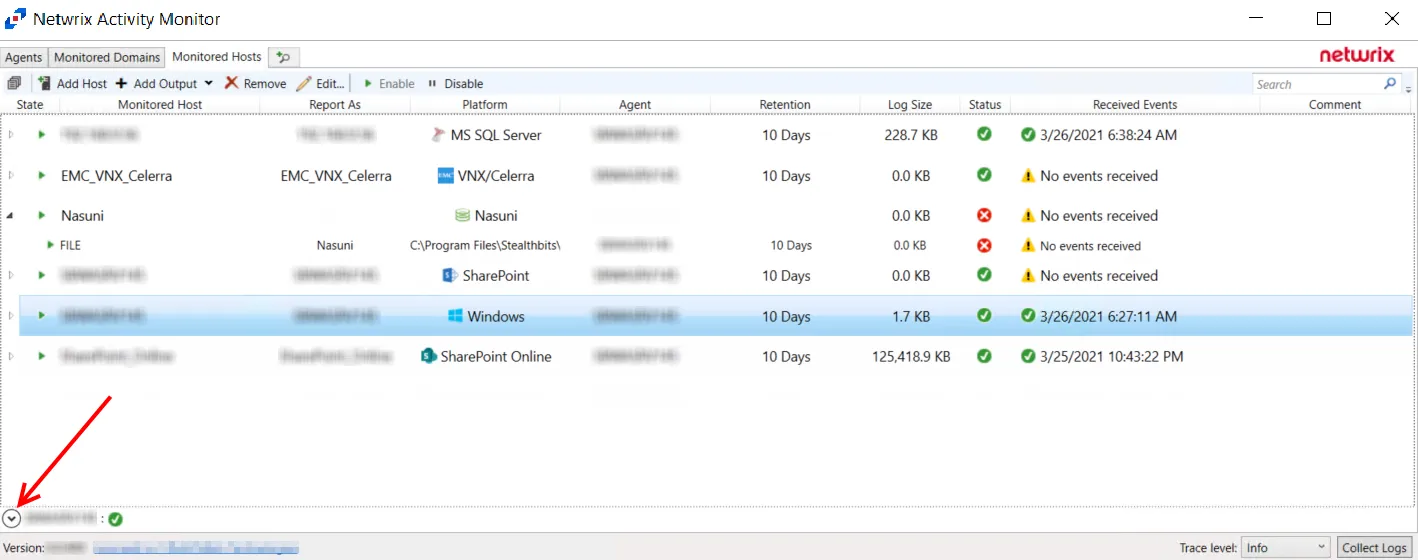
Click the Down Arrow to expand the Status section. The information listed is dependent on which host or output is currently selected in the Monitored Hosts table. Users can find information on the Current State of a host, as well as viewing a history of changes in state.
The possible statuses depend on the type of hosts being monitored. What is common is that the status can help identify a problem and provide a possible workaround. The following sections provide more information about device-specific states.
Linux Monitoring Status
For file activity monitoring on Linux, Activity Monitor relies on auditd component of the Linux Auditing System. One of the features of auditd is the immutable mode, which locks the audit configuration and protects it from being changed. When the immutable mode is enabled, the only way to change the auditing configuration is to reboot the server.
Activity Monitor supports the immutable mode. It compares the current auditd configuration with the desired one. If they differ and the immutable mode is enabled, the product displays a warning in the status section that a server restart is required. After the reboot, the changes take effect and the immutable mode is enabled.
Qumulo Monitoring Status
The No connections from Qumulo clusters error may be displayed in the status section. This error indicates that the Qumulo nodes have not yet connected to the agent. This can happen either because an incorrect address or port is specified in the Audit page of the Qumulo Web Interface, or because the port (4496 by default) is blocked by a firewall.
Host Properties Window
Once a host has been added to the Monitored Hosts list, the configuration settings can be modified through the host’s Properties window.
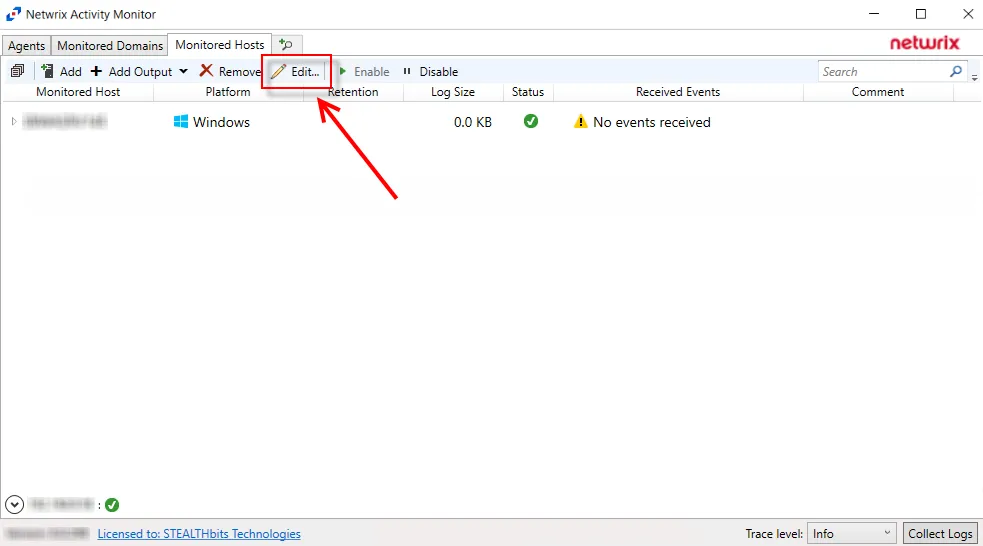
On the Monitored Hosts tab, select the host and click Edit, or right-click on a host and select Edit Host from the right-click menu, to open the host’s Properties window. The tabs vary based on the type of host selected:
- Auditing Tab — Dell Isilon/PowerScale devices only
- Connection Tab — Microsoft Entra ID, Exchange Online, and SharePoint Online only
- Dell Tab — Dell devices only
- FPolicy Tab — NetApp devices only
- Hitachi NAS Tab — Hitachi NAS devices only
- Inactivity Alerts Tab
- Logon Trigger Tab — SQL Server hosts only
- MS SQL Server Tab — SQL Server hosts only
- Nasuni Tab — Nasuni Edge Appliances only
- NetApp Tab — NetApp devices only
- Nutanix Tab — Nutanix devices only
- Panzura Tab — Panzura devices only
- Qumulo Tab — Qumulo devices only
- SharePoint Tab — SharePoint only
- Tweak Options Tab — SQL Server hosts only
- Unix IDs Tab — NetApp devices, Dell devices, and Nasuni Edge Appliances only
- Windows Tab — Windows hosts only