File Activity Monitor App for Splunk
Stealthbits File Activity monitoring solutions enable organizations to successfully, efficiently, and affordably monitor file access and permission changes across Windows and Network Attached Storage (NAS) file systems in real-time. Using the preconfigured Stealthbits File Activity Monitor App for Splunk, users can quickly understand all file activities as a whole, for specific resources or users, as well as patterns of activity indicative of threats such as crypto ransomware or data exfiltration attempts. With full control over the data, users can create custom searches, all while enabling Splunk to correlate file system activity with any log source.
This document describes how to integrate Netwrix products with the Stealthbits File Activity Monitor App for Splunk found in Splunkbase. Any Netwrix product can be configured to monitor file system activity and send the monitored events to Splunk. After installing this app, ensure that either theActivity Monitor, Threat Prevention, or Enterprise Auditor has been configured to send events to Splunk. See the product user guide on the Netwrix Technical Knowledge Center for additional information.
App Installation in Splunk
Download the Splunk documentation from the Netwrix Activity Monitor Documentation from the Splunkbase. After downloading the Stealthbits File Activity Monitor App for Splunk, follow the guide provided by Splunk to install the app.
NOTE: In order to use the Ransomware dashboard within the app, install Splunk User Behavior Analytics (any version) and the Machine Learning Toolkit app for Splunk (version 2.0.0+).
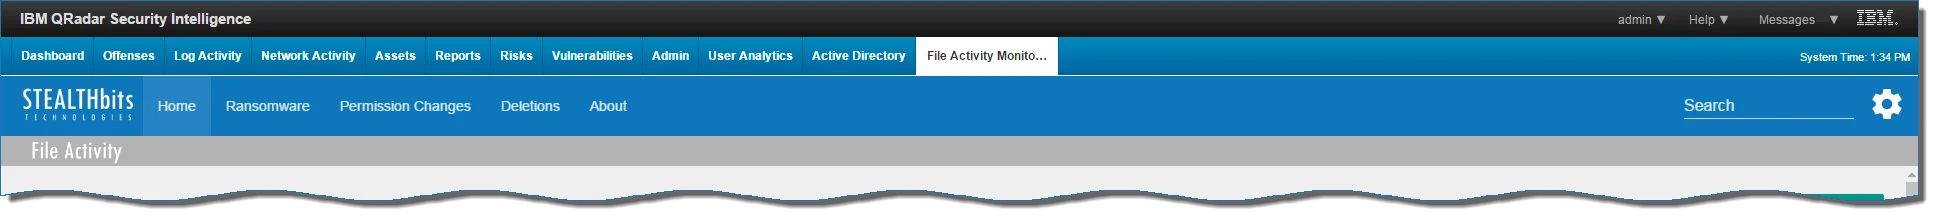
The Stealthbits: File Activity Monitor tab will appear within the Splunk web interface. Once installation of the Stealthbits File Activity Monitor App for Splunk is complete, it must be configured to receive data from either theActivity Monitor or Threat Prevention.
Initial Configuration of the Splunk App
Follow the steps to configure Splunk to receive data from Stealthbits products.
Step 1 – Determine the IP Address of the Splunk Console, e.g. run the ifconfig command. This information is required for the following sections:
- See the Syslog Tab section in the Netwrix Activity Monitor Documentation for information on how to configure the Activity Monitor to send data to QRadar.
- See the SIEM Tab section in the Netwrix Threat Prevention Documentation for information on how to configure Threat Prevention to send data to QRadar.
Step 2 – Navigate to the Settings menu in the Splunk web interface and click Data Inputs.
Step 3 – Select UDP.
Step 4 – Click New and add a new data input with Port 514. If another Splunk UDP input is already using 514, another value (515 or higher) can be used as long as it is not blocked by the network. Remember to configure the port within the Stealthbits product configuration to align with this change.
Step 5 – Click Next.
Step 6 – Under Input Settings, enter the following information:
- Source Type – Enter one of the following options:
- For data coming from the Stealthbits Activity Monitor – SFAM
- For data coming from Threat Prevention – Threat Prevention
- App context – Select Search and Reporting
- Host – Select IP
- Index – Select Default
Step 7 – Review and save the new settings. Remember, prior to using the Stealthbits File Activity Monitor App for Splunk, the related Stealthbits products must be configured to send data to Splunk.
Step 8 – Test that the configuration is working correctly. Check the Search and Reporting app inside of the web console for Splunk (search for SFAM or StealthINTERCEPT). There should be logs of events which are generated as soon as Splunk starts receiving data. If there are no events, use a packet sniffer to ensure that packets are being sent correctly between the hosts, and diagnose any possible network issues.
The Stealthbits File Activity Monitor App for Splunk can now display activity data from either the Stealthbits Activity Monitor or StealthINTERCEPT.
File Activity Monitor App for Splunk
Stealthbits File Activity Monitor App for Splunk contains several predefined dashboards: File Activity (Overview), Ransomware, Permission Changes, and Deletions.
The date time search feature uses the default Splunk search features.
The timeframe interval is identified in the upper-left corner of each dashboard. The drop-down menu provides additional options. To search within a different interval, choose a new option from the menu. Then click Submit to refresh the card data.
Overview Dashobard
View general information on the Overview Dashboard for Splunk.
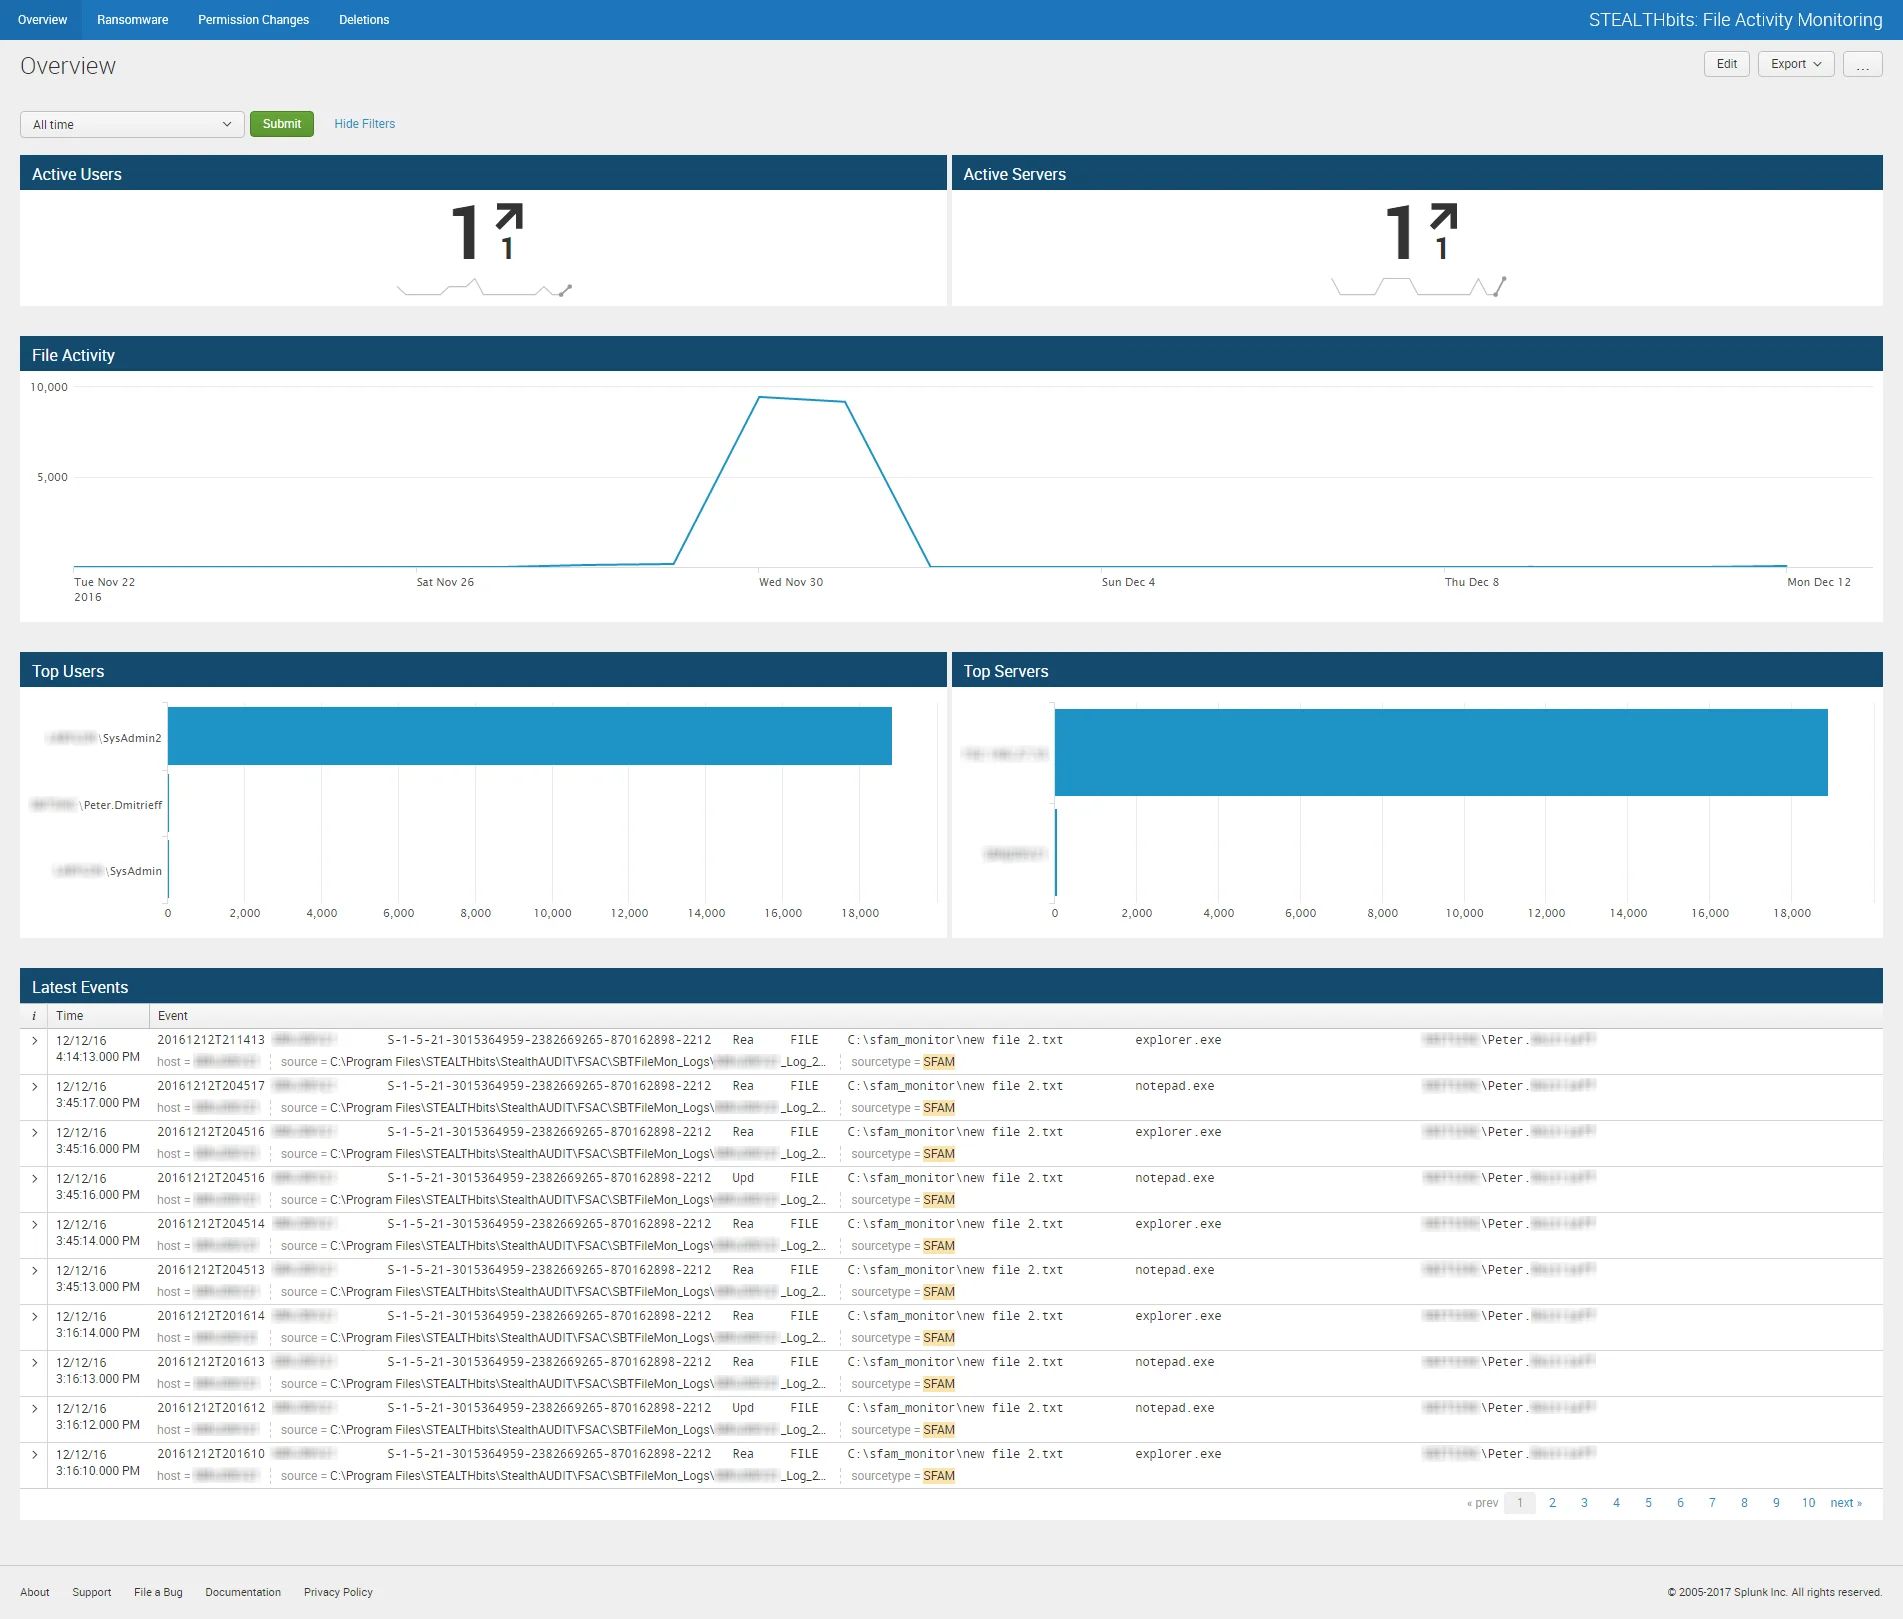
The File System Activity Overview dashboard contains the following cards:
- Active Users – Number of users involved with file system events in the specified timeframe
- Active Servers – Number of servers involved with file system events in the specified timeframe
- File Activity – Timeline of all file system events in the specified timeframe
- Top Users – Displays up-to the top five users addresses related to file system events which have been recorded in the specified timeframe
- Top Servers – Displays up-to the top five client IP addresses/host names related to file system events which have been recorded in the specified timeframe
- Latest Events – Tabular format of all file system change events which have been recorded in the specified timeframe
The specified timeframe is set by default to the Last 24 hours, or past day.
Deletions Dashboard
View deletion information in the Deletions Dashboard for Splunk.
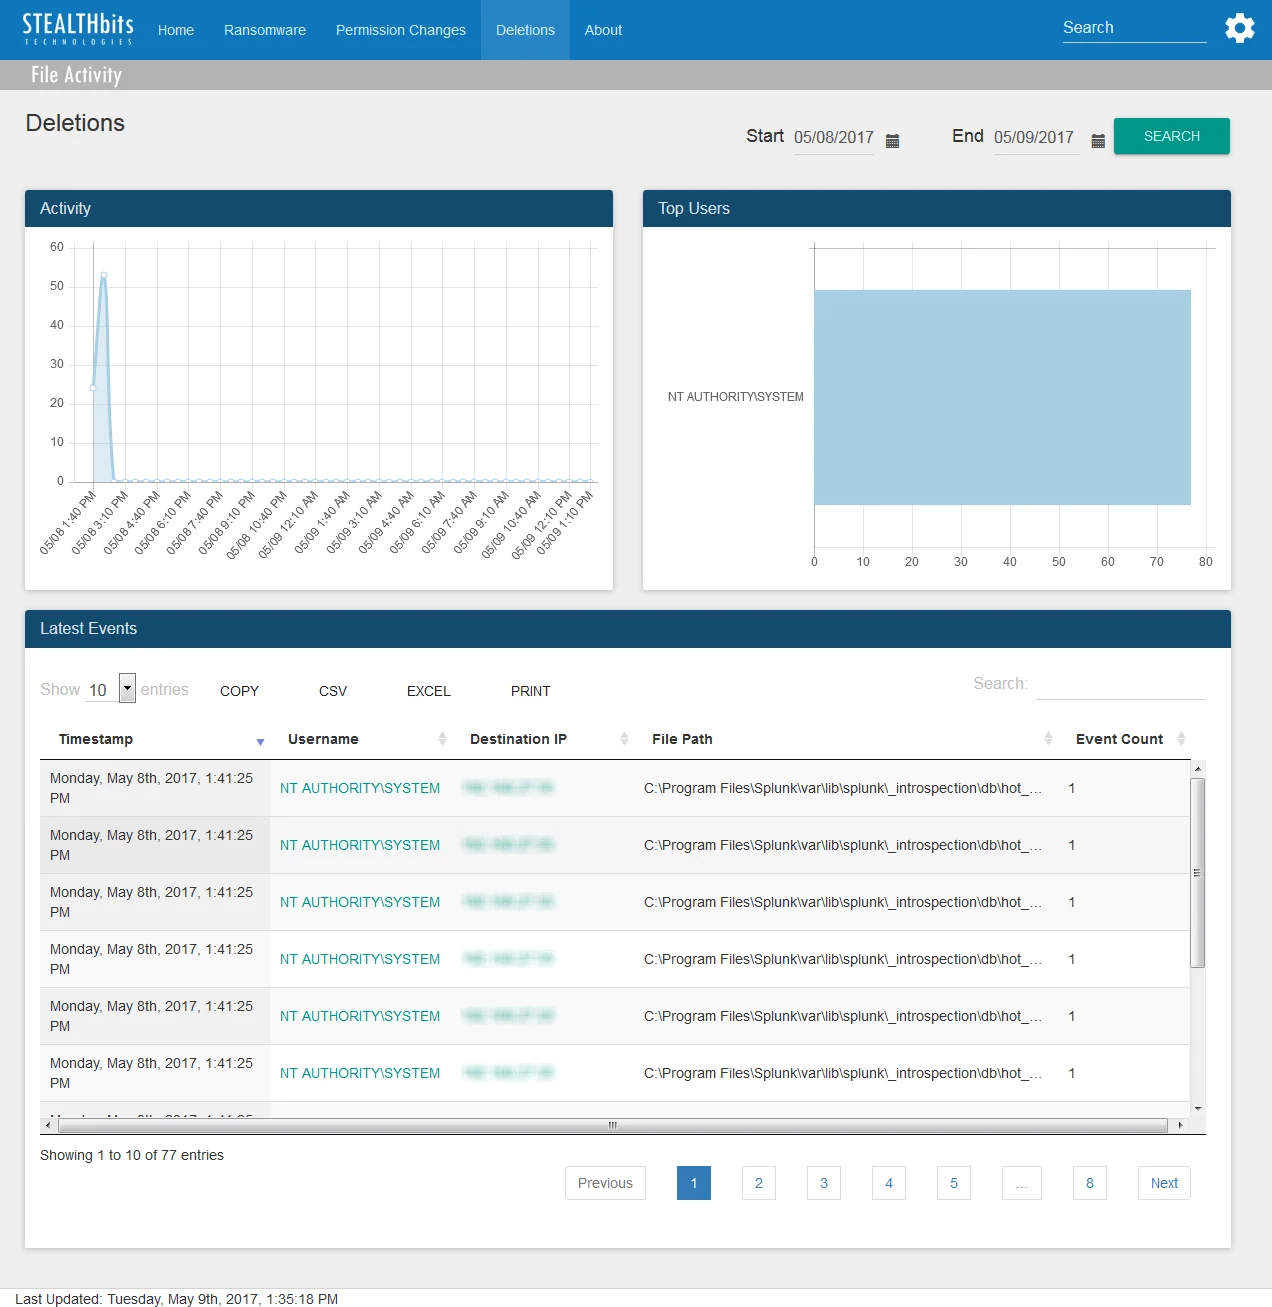
The Deletions dashboard contains the following cards:
- Activity – Timeline of all deletion events in the specified timeframe
- Top Users – Displays up-to the top five users related to deletion events which have been recorded in the specified timeframe
- Latest Events – Tabular format of all deletion events recorded in the specified timeframe
The specified timeframe is set by default to the Last 24 hours, or past day.
Permission Changes Dashboard
View information on permissions changes on the through the Permission Changes Dashboard for Splunk.
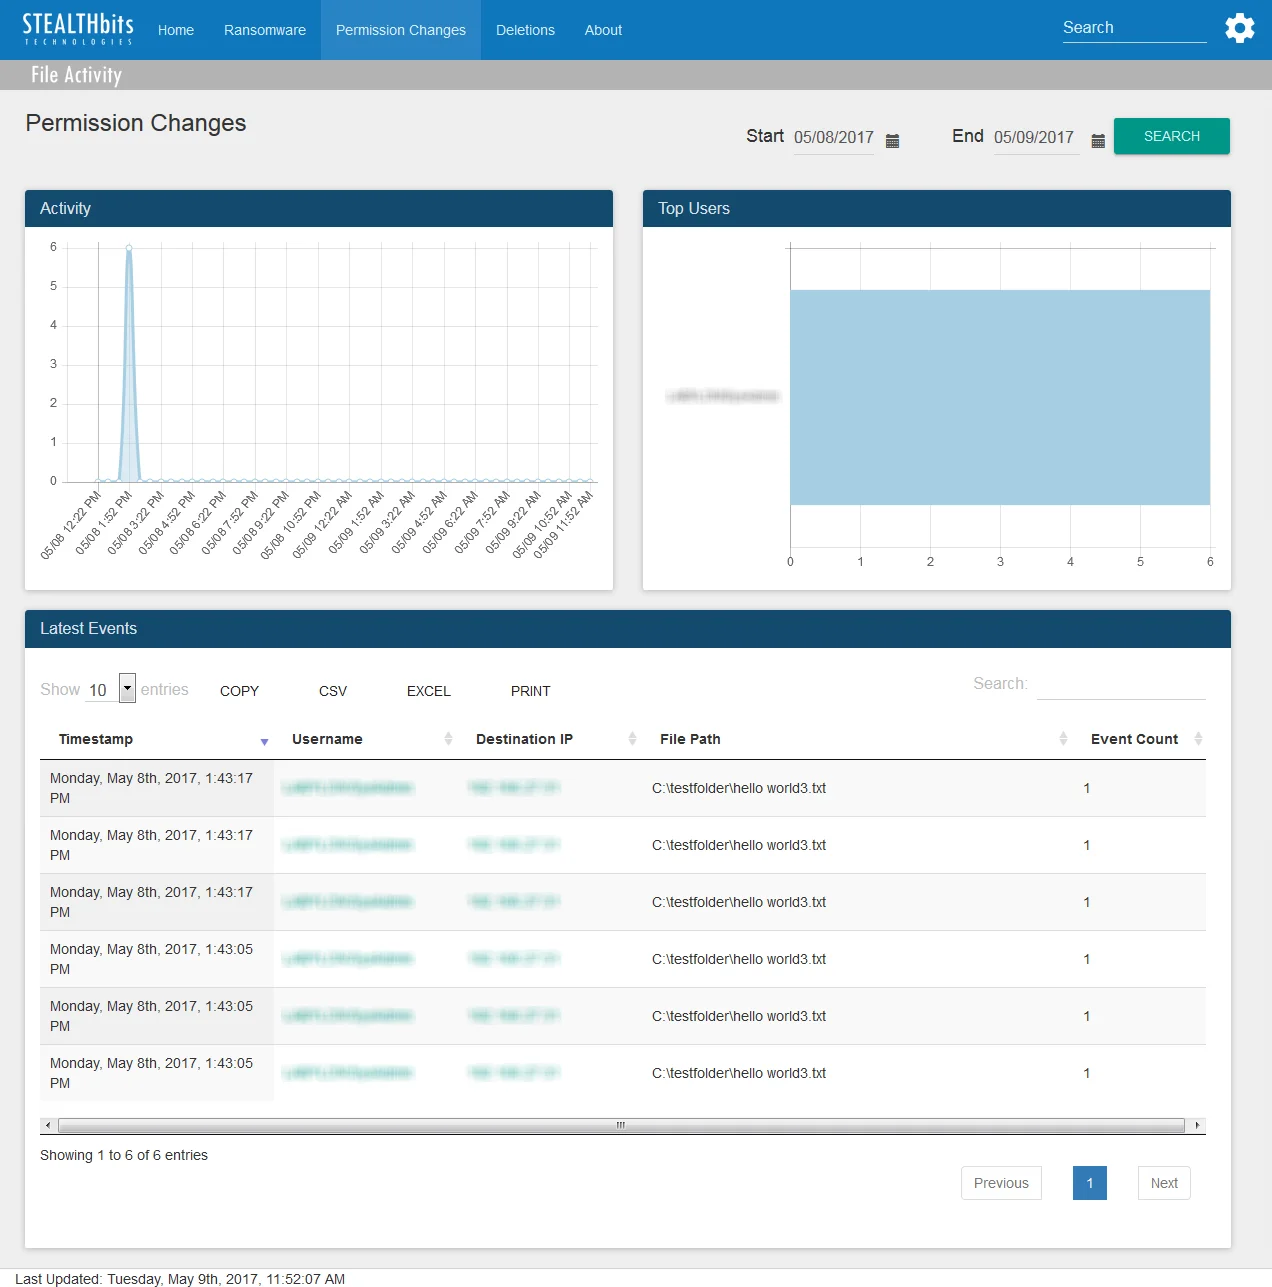
The Permission Changes dashboard contains the following cards:
- Activity – Timeline of all permission change events in the specified timeframe
- Top Users – Displays up-to the top five users related to permission change events which have been recorded in the specified timeframe
- Latest Events – Tabular format of all permission change events recorded in the specified timeframe
The specified timeframe is set by default to the Last 24 hours, or past day.
Ransomware Dashboard
View information on ransomware using the Ransomware Dashboard for Splunk.
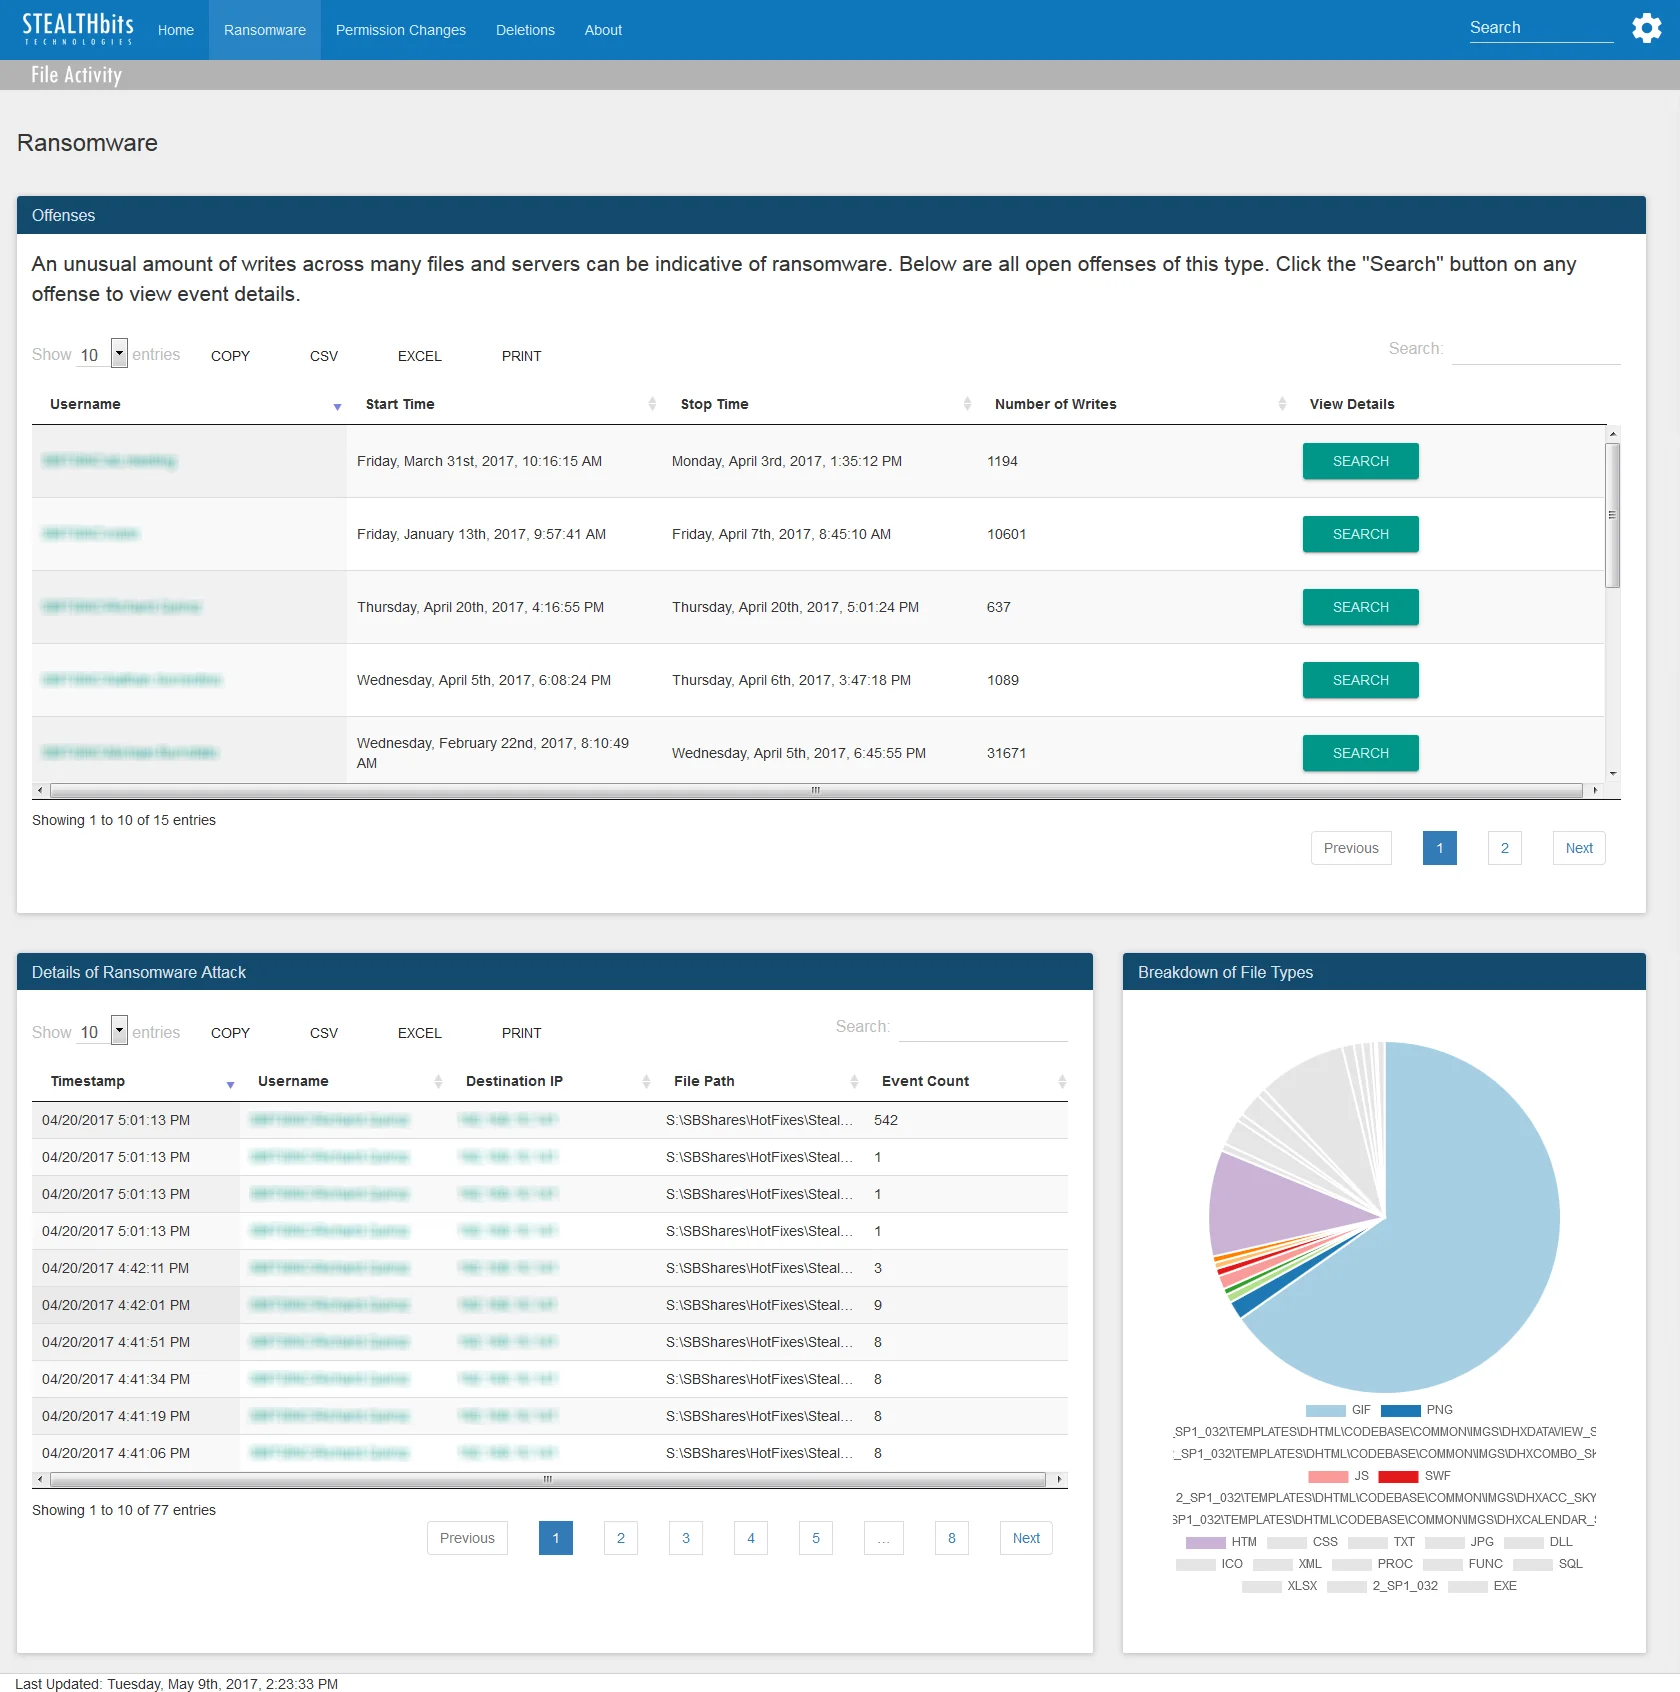
The Ransomware dashboard contains the following cards:
- Number of Potential Perpetrators – Number of users involved with events tied to outliers
- Number of Outliers – Number of outliers by count of file/folder update events
- Outliers by Count of File/Folder Updates – Graph of expected values for count of file/folder update events (blue area) and calculated outliers (red dots)
- Outliers by Count of File/Folder Updates Details – Breakdown of outliers by users involved in each outlier and percent of events by user
- Outlier Events – Tabular format of all file system change events related to outliers