Active Directory Search Query
You can search domain activity that has been monitored and recorded to a File output. When you select Active Directory from the magnifying glass drop-down menu, a New Search tab opens with the applicable query filters.
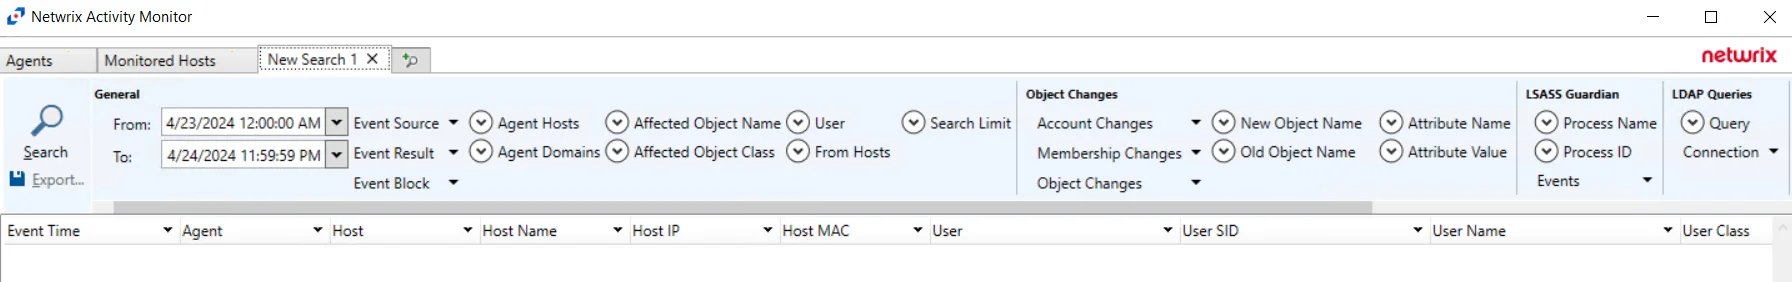
The filters are separated into the following categories:
- General
- Object Changes
- LSASS Guardian
- LDAP Queries
- Authentication
By default, the query is set to return all event activity for the past day. Configuring query filters will scope results returned.
Set the filters as desired and click Search. The application searches through the appropriate activity log files and returns the events that match the filters. You can Filter and Sort the results using the column headers. Below the Search button is the Export option.
Filter Value Entry
When the drop-down menu is in front of a query filter, it is used to show or hide the filter entry field. Field options vary based on the selected query filter:
-
Textbox – Enter the filter value. If the field has a drop-down arrow, then you can select from values known to the application.
-
Gray drop-down menu – Provides options to match the value against on of the following, which vary based on the filter:
- Selected values – Filters by the value selected from the drop-down menu for the textbox
- Simple string with wildcards – Filters by the value entered into the textbox, which contains an asterisk (*) as the wildcard
- Regular expression – Filters by the Regex entered into the textbox
General Category
The General category addresses who, what, where, and when an object, user, host, or domain controller is affected by the events selected in the other categories. The time frame filter must be configured for every search query.
This section has the following filters:
-
From – Set the date and timestamp for the start of the activity range. The drop-down menu opens a calendar.
-
To – Set the date and timestamp for the end of the activity range. The drop-down menu opens a calendar.
-
Event Source – Set which query categories will be used. The drop-down menu displays a checkbox list of categories.
-
Event Result – Filter the data for a specific event result: Any, Success, or Failure
-
Event Block – Filter the data for a specific event result related to blocking: Any, Allowed, or Blocked
-
Agent Hosts – Filter the data for a specific agent
-
Agent Domains – Filter the data for a specific domain
-
Affected Object Name – Filter the data for a specific affected object name
-
Affected Object Class – Filter the data for a specific affected object class
-
User – Filter the data for a specific user, or perpetrator of the event
- Specify account or group (...) – The ellipsis button beside the User textbox opens the Specify account or group window. Use this window to resolve the account for the user. See the Specify Account or Group Window topic for additional information.
-
From Hosts – Filter the data for a specific originating host of the event
-
Search Limit – Set the maximum number of rows returned in the search results. The default is 10,000 rows.
Object Changes Category
The Object Changes category scopes the query by objects with change activity.
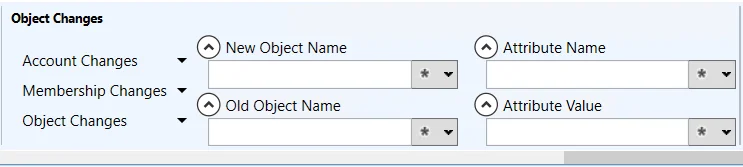
This section has the following filters:
- Account Changes – Filter the data by the type of account change: All, Account Locked, Account Unlocked, Account Disabled, Account Enabled, Password Changed
- Membership Changes – Filter the data by the type of group membership change: All, Group Members Added, Group Members Removed, Group Members Changed
- Object Changes – Filter the data by the type of group membership change: All, Object Moved, Object Renamed, Object Added, Object Modified, Object Deleted
- New Object Name – Filter the data for a specific new object name
- Old Object Name – Filter the data for a specific old object name
- Attribute Name – Filter the data for a specific attribute name
- Attribute Value – Filter the data for a specific attribute value
LSASS Guardian Category
The LSASS Guardian category scopes the query by LSASS Guardian activity.

This section has the following filters:
- Process Name – Filter the data for a specific process name
- Process ID – Filter the data for a specific process ID
- Events – Filter the data by the type of event: All, Create Handle, Duplicate Handle
LDAP Queries Category
The LDAP Queries category scopes the query by LDAP query activity.

This section has the following filters:
- Query – Filter the data for a specific LDAP query
- Connection – Filter the data by the type of connection : Any, Secure, Nonsecure
Authentication Category
The Authentication category scopes the query by authentication activity.
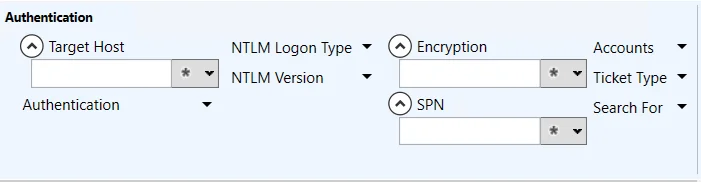
This section has the following filters:
- Target Host – Filter the data for a specific host
- Authentication – Filter the data by the type of authentication: All, Kerberos, NTLM
- NTLM Logon Type – Filter the data by the type of NTLM Logon: All, Interactive, Network, Service, Generic, Transitive Interactive, Transitive Network, Transitive Service
- NTLM Version – Filter the data by the type of NTLM version: Any, V1, V2
- Encryption – Filter the data for a specific encryption
- SPN – Filter the data for a specific service principal name (SPN)
- Accounts – Filter the data by the type of account: Any, Existing, Nonexistent
- Ticket Type – Filter the data by the type of ticket type: Any, AS, TGS
- Search For – Filter the data by the selected item: Previous passwords usage only, Forged PAC only
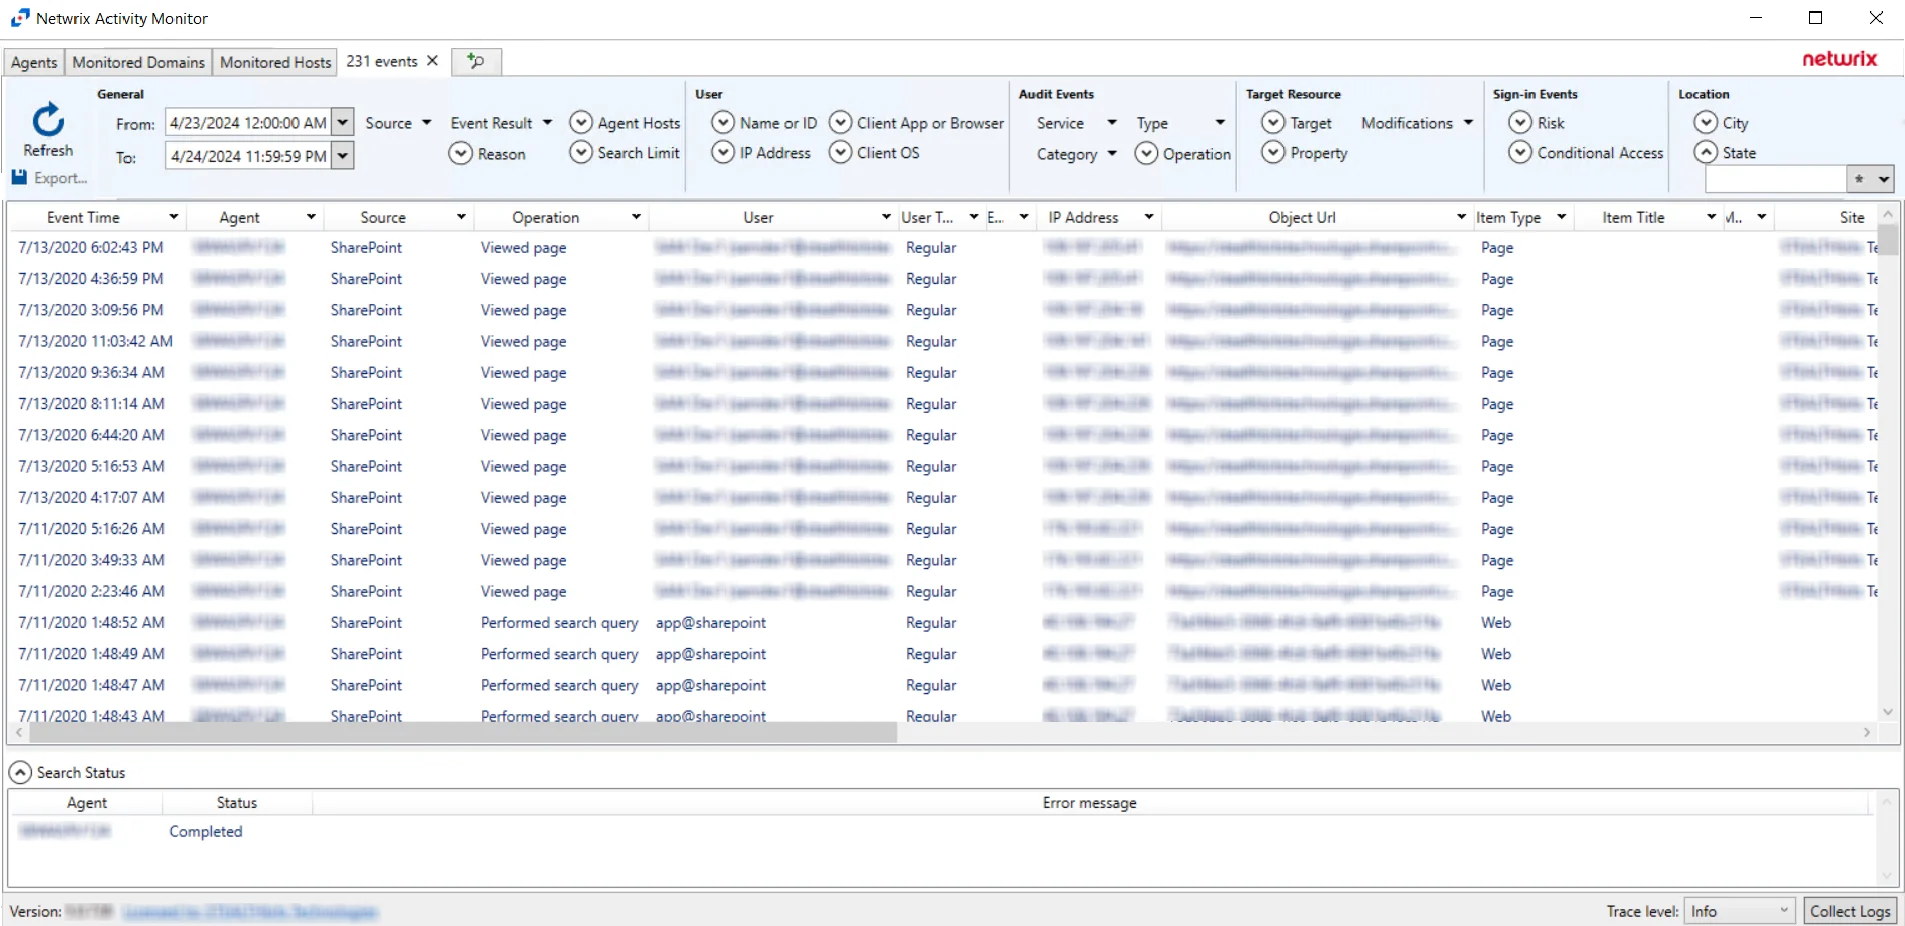
Microsoft Entra ID Search Query
You can search activity in Microsoft Entra ID (Azure AD) that has been monitored and recorded to a File output. When you select Azure AD / Entra ID from the magnifying glass drop-down menu, a New Search tab opens with the applicable query filters.

The filters are separated into the following categories:
- General
- User
- Audit Events
- Target Resource
- Sign-in Events
- Location
By default, the query is set to return all event activity for the past day. Configuring query filters will scope results returned.
Set the filters as desired and click Search. The application searches through the appropriate activity log files and returns the events that match the filters. You can Filter and Sort the results using the column headers. Below the Search button is the Export option.
Filter Value Entry
When the drop-down menu is in front of a query filter, it is used to show or hide the filter entry field. Field options vary based on the selected query filter:
-
Textbox – Enter the filter value. If the field has a drop-down arrow, then you can select from values known to the application.
-
Gray drop-down menu – Provides options to match the value against on of the following, which vary based on the filter:
- Selected values – Filters by the value selected from the drop-down menu for the textbox
- Simple string with wildcards – Filters by the value entered into the textbox, which contains an asterisk (*) as the wildcard
- Regular expression – Filters by the Regex entered into the textbox
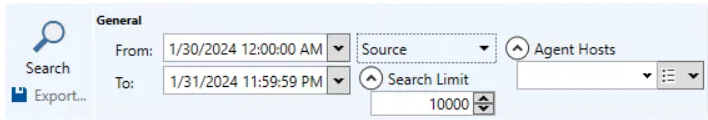
General Category
The General category scopes the query by the most common types of filters. The time frame filter must be configured for every search query.
This section has the following filters:
- From – Set the date and timestamp for the start of the activity range. The drop-down menu opens a calendar.
- To – Set the date and timestamp for the end of the activity range. The drop-down menu opens a calendar.
- Source – Set which query categories will be used. The drop-down menu displays a checkbox list of categories.
- Event Result – Filter the data for a specific event result: Any, Success, or Failure
- Reason
- Agent Hosts – Filter the data for a specific agent
- Search Limit – Set the maximum number of rows returned in the search results. The default is 10,000 rows.
User Category
The User category scopes the query by the user, or perpetrator of the activity.

This section has the following filters:
- Name or ID
- IP Address
- Client App or Browser
- Client OS
Audit Events Category
The Audit Events category scopes the query by the event type of the activity.

This section has the following filters:
- Service – Filter the data by the Microsoft Entra ID service: All, AAD Management UX, Access Reviews, Account Provisioning, Application Proxy, Authentication Methods, B2C, Conditional Access, Core Directory, Device Registration Service, Entitlement Management, Hybrid Authentication, Identity Protection, Invited Users, MIM Service, MyApps, PIM, Self-service Group Management, Self-service Password Management, Terms of Use
- Category – Filter the data by the category type of activity: All, AdministrativeUnit, ApplicationManagement, Authentication, Authorization, AuthorizationPolicy, Contact, Device, DeviceConfiguration, DirectoryManagement, EntitlementManagement, GroupManagement, IdentityProtection, KerberosDomain, KeyManagement, Label, Other, PermissionGrantPolicy, Policy, PolicyManagement, ResourceManagement, RoleManagement, UserManagement
- Type – Filter the data by the type of activity: All, Add, Delete, Update, Assign, Unassign
- Operation
Target Resource Category
The Target Resource category scopes the query by the target of the activity.

This section has the following filters:
- Target
- Property
- Modifications – Filter the data to a specific type of modification: All, No changes, Has attribute changes
Sign-in Events Category
The Sign-in Events category scopes the query by the sign-in event.

This section has the following filters:
- Risk
- Conditional Access
Location Category
The Location category scopes the query by the location of the user.

This section has the following filters:
- City
- State
- Country
Exchange Online Search Query
You can search Exchange Online activity that has been monitored and recorded to a File output. When you select Exchange Online from the magnifying glass drop-down menu, a New Search tab opens with the applicable query filters.

The filters are separated into the following categories:
By default, the query is set to return all event activity for the past day. Configuring query filters will scope results returned.
Set the filters as desired and click Search. The application searches through the appropriate activity log files and returns the events that match the filters.You can Filter and Sort the results using the column headers. Below the Search button is the Export option.
Filter Value Entry
When the drop-down menu is in front of a query filter, it is used to show or hide the filter entry field. Field options vary based on the selected query filter:
-
Textbox – Enter the filter value. If the field has a drop-down arrow, then you can select from values known to the application.
-
Gray drop-down menu – Provides options to match the value against on of the following, which vary based on the filter:
- Selected values – Filters by the value selected from the drop-down menu for the textbox
- Simple string with wildcards – Filters by the value entered into the textbox, which contains an asterisk (*) as the wildcard
- Regular expression – Filters by the Regex entered into the textbox
General Category
The General category scopes the query by the most common types of filters. The time frame filter must be configured for every search query.
This section has the following filters:
-
From – Set the date and timestamp for the start of the activity range. The drop-down menu opens a calendar.
-
To – Set the date and timestamp for the end of the activity range. The drop-down menu opens a calendar.
-
Source – Filter the data by the source type: All, Admin Audit, Mailbox Access, DLP, Sensitivity Label, Other
NOTE: Disabling a source that is also a category will hide that category from the query options.
-
Agent Hosts – Filter the data for a specific agent
-
Search Limit – Set the maximum number of rows returned in the search results. The default is 10,000 rows.
User Category
The User category scopes the query by the user, or perpetrator of the activity.
This section has the following filters:
- Name or UPN – Filter the data by name or User Principal Name (UPN)
- User Type – Filter the data by the type of user: All, Regular, Reserved, Admin, DcAdmin, System, Application, ServicePrincipal, CustomPolicy, SystemPolicy, Unknown
- IP Address – Filter the data by IP address.
- Client App or Browser – Filter the data by specified client application or browser.
Target Category
The Target category scopes the query by the target of the file.

This section has the following filters:
- Object
- Mailbox
- Accessed Mail
DLP Category
The DLP category scopes the query by the DLP policy.

This section has the following filters:
- Policy Name
File Search Query
You can search Windows file server and NAS device activity that has been monitored and recorded to a File output. When you select File from the magnifying glass drop-down menu, a New Search tab opens with the applicable query filters.

By default, the query is set to return all event activity for the past day. Configuring query filters will scope results returned.
Set the filters as desired and click Search. The application searches through the appropriate activity log files and returns the events that match the filters. You can Filter and Sort the results using the column headers. Below the Search button is the Export option.
Filter Value Entry
Field options vary based on the selected query filter:
-
Textbox – Enter the filter value. If the field has a drop-down arrow, then you can select from values known to the application.
-
Gray drop-down menu – Provides options to match the value against on of the following, which vary based on the filter:
- Selected values – Filters by the value selected from the drop-down menu for the textbox
- Simple string with wildcards – Filters by the value entered into the textbox, which contains an asterisk (*) as the wildcard
- Regular expression – Filters by the Regex entered into the textbox
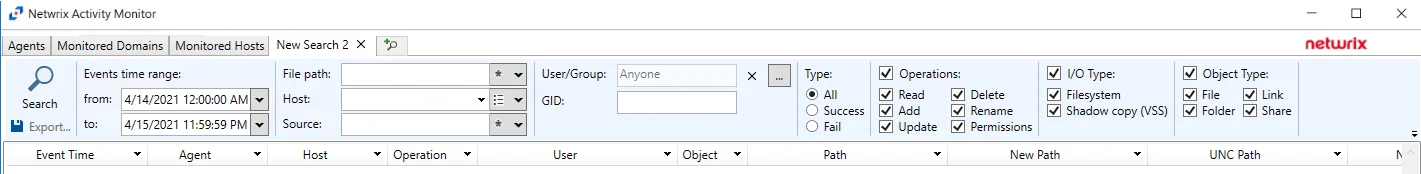
Query Filter Options
The sections have the following filters:
-
Events time range – The time frame filter must be configured for every search query:
- From – Set the date and timestamp for the start of the activity range. The drop-down menu opens a calendar.
- To – Set the date and timestamp for the end of the activity range. The drop-down menu opens a calendar.
-
File Path – Filter the data for a specific file path where activity has occurred
-
Hosts – Filter the data for a specific target host of the event
-
Source – Filter the data for a specific source of the activity:
- For local Windows activity, filter by a process name like notepad.exe
- For network Windows activity, filter by the IP Address of the user
- For NAS device activity, filter by the IP Address for the NAS device of the user
-
User/Group – Filter the data for a specific user, or perpetrator of the event. You can also filter by a group.
- Specify account or group (...) – The ellipsis button beside the User textbox opens the Specify account or group window. Use this window to resolve the account for the user. See the Specify Account or Group Window topic for additional information.
-
GID
-
Types – Filter the data for a specific event result: All, Success, Fail
-
Operations – Filter the data by the type of file operation: Read, Add, Update, Delete, Rename, Permissions. The Operations checkbox at the top acts as select/deselect all option.
-
I/O Type – Filter the data by the type of input/output: Filesystem, Shadow copy (VSS). The I/O Type checkbox at the top acts as select/deselect all option.
-
Object Type – Filter the data by the type of file object: File, Folder, Link, Share. The Object Types checkbox at the top acts as select/deselect all option.
-
Search limit – Set the maximum number of rows returned in the search results. The default is 10,000 rows.
Linux Search Query
You can search Linux file server and NAS device activity that has been monitored and recorded to a File output. When you select Linux from the magnifying glass drop-down menu, a New Search tab opens with the applicable query filters.
By default, the query is set to return all event activity for the past day. Configuring query filters will scope results returned.
Set the filters as desired and click Search. The application searches through the appropriate activity log files and returns the events that match the filters. You can Filter and Sort the results using the column headers. Below the Search button is the Export option.
Filter Value Entry
Field options vary based on the selected query filter:
-
Textbox – Enter the filter value. If the field has a drop-down arrow, then you can select from values known to the application.
-
Gray drop-down menu – Provides options to match the value against on of the following, which vary based on the filter:
- Selected values – Filters by the value selected from the drop-down menu for the textbox
- Simple string with wildcards – Filters by the value entered into the textbox, which contains an asterisk (*) as the wildcard
- Regular expression – Filters by the Regex entered into the textbox
Query Filter Options
The sections have the following filters:
-
Events time range – The time frame filter must be configured for every search query:
- From – Set the date and timestamp for the start of the activity range. The drop-down menu opens a calendar.
- To – Set the date and timestamp for the end of the activity range. The drop-down menu opens a calendar.
-
File Path – Filter the data for a specific file path where activity has occurred
-
Hosts – Filter the data for a specific target host of the event
-
Source – Filter the data for a specific source of the activity
-
User/Group – Filter the data for a specific user, or perpetrator of the event. You can also filter by a group.
- Specify account or group (...) – The ellipsis button beside the User textbox opens the Specify account or group window. Use this window to resolve the account for the user. See the Specify Account or Group Window topic for additional information.
-
GID
-
Types – Filter the data for a specific event result: All, Success, Fail
-
Operations – Filter the data by the type of file operation: Read, Add, Update, Delete, Rename, Permissions. The Operations checkbox at the top acts as select/deselect all option.
-
I/O Type – Filter the data by the type of input/output: Filesystem, Shadow copy (VSS). The I/O Type checkbox at the top acts as select/deselect all option.
-
Object Type – Filter the data by the type of file object: File, Folder, Link, Share. The Object Types checkbox at the top acts as select/deselect all option.
SharePoint Search Query
You can search SharePoint activity that has been monitored and recorded to a File output. When you select SharePoint from the magnifying glass drop-down menu, a New Search tab opens with the applicable query filters.
The filters are separated into the following categories:
- General
- Audit
- Move/Delete/Copy/Checkin
- Delete
- Search
- Permissions
By default, the query is set to return all event activity for the past day. Configuring query filters will scope results returned.
Set the filters as desired and click Search. The application searches through the appropriate activity log files and returns the events that match the filters.You can Filter and Sort the results using the column headers. Below the Search button is the Export option.
Filter Value Entry
When the drop-down menu is in front of a query filter, it is used to show or hide the filter entry field. Field options vary based on the selected query filter:
-
Textbox – Enter the filter value. If the field has a drop-down arrow, then you can select from values known to the application.
-
Gray drop-down menu – Provides options to match the value against on of the following, which vary based on the filter:
- Selected values – Filters by the value selected from the drop-down menu for the textbox
- Simple string with wildcards – Filters by the value entered into the textbox, which contains an asterisk (*) as the wildcard
- Regular expression – Filters by the Regex entered into the textbox
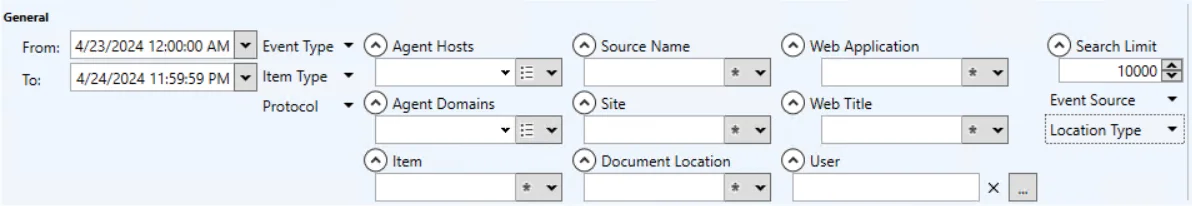
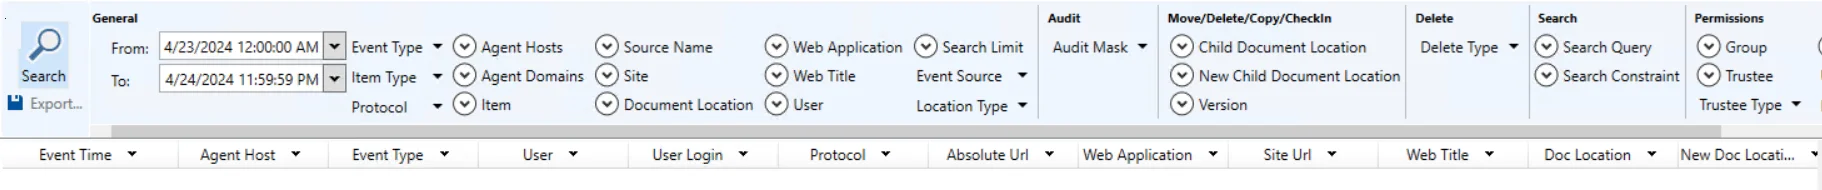
General Category
The General category addresses who, what, where, and when an object, user, host, or domain controller is affected by the events selected in the other categories. The time frame filter must be configured for every search query.
This section has the following filters:
-
From – Set the date and timestamp for the start of the activity range. The drop-down menu opens a calendar.
-
To – Set the date and timestamp for the end of the activity range. The drop-down menu opens a calendar.
-
Event Type – Filter the data by the event type: All, CheckOut, CheckIn, View, Delete, Update, ProfileChange, ChildDelete, SchemaChange, Undelete, Workflow, Copy, Move, AuditMaskChange, Search, ChildMove, FileFragmentWrite, SecGroupCreate, SecGroupDelete, SecGroupMemberAdd, SecGroupMemberDel, SecRoleDefCreate, SecRoleDefDelete, SecRoleDefModify, SecRoleDefBreakInherit, SecRoleBindUpdate, SecRoleBindInherit, SecRoleBindBreakInherit, EventsDeleted, AppPermissionGrant, AppPermissionDelete, Custom
NOTE: Disabling an event type that is also a category will hide that category from the query options.
-
Item Type – Filter the data by the type of SharePoint item: All, Document, ListItem, List, Folder, Web, Site
-
Protocol – Filter the data by the protocol: Any, HTTP, HTTPS
-
Agent Hosts – Filter the data for a specific agent
-
Agent Domains – Filter the data for a specific domain
-
Item
-
Source Name
-
Site – Filter the data for a specific SharePoint site
-
Document Location
-
Web Application – Filter the data for a specific SharePoint web application
-
Web Title
-
User – Filter the data for a specific user, or perpetrator of the event
- Specify account or group (...) – The ellipsis button beside the User textbox opens the Specify account or group window. Use this window to resolve the account for the user. See the Specify Account or Group Window topic for additional information.
-
Search Limit – Set the maximum number of rows returned in the search results. The default is 10,000 rows.
-
Event Source – Filter the data by the source: Any, SharePoint, ObjectModel
-
Location Type – Filter the data by the type of location: Any, Url, ClientLocation
Audit Category
The Audit category scopes the query by audit mask activity.

This section has the following filters:
- Audit Mask – Filter the data by the audit mask type: All, None, CheckOut, CheckIn, View, Delete, Update, ProfileChange, ChildDelete, SchemaChange, SecurityChange, Undelete, Workflow, Copy, Move, Search
Move/Delete/Copy/Checkin Category
The Move/Delete/Copy/Checkin category scopes the query by file move and version activity.

This section has the following filters:
- Child Document Location
- New Child Document Location
- Version
Delete Category
The Delete category scopes the query by type of delete activity.

This section has the following filters:
- Delete Type – Filter the data by the type of deletion: Any, MovedToRecycle, DeletedCompletely
Search Category
The Search category scopes the query by search activity.

This section has the following filters:
- Search Query
- Search Constraint
Permissions Category
The Permissions category scopes the query by permission change activity.

This section has the following filters:
- Group
- Trustee
- Trustee Type – Filter the data by the type of trustee: Any, Group, User
- Role
- Update Type – Filter the data by the type of update: All, Added, Removed, Updated
- Permission – Filter the data by the permission: All, EmptyMask, ViewListItems, AddListItems, EditListItems, DeleteListItems, CancelCheckout, ManagePersonalViews, ManageLists, AnonymousSearchAccessList, AnonymousSearchAccessWebLists, Open, ViewFormPages, ViewPages, AddAndCustomizePages, ApplyThemeAndBorder, ApplyStyleSheets, ViewUsageData, CreateSSCSite, ManageSubwebs, ManagePermissions, BrowseDirectories, BrowseUserInfo, AddDelPrivateWebParts, UpdatePersonalWebParts, ManageWeb, FullMask, UseClientIntegration, UseRemoteAPIs, ManageAlerts, CreateAlerts, EditMyUserInfo, EnumeratePermissions, ApproveItems, OpenItems, ViewVersions, DeleteVersions, CreateGroups
SharePoint Online Search Query
You can search SharePoint Online activity that has been monitored and recorded to a File output. When you select SharePoint Online from the magnifying glass drop-down menu, a New Search tab opens with the applicable query filters.
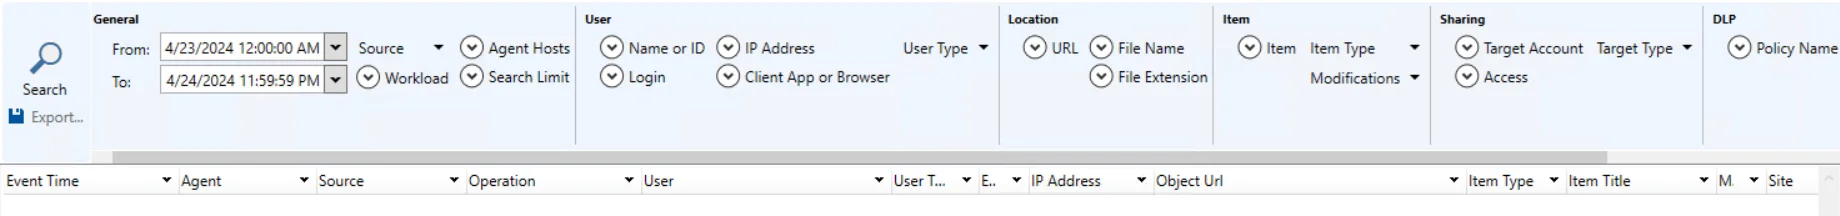
The filters are separated into the following categories:
- General
- User
- Location
- Item
- Sharing
- DLP
- Custom
By default, the query is set to return all event activity for the past day. Configuring query filters will scope results returned.
Set the filters as desired and click Search. The application searches through the appropriate activity log files and returns the events that match the filters. You can Filter and Sort the results using the column headers. Below the Search button is the Export option.
Filter Value Entry
When the drop-down menu is in front of a query filter, it is used to show or hide the filter entry field. Field options vary based on the selected query filter:
-
Textbox – Enter the filter value. If the field has a drop-down arrow, then you can select from values known to the application.
-
Gray drop-down menu – Provides options to match the value against on of the following, which vary based on the filter:
- Selected values – Filters by the value selected from the drop-down menu for the textbox
- Simple string with wildcards – Filters by the value entered into the textbox, which contains an asterisk (*) as the wildcard
- Regular expression – Filters by the Regex entered into the textbox
General Category
The General category scopes the query by the most common types of filters. The time frame filter must be configured for every search query.
This section has the following filters:
-
From – Set the date and timestamp for the start of the activity range. The drop-down menu opens a calendar.
-
To – Set the date and timestamp for the end of the activity range. The drop-down menu opens a calendar.
-
Source – Filter the data by the source type: All, File and Page, Folder, List, Sharing and Access Request, Site Permissions, Site Administration, Synchronization, DLP, Sensitivity Label, Content Explorer, Other
NOTE: Disabling a source that is also a category will hide that category from the query options.
-
Workload
-
Agent Hosts – Filter the data for a specific agent
-
Search Limit – Set the maximum number of rows returned in the search results. The default is 10,000 rows.
User Category
The User category scopes the query by the user, or perpetrator of the activity.
This section has the following filters:
- Name or ID
- Login
- IP Address
- Client App or Browser
- User Type – Filter the data by the type of user: All, Regular, Reserved, Admin, DcAdmin, System, Application, ServicePrincipal, CustomPolicy, SystemPolicy, Unknown
Location Category
The Location category scopes the query by the location of the file.

This section has the following filters:
- URL
- File Name
- File Extension
Item Category
The Item category scopes the query by the item.

This section has the following filters:
- Item
- Item Type – Filter the data by the type of item: All, Unknown, File, Folder, Web, Site, Tenant, DocumentLibrary, Page
- Modifications – Filter the data by the type of item: All, No Changes, Has attribute changes
Sharing Category
The Sharing category scopes the query by the type of sharing.

This section has the following filters:
- Target Account
- Access
- Target Type – Filter the data by the type of target: All, Member, Guest, SharePointGroup, SecurityGroup, Partner, Unknown
DLP Category
The DLP category scopes the query by the DLP policy.
This section has the following filters:
- Policy Name
Custom Category
The Custom category scopes the query by custom event activity.

This section has the following filters:
- Event Data
- Custom Event
SQL Server Search Query
You can search SQL Server activity that has been monitored and recorded to a File output. When you select SQL Server from the magnifying glass drop-down menu, a New Search tab opens with the applicable query filters.

The filters are separated into the following categories:
- General
- User
- SQL
By default, the query is set to return all event activity for the past day. Configuring query filters will scope results returned.
Set the filters as desired and click Search. The application searches through the appropriate activity log files and returns the events that match the filters. You can Filter and Sort the results using the column headers. Below the Search button is the Export option.
Filter Value Entry
When the drop-down menu is in front of a query filter, it is used to show or hide the filter entry field. Field options vary based on the selected query filter:
-
Textbox – Enter the filter value. If the field has a drop-down arrow, then you can select from values known to the application.
-
Gray drop-down menu – Provides options to match the value against on of the following, which vary based on the filter:
- Selected values – Filters by the value selected from the drop-down menu for the textbox
- Simple string with wildcards – Filters by the value entered into the textbox, which contains an asterisk (*) as the wildcard
- Regular expression – Filters by the Regex entered into the textbox
General Category
The General category scopes the query by the most common types of filters. The time frame filter must be configured for every search query.
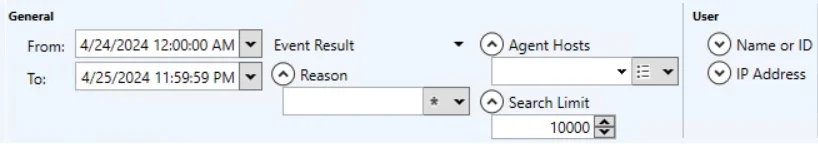
This section has the following filters:
- From – Set the date and timestamp for the start of the activity range. The drop-down menu opens a calendar.
- To – Set the date and timestamp for the end of the activity range. The drop-down menu opens a calendar.
- Event Result – Filter the data for a specific event result: Any, Success, or Failure
- Reason
- Agent Hosts – Filter the data for a specific agent
- Search Limit – Set the maximum number of rows returned in the search results. The default is 10,000 rows.
User Category
The User category scopes the query by the user, or perpetrator of the activity.

This section has the following filters:
- Name or ID
- IP Address
SQL Category
The SQL category scopes the query by SQL Server activity.

This section has the following filters:
- Server name
- Database
- Operation – Filter the data by the type of Operation: All, Select, Insert, Update, Delete, merge, Execute, Login, Logout, Grant, Revoke, Deny, Error, AlterRole
- Application
- Object
- SQL Text
Active Directory Search Results
When a search has been started, the Search Status table at the bottom displays the percentage complete according to the size and quantity of the activity log files being searched per AD agent. You can Filter and Sort the results using the column headers. Below the Search button is the Export option.
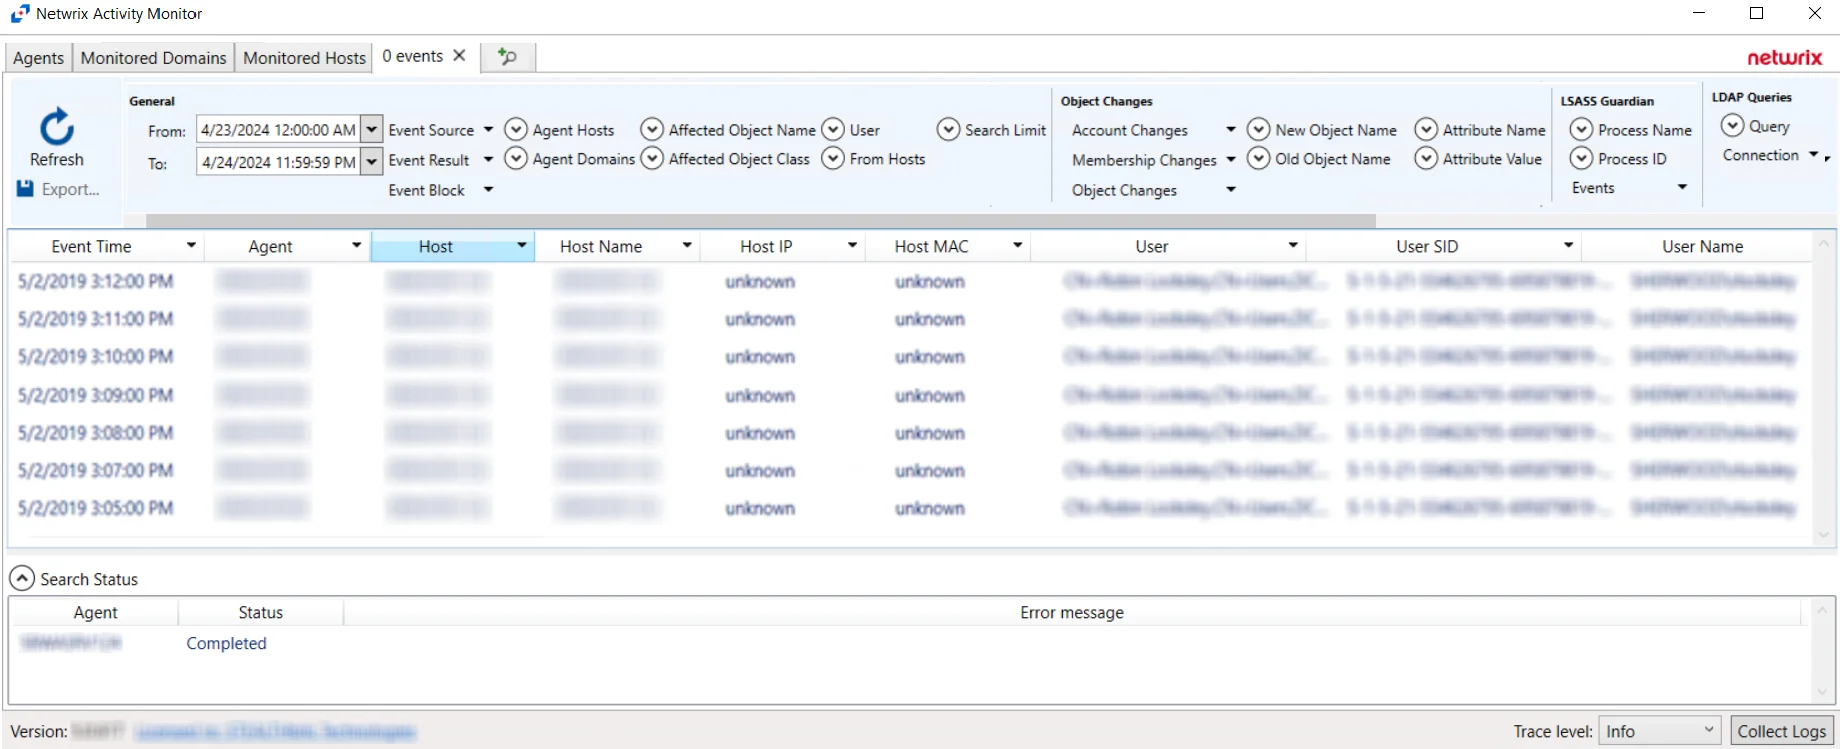
The results data grid columns display the following information for each event:
- Event Time – Date timestamp of the event
- Agent – Server where the Agent is deployed
- Host – Target host where the event was recorded
- Host Name – Name of the target host
- Host IP – IP address of the target host
- Host MAC – Network adapter identifier
- User – Security principal of the account that triggered the event
- User SID – Security Identifier of the account used in the event
- User Name – Name for the security principal that triggered the event
- User Class – Active Directory class of the affected object
- Blocked – Indicates the Agent blocked the event from occurring
- Success – Indicates the event completed successfully
- Event Source – Location of Monitored host where event occurred
- Event Type – Indicates the type of event
- Affected Object – Active Directory distinguished name for the affected object
- Affected Object SID – Security Identifier of the object/account affected by the event
- Affected Object Name – Name of the Affected Object
- Protocol – Protocol(s) used for the monitored operation
- Query Filter – LDAP filter used in the operation
- Secured Query – Indicates if LDAP connection is secured or not
- Query Objects – Number of returned objects produced by the LDAP request
- Process Name – Contains process name that is monitored. Currently this is only lsass.exe.
- PID – Process Identifier generated for each active process
- Old Name – Value prior to the monitored change
- New Name – Value after the monitored change
- Authentication Type – Indicates type of authentication event. Possible values: Kerberos, NTLM.
- Target Host – Name of the originating host
- Target IP – IP address of the originating host
- Authentication Protocol – Indicates authentication protocol. Possible values: Unknown, Kerberos, KerberosTgs, KerberosAs, NTLM, NTLMv1, NTLMMixed, NTLMv2.
- NTLM Logon Type – Indicates type of protocol used to authenticate a connection between client and server
- Ticket Encryption – Indicates encryption type used in request part of the Kerberos ticket
- PAC – RID for the group that does not have access
- SPN – Detects attempts to obtain a list of Service Principal Name values
- User Exists – Indicates if user exists
- N2 Password – Indicates if an invalid password matches the user’s password history
At the bottom of the search interface, additional information is displayed for selected events in the data grid. The Attribute Name, Operation, Old Value, and New Value for the logged event (as applicable to the event) are displayed.
Microsoft Entra ID Search Results
When a search has been started, the Search Status table at the bottom displays the percentage complete according to the size and quantity of the activity log files being searched per activity agent. You can Filter and Sort the results using the column headers. Below the Search button is the Export option.
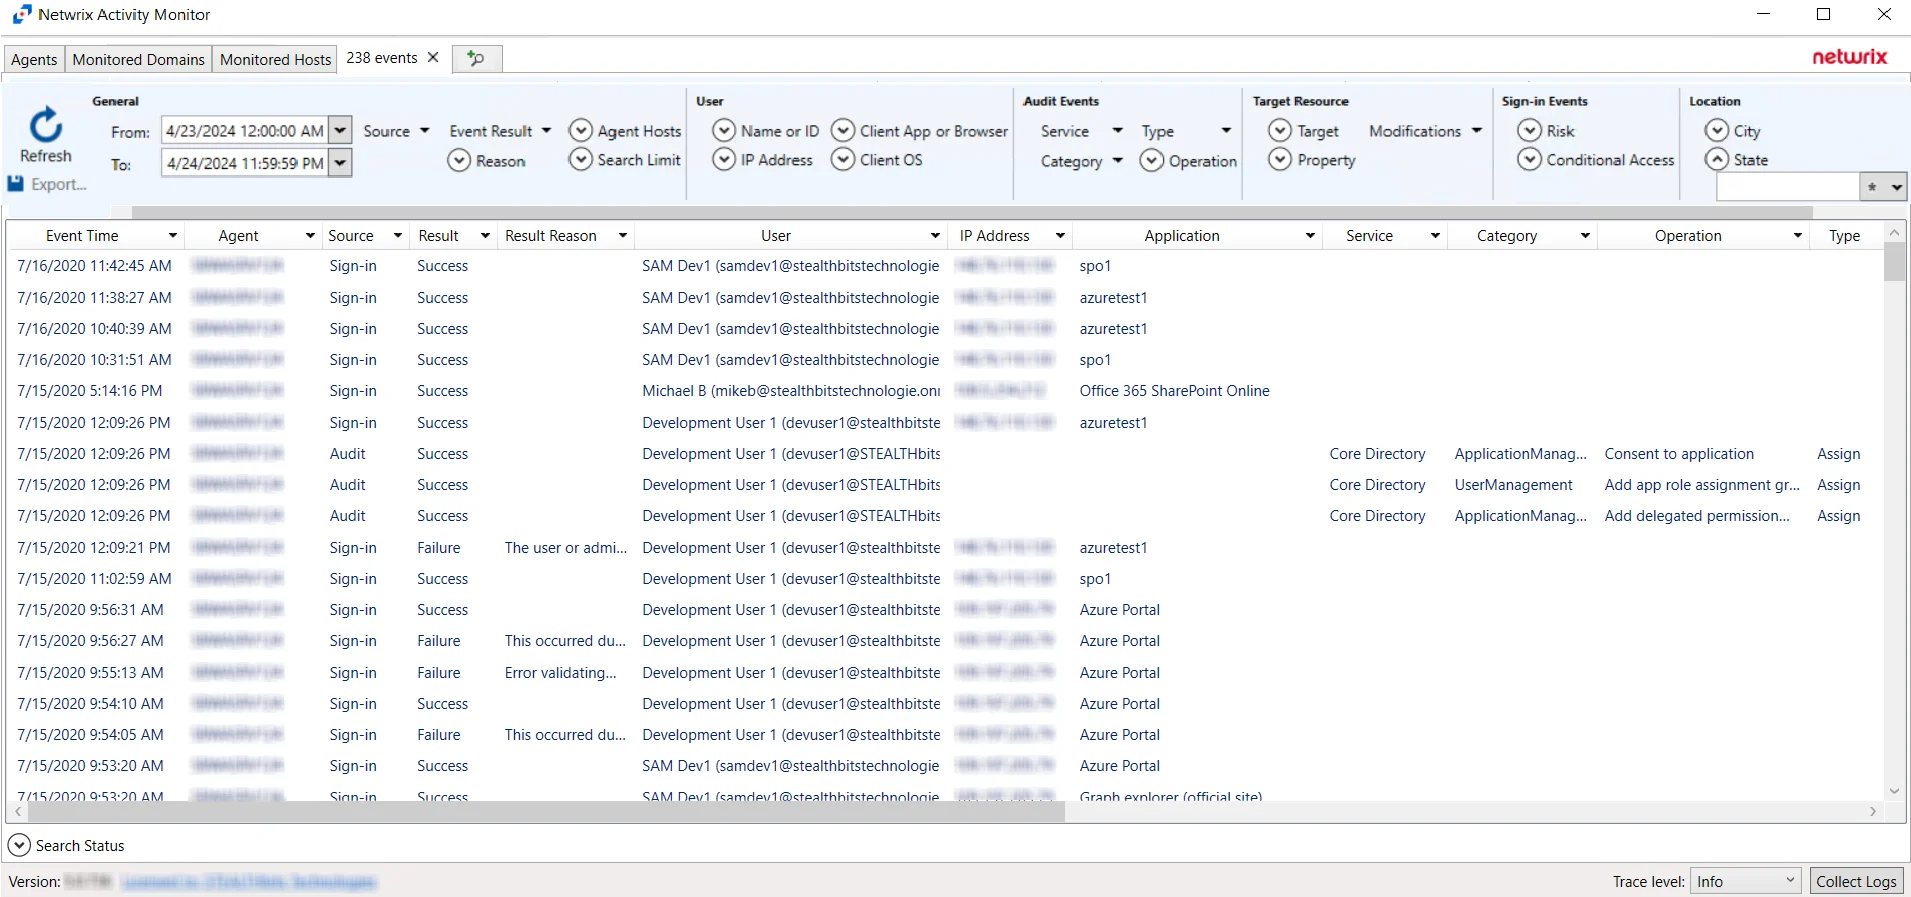
The results data grid columns display the following information for each event:
- Event Time – Date timestamp of the event
- Agent – Agent which monitored the event
- Source – Indicates the source of the activity event
- Result – Indicates whether the event resulted in a Success or Failure
- Result Reason – If an event resulted in a Failure, the reason for it will be listed in the Result Reason column
- User – Indicates user account associated with the event
- IP Address – Indicates the IP Address associated with the event
- Application – Indicates the Application associated with the event
- Service – Indicates the Service associated with the event
- Category – Indicates the Category associated with the event. Categories returned from search queries can be configured using the Category filter drop-down.
- Operation - Indicates the Operation associated with the event. Operations returned from search queries can be configured using the Operation filter drop-down.
- Type – Indicates the Type associated with the event. Types returned from search queries can be configured using the Type filter drop-down.
- Target(s) – Indicates the Target(s) of the event
- Modified – Indicates modifications associated with the event
- Client App – Indicates the Client App associated with the event
- OS – Indicates the OS associated with the event
- Browser – Indicates the browser associated with the event
- City – Indicates the City associated with the event
- State – Indicates the State associated with the event
- Country – Indicates the Country associated with the event
- Coordinates – Indicates the Coordinates associated with the event
- Interactive – Indicates whether the event was an Interactive event
- Risk – Indicates the level of Risk associated with events
- Conditional Access – Indicates whether Conditional Access was applied to the event
- Conditional Policy – Indicates whether a Conditional Policy was applied to the event
- Details – If applicable, provides additional information associated with the event that is not provided by the other Results columns
At the bottom of the search interface, additional information is displayed for selected events in the data grid. The Attribute Name, Operation, Old Value, and New Value for the logged event (as applicable to the event) are displayed.
Exchange Online Search Results
When a search has been started, the Search Status table at the bottom displays the percentage complete according to the size and quantity of the activity log files being searched per activity agent. You can Filter and Sort the results using the column headers. Below the Search button is the Export option.
The results data grid columns display the following information for each event:
- Event Time – Date timestamp of the event
- Agent – Agent which monitored the event
- Source – Indicates the source of the activity event
- Operation - Operation associated with event
- User – Indicates user account associated with the event
- User Type - Type of user associated with event
- External – Indicates whether external sharing is associated with the event
- IP Address – Indicates the IP Address associated with the event
- Object - Object associated with event
- Mailbox - The mailbox associated with the event
- Modified - Indicates whether a modification is associated with the event
- DLP Policy - If applicable, indicates the DLP Policy associated with the event
At the bottom of the search interface, additional information is displayed for selected events in the data grid. The Attribute Name, Operation, Old Value, and New Value for the logged event (as applicable to the event) are displayed.
File Search Results
When a search has been started, the Search Status table at the bottom displays the percentage complete according to the size and quantity of the activity log files being searched per activity agent. You can Filter and Sort the results using the column headers. Below the Search button is the Export option.
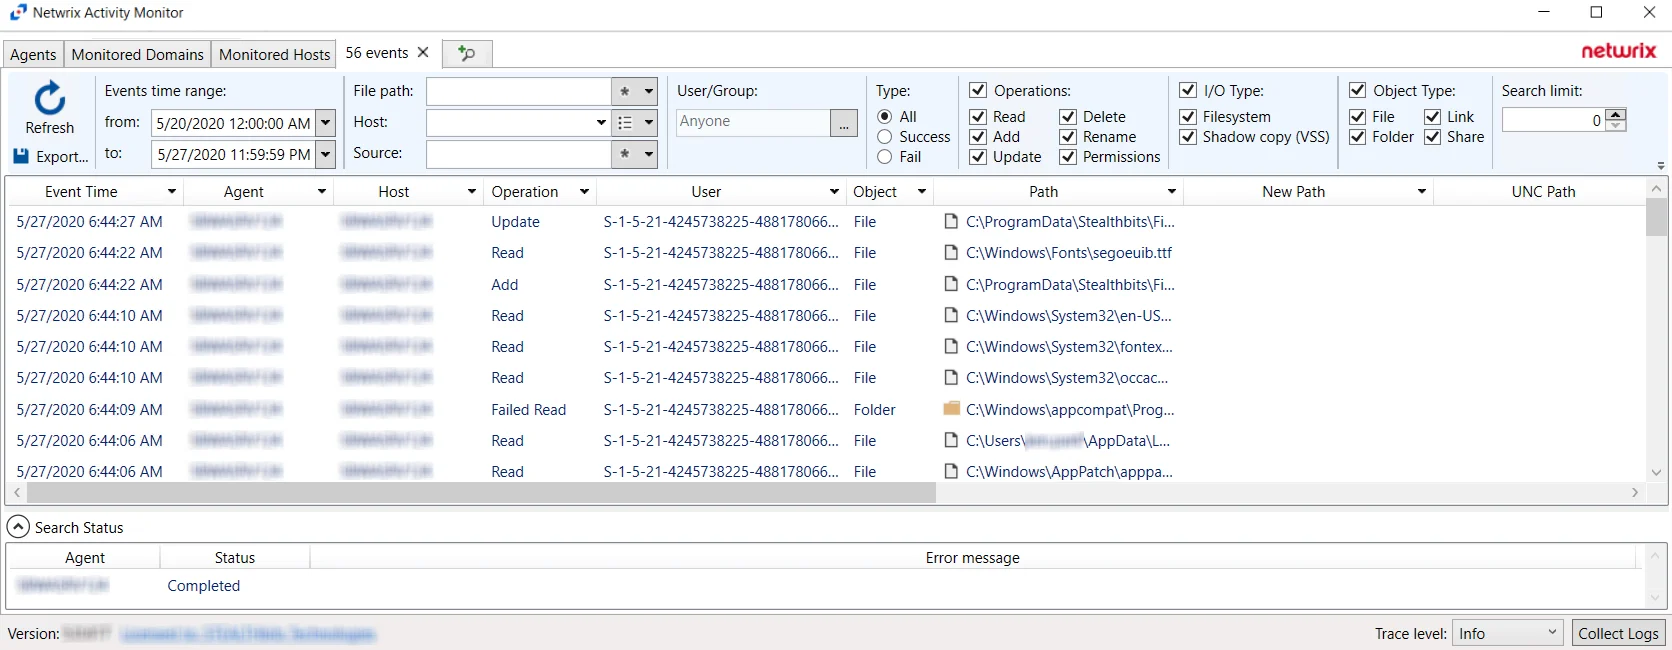
The results data grid columns display the following information for each event:
-
Event Time – Date timestamp of the event
-
Agent – Agent which monitored the event
-
Host – Monitored host where the event occurred
-
Operation – Type of the activity event which was monitored
-
User – User account that performed the activity event
-
Object – Type of object the activity event occurred upon:
- File
- Folder
- Unknown
-
Path – Path where the operation occurred
-
New Path – For rename operation events only, the path’s new location/name
-
UNC Path – UNC path employed by a remote user to access the share, folder, and/or file
-
New UNC Path – For rename operation events only, the UNC path’s new location/name employed by a remote user
-
Source – Indicates the source of the activity event
- For local Windows activity – Process name (e.g. notepad.exe)
- For network Windows activity – IP Address of the user
- For NAS device activity – IP Address for the NAS device of the user
-
Share Name – Name of share where the activity event occurred. This includes NFS.
-
I/O Type – Displays the input/output type
-
Protocol – Communication protocol used to access the share, folder, and/or file:
- CIFS
- NFS
- VSS
- HTTP
-
Protocol Version – Displays the Protocol Version for NetApp Data ONTAP Cluster-Mode device. This field is empty for all other servers/devices.
-
File Size — Displays the file size
-
Tags — (Windows Only) Operation tags. Reports 'Copy' for events that are probably copies.
-
Group — Displays the Group Name or ID (GID)
At the bottom of the search interface, additional information is displayed for selected events in the data grid. The Attribute Name, Operation, Old Value, and New Value for the logged event (as applicable to the event) are displayed.
Permissions Changes
When the results data grid displays information about permissions changes, additional information is made available.
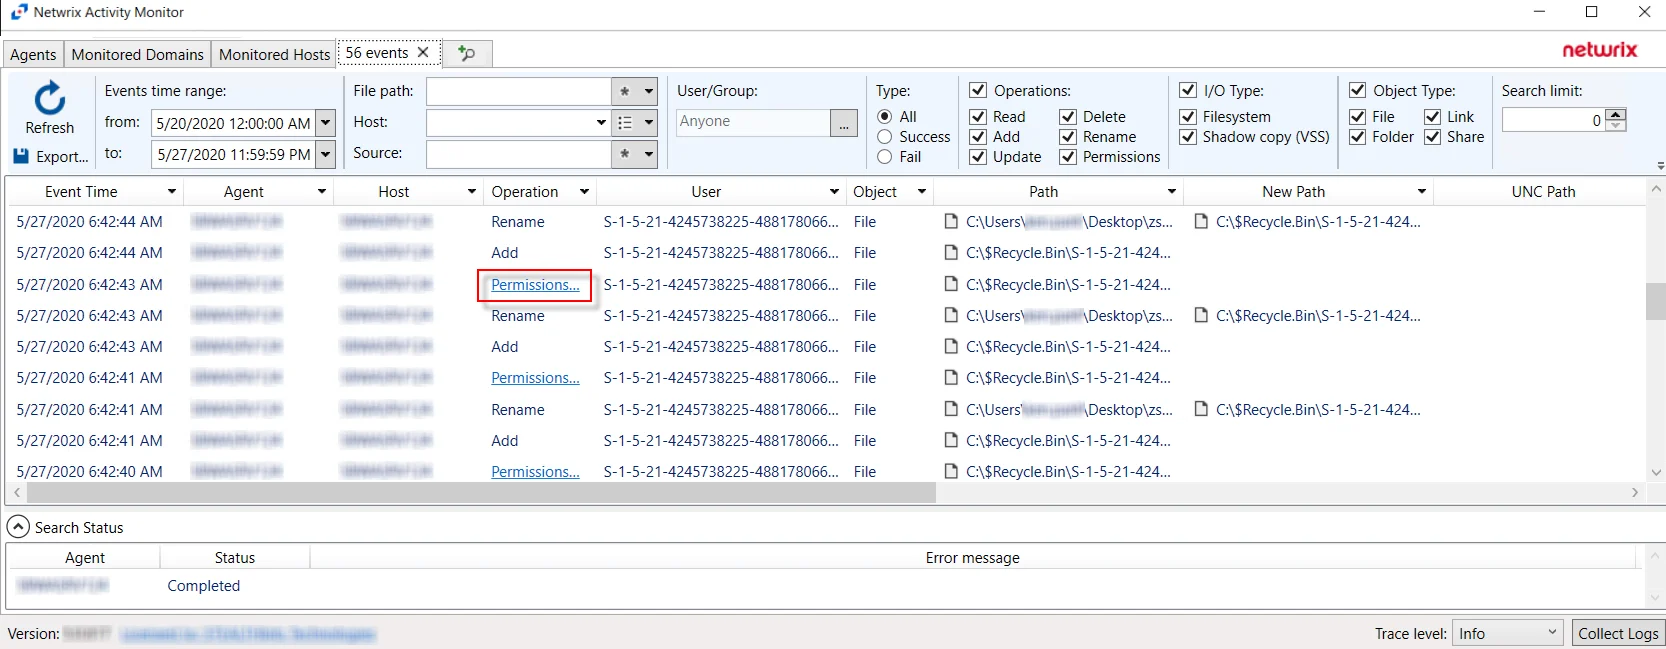
A link displays in the Operation column of the results data grid. Click the Permissions Change link to open the Permissions Change Details window.
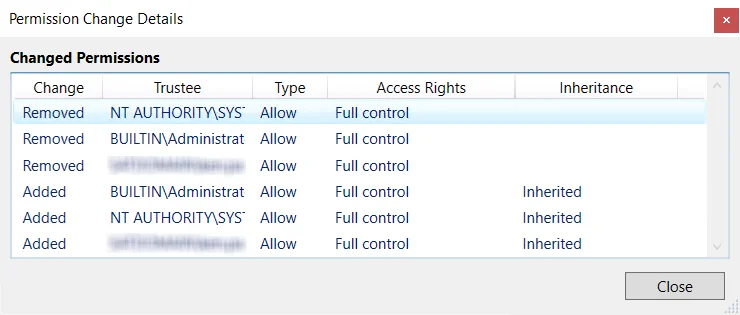
The window displays details about the changes of the security descriptor with information from the new line added to a DACL:
- Change – Type of change which occurred (Added, Removed, etc.)
- Trustee – SAM account name of the affected object
- Type – Type of permission applied (Allow/Deny)
- Access Rights – Rights associated with the type of permission change
- Inheritance – Indicates how the permission change is inherited
Linux Search Results
When a search has been started, the Search Status table at the bottom displays the percentage complete according to the size and quantity of the activity log files being searched per Linux agent. You can Filter and Sort the results using the column headers. Below the Search button is the Export option.
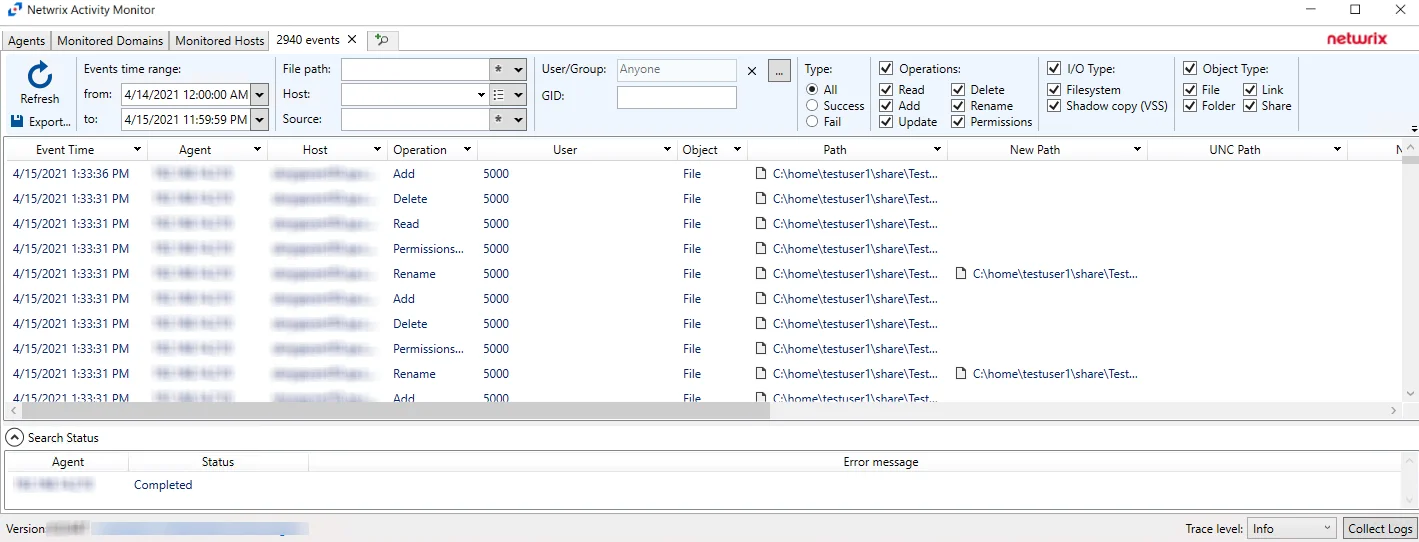
The results data grid columns display the following information for each event:
-
Event Time – Date timestamp of the event
-
Agent – Agent which monitored the event
-
Host – Monitored host where the event occurred
-
Operation – Type of the activity event which was monitored
-
User – User account that performed the activity event
-
Object – Type of object the activity event occurred upon:
- File
- Folder
- Unknown
-
Path – Path where the operation occurred
-
New Path – For rename operation events only, the path’s new location/name
-
UNC Path – UNC path employed by a remote user to access the share, folder, and/or file
-
New UNC Path – For rename operation events only, the UNC path’s new location/name employed by a remote user
-
Source – Indicates the source of the activity event
-
Share Name – Name of share where the activity event occurred. This includes NFS.
-
I/O Type – Displays the input/output type
-
Protocol — Will be LOCAL for Linux Activity
-
Protocol Version — This field is empty for Linux Activity
-
GID — Group ID associated with event
At the bottom of the search interface, additional information is displayed for selected events in the data grid. The Attribute Name, Operation, Old Value, and New Value for the logged event (as applicable to the event) are displayed.
SharePoint Search Results
When a search has been started, the Search Status table at the bottom displays the percentage complete according to the size and quantity of the activity log files being searched per activity agent. You can Filter and Sort the results using the column headers. Below the Search button is the Export option.
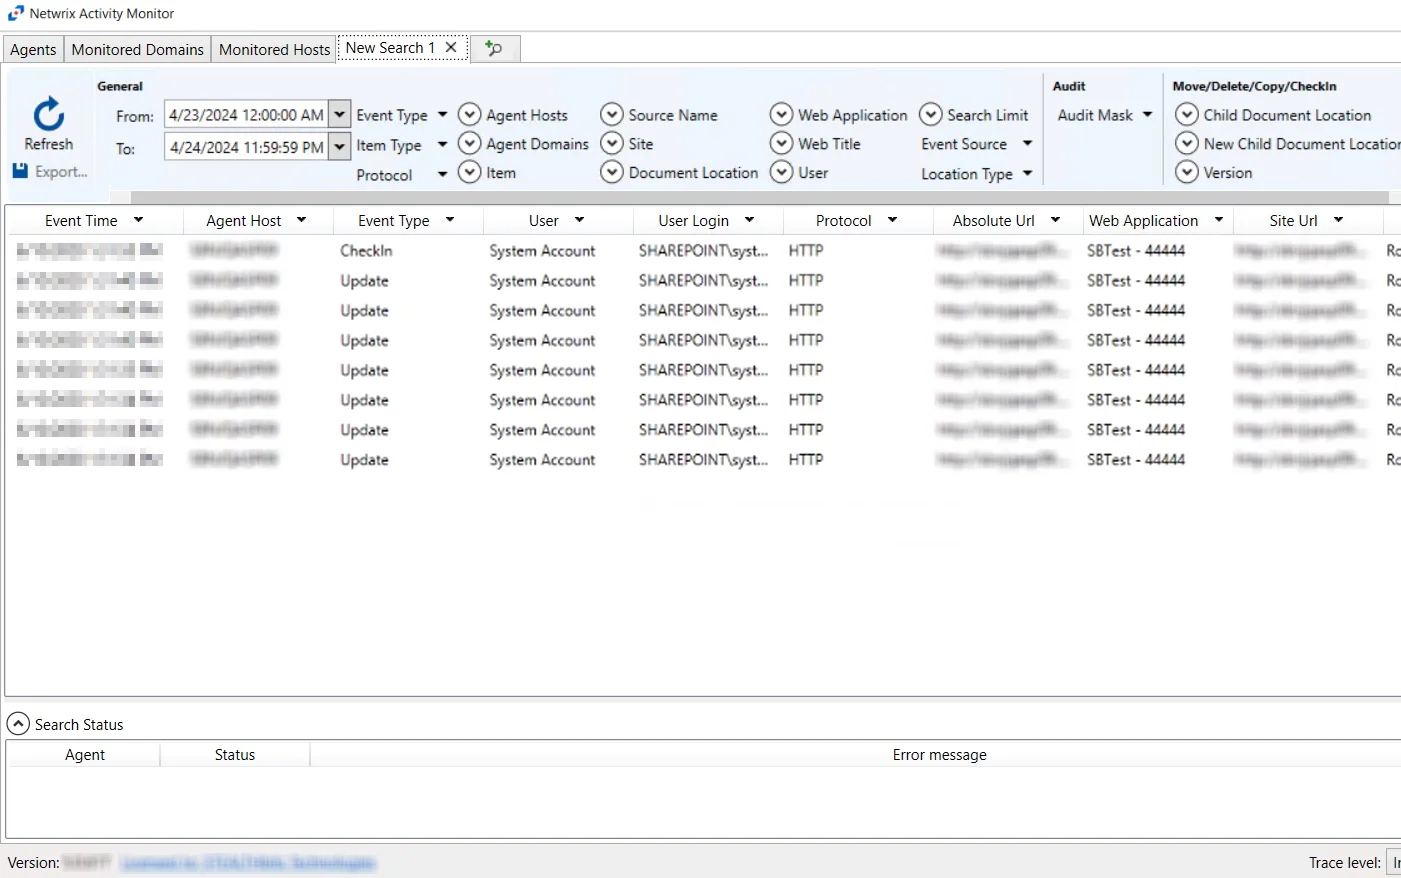
The results data grid columns display the following information for each event:
- Event Time – Date timestamp of the event
- Agent Host – Agent used to collect event information
- Event Type – Indicates the type of event
- User – User account that performed the activity event
- User Login – User login associated with the event
- Protocol – Protocol used for the monitored operation
- Absolute URL - Indicates the Absolute URL associated with the event
- Web Application – Indicates the web application associated with the event
- Site URL – Site URL associated with the event
- Web Title - If applicable, indicates the Web Title associated with the event
- Doc Location – If applicable, indicates the location of the document associated with the event
- New Doc Location – If applicable, indicates the new location of the document associated with the event
At the bottom of the search interface, additional information is displayed for selected events in the data grid. The Attribute Name, Operation, Old Value, and New Value for the logged event (as applicable to the event) are displayed.
SharePoint Online Search Results
When a search has been started, the Search Status table at the bottom displays the percentage complete according to the size and quantity of the activity log files being searched per activity agent. You can Filter and Sort the results using the column headers. Below the Search button is the Export option.
The results data grid columns display the following information for each event:
- Event Time – Date timestamp of the event
- Agent – Agent which monitored the event
- Source – Indicates the source of the activity event
- Operation - Operation associated with event
- User – User account that performed the activity event
- User Type - Type of user associated with event
- External – Indicates whether external sharing is associated with the event
- IP Address - IP Address associated with event
- Object Url - Object Url associated with event
- Item Type - The type of the item associated with the event
- Item Title - The title of the item associated with the event
- Modified - Indicates whether a modification is associated with the event
- Site - Site where the event occurred
- List - Indicates which list the event is associated with
- Relative URL - Indicates the Relative URL associated with the event
- File Name - The name of the file associated with the event
- Extension - If applicable, indicates the extension of the file associated with the event
- New Relative URL - If applicable, indicates the new relative URL of the file associated with the event
- New File Name - If applicable, indicates the new name for the file associated with the event
- New Extension - If applicable, indicates the new extension of the file associated with the event
- Workload - Workload associated with the event
- Access - If applicable, indicates what level of access is associated with the event
- Target Account - If applicable, indicates the recipient of the event
- Target Type - If applicable, indicates the type of account of the recipient of the event
- DLP Policy - If applicable, indicates the DLP Policy associated with the event
- Event Data – Data associated with the event
- Custom Event - If the Custom Event filter was configured in the Query bar, it will appear here
At the bottom of the search interface, additional information is displayed for selected events in the data grid. The Attribute Name, Operation, Old Value, and New Value for the logged event (as applicable to the event) are displayed.
SQL Server Search Results
When a search has been started, the Search Status table at the bottom displays the percentage complete according to the size and quantity of the activity log files being searched per activity agent. You can Filter and Sort the results using the column headers. Below the Search button is the Export option.
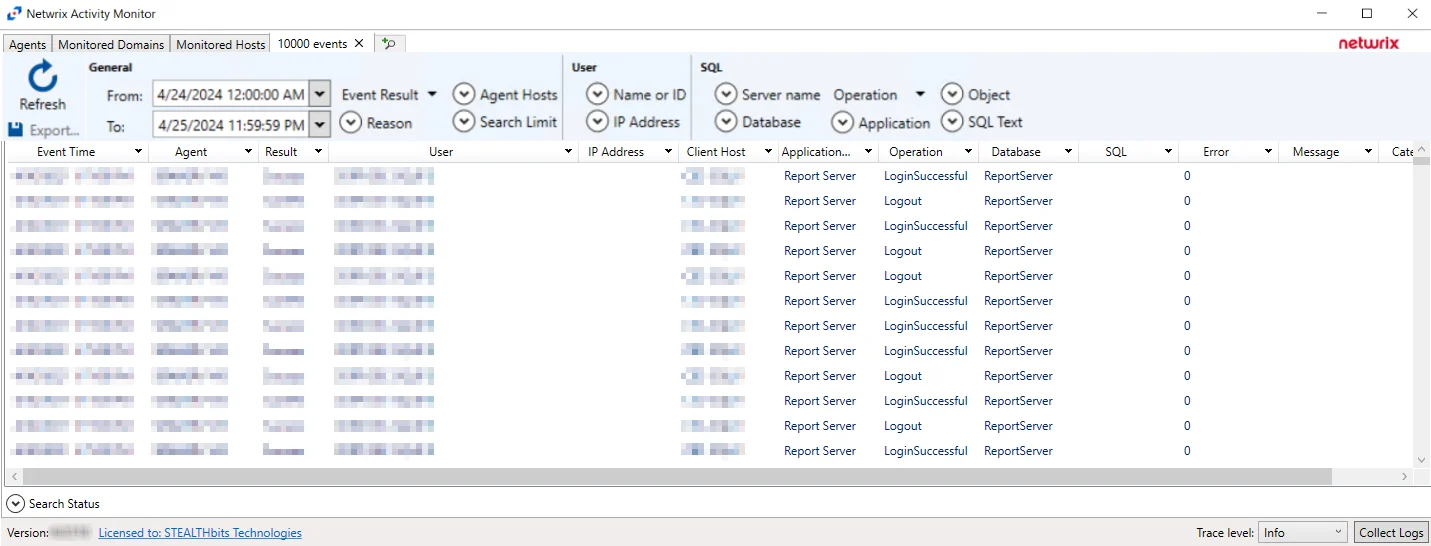
The results data grid columns display the following information for each event:
- Event Time – Date timestamp of the event
- Agent – Agent which monitored the event
- Result – Indicates whether the event type was a success
- User – User account that performed the activity event
- IP Address – IP Address of the client host associated with the event
- Client Host – Name of the client host associated with the event
- Application Name – Name of the application associated with the event
- Operation – The type of operation associated with the event
- Database – The type of database associated with the event
- SQL – The SQL Server Query text associated with the event
- Error – Indicates SQL Server Error Code associated with the event
- Message – Description of the error associated with the event
- Category – Category of the error associated with the event
At the bottom of the search interface, additional information is displayed for selected events in the data grid. The Attribute Name, Operation, Old Value, and New Value for the logged event (as applicable to the event) are displayed.