Monitored Hosts Tab
Understanding Monitored Hosts
There are many types of hosts or platforms that can be monitored using the Activity Agent or Linux Agent:
- Windows
- Dell Celerra or VNX
- Dell Isilon/PowerScale
- Dell PowerStore
- Dell Unity
- Hitachi
- Linux – Configuration of a Linux host is done during agent deployment. See the Linux Agent Deployment topic for additional information.
- Nasuni
- NetApp
- Nutanix
- Panzura
- Qumulo
- Microsoft Entra ID (formerly Azure AD)
- SharePoint
- SharePoint Online
- Exchange Online
- SQL Server
See the Add New Host Window topic for additional information.
Agents
An agent must be deployed to the server to be monitored for:
- Linux
- SharePoint
- Windows
For all other hosts, the agent is deployed to a Windows proxy server.
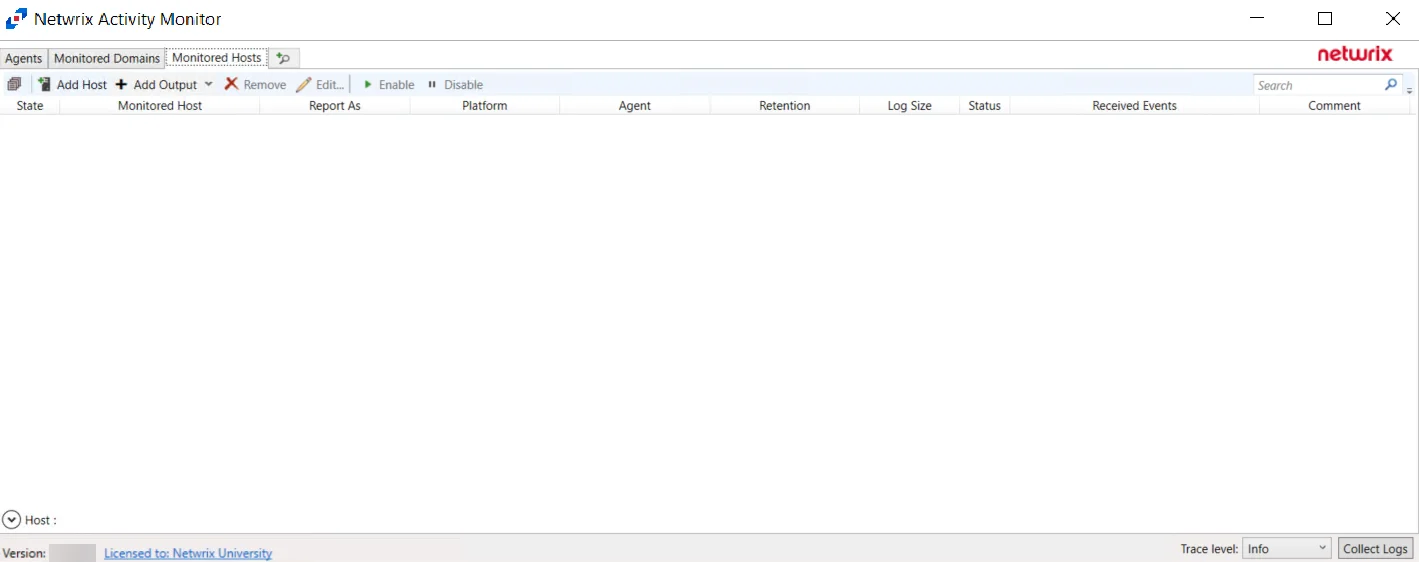
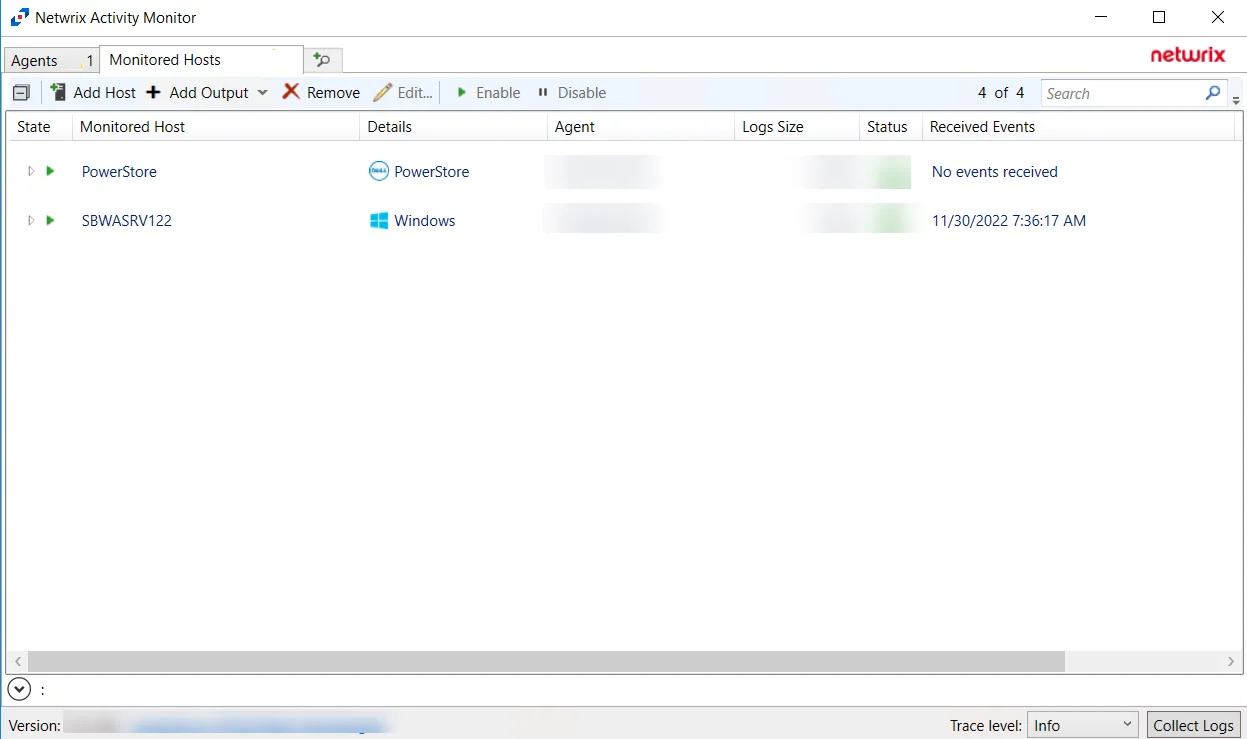
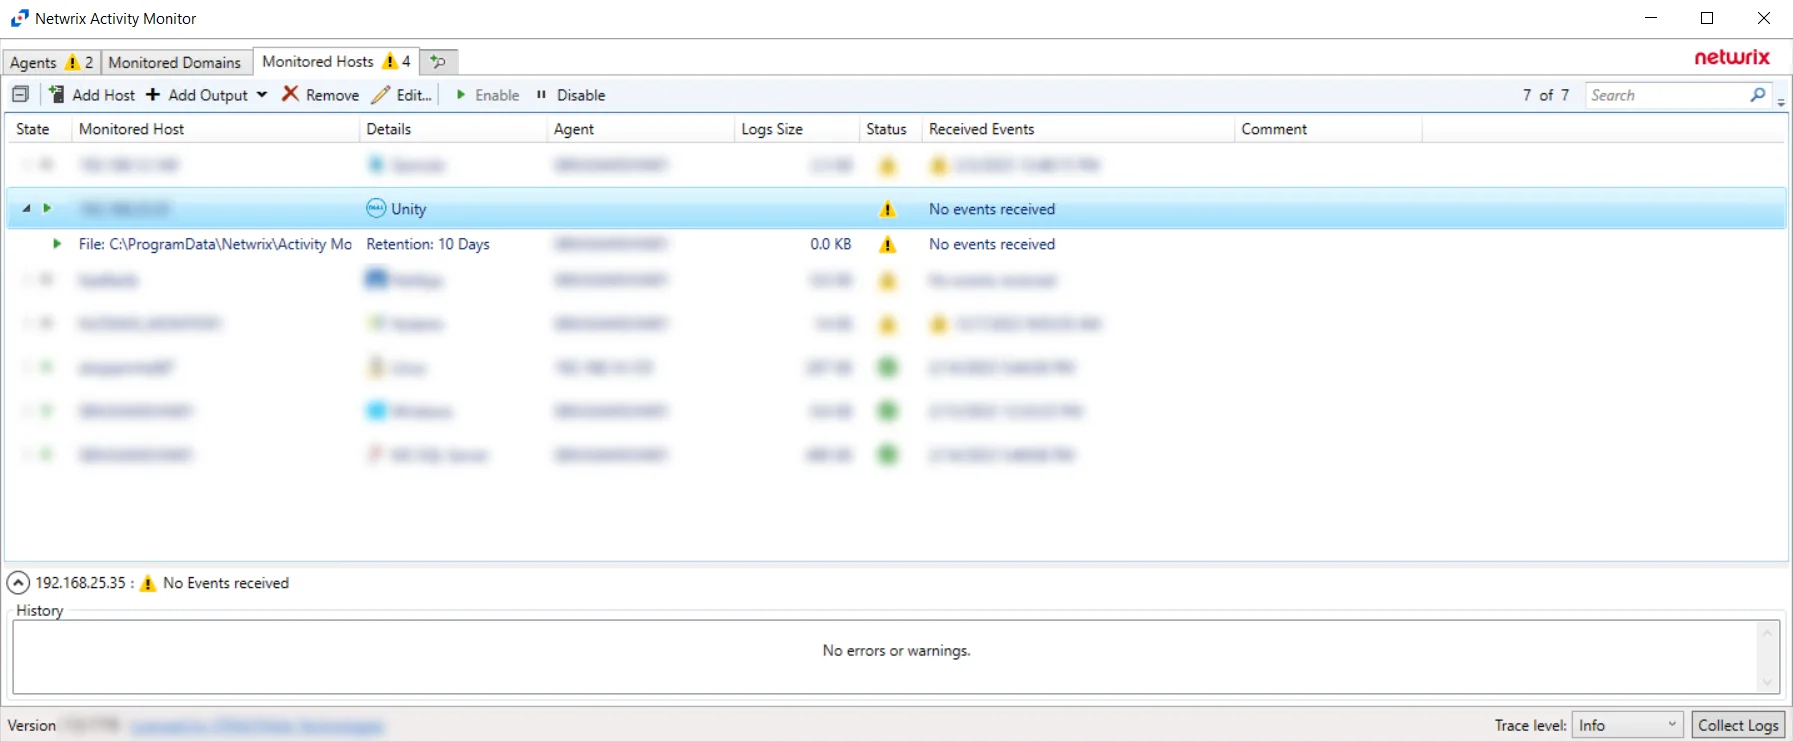
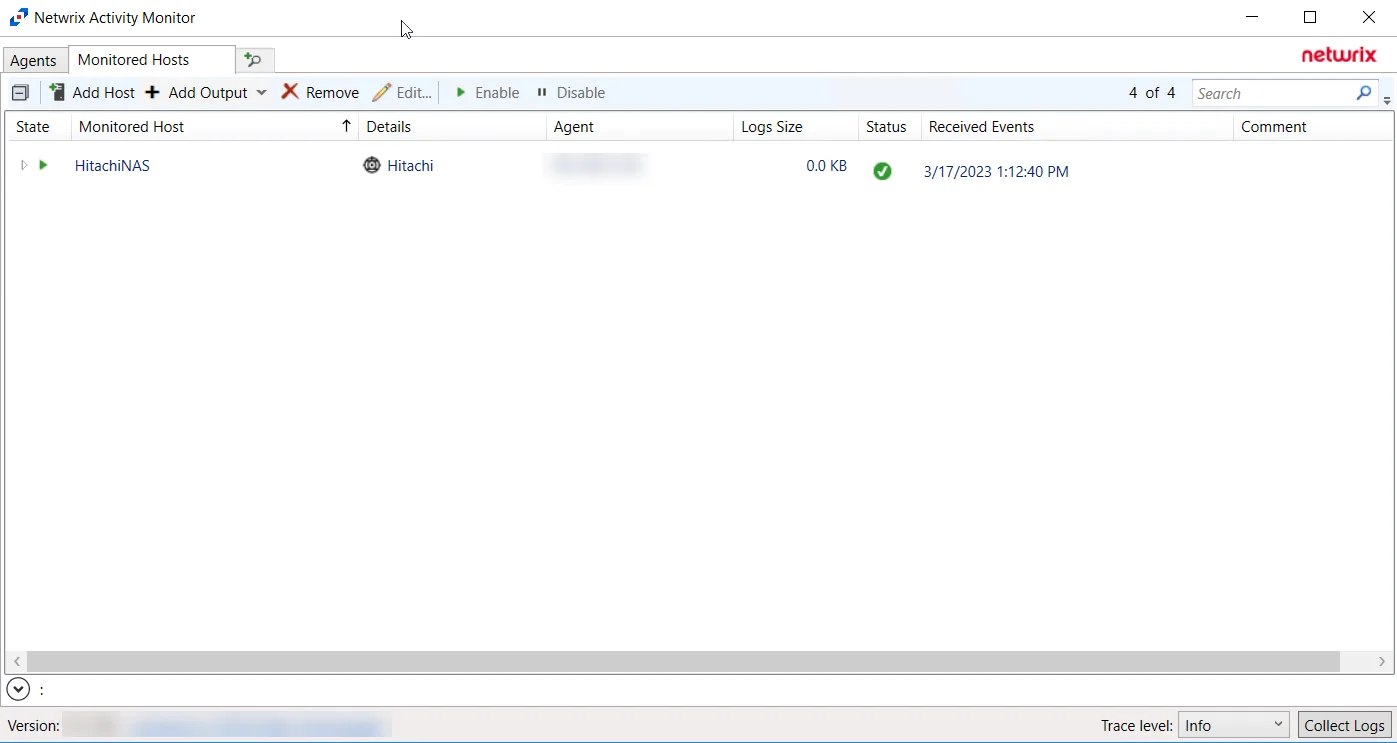
Tab
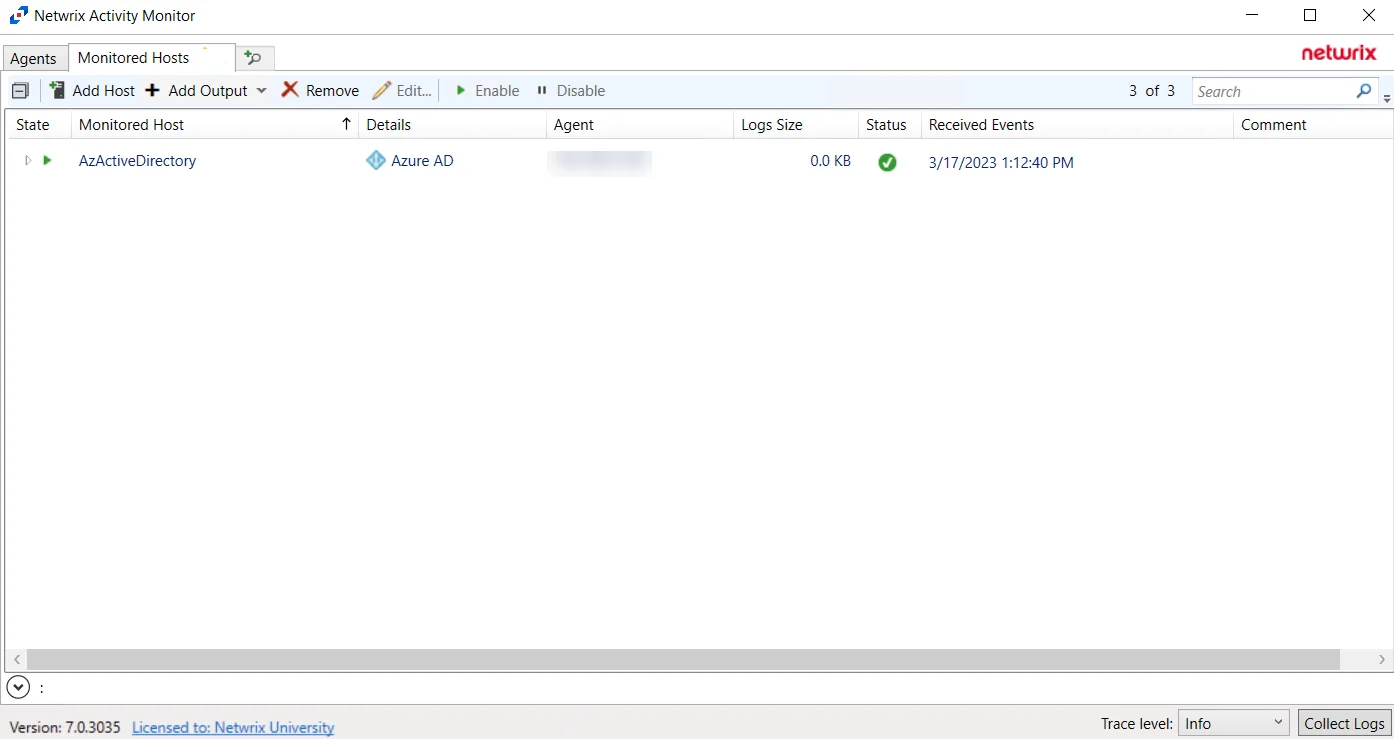
Once the agent(s) installation is complete, hosts can be added for monitoring. The tab is not visible within the console until at least one agent has been deployed.
This tab is comprised of a button bar and a table of hosts being monitored. A list of outputs is listed under each monitored host. These are destinations to which events are forwarded.
Button Bar
The button bar allows users to take the following actions:
- Toggle Collapse – Expands and collapses all Monitored Hosts for viewing or hiding host's outputs
- Add Host – Opens the Add New Host window to configure monitoring of a new host or platform. See the section for instructions on adding the desired target environment.
- Add Output – Opens the Add New Output windows to create new output for the selected host or hosts.
- Remove – Remove the selected hosts or outputs from the monitored hosts table and end monitoring. A window prompts for confirmation to remove the selected hosts or outputs.
- Edit – Opens the selected hosts or outputs’ Properties window to modify monitoring settings
- Enable – Resume monitoring which has been stopped or paused
- Disable – Stop or pause monitoring of the selected hosts or outputs
Bulk Actions
All actions in the button bar except Add Host can be used in the bulk mode. That means youI.e. one can select several hosts or outputs and edit, disable, enable, remove them, or add new outputs at the same time.
Bulk editing allows the user to selectively modify hosts or outputs. For example, with bulk editing it is possible to add a user to Account Exclusions, or set the retention period for log files, or disable reporting of Directory Read operations, etc.
To initiate bulk editing, select multiple hosts or outputs (Ctrl+A and Ctrl+Shift+A may help
here), and click the Edit Edit button. The Properties window shows divergent settings as blank
or in the unknown state or with the <-Different-Values-> marker for the list-like settings.
Leave the <-Different-Values-> marker to preserve the difference in each selected object, or
delete it to remove all divergent elements. When the window closes, only changed properties are
saved to all selected objects, leaving unchanged properties untouched.
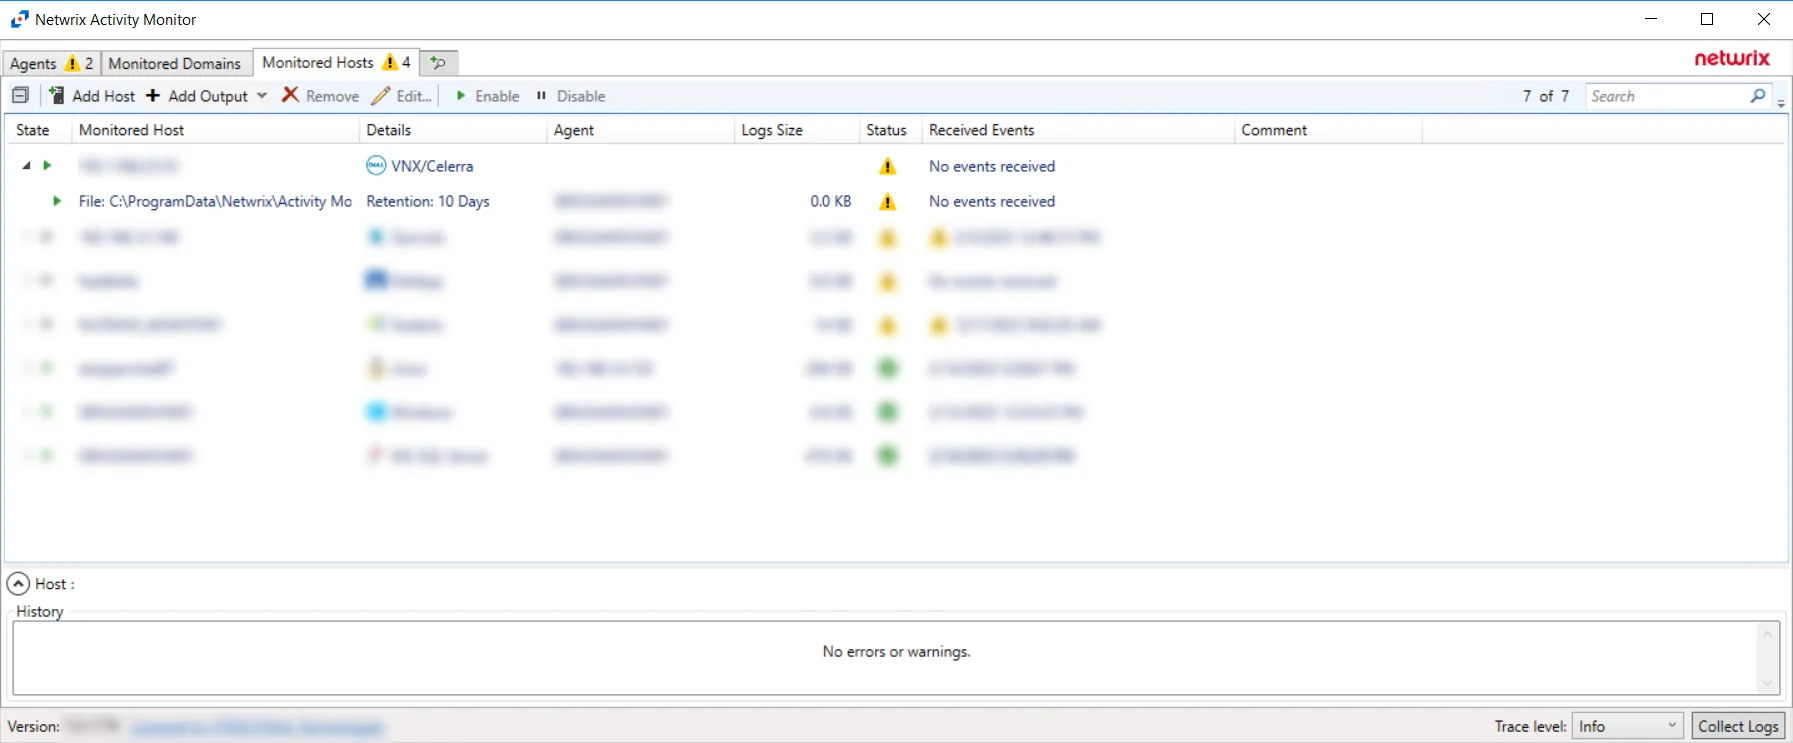
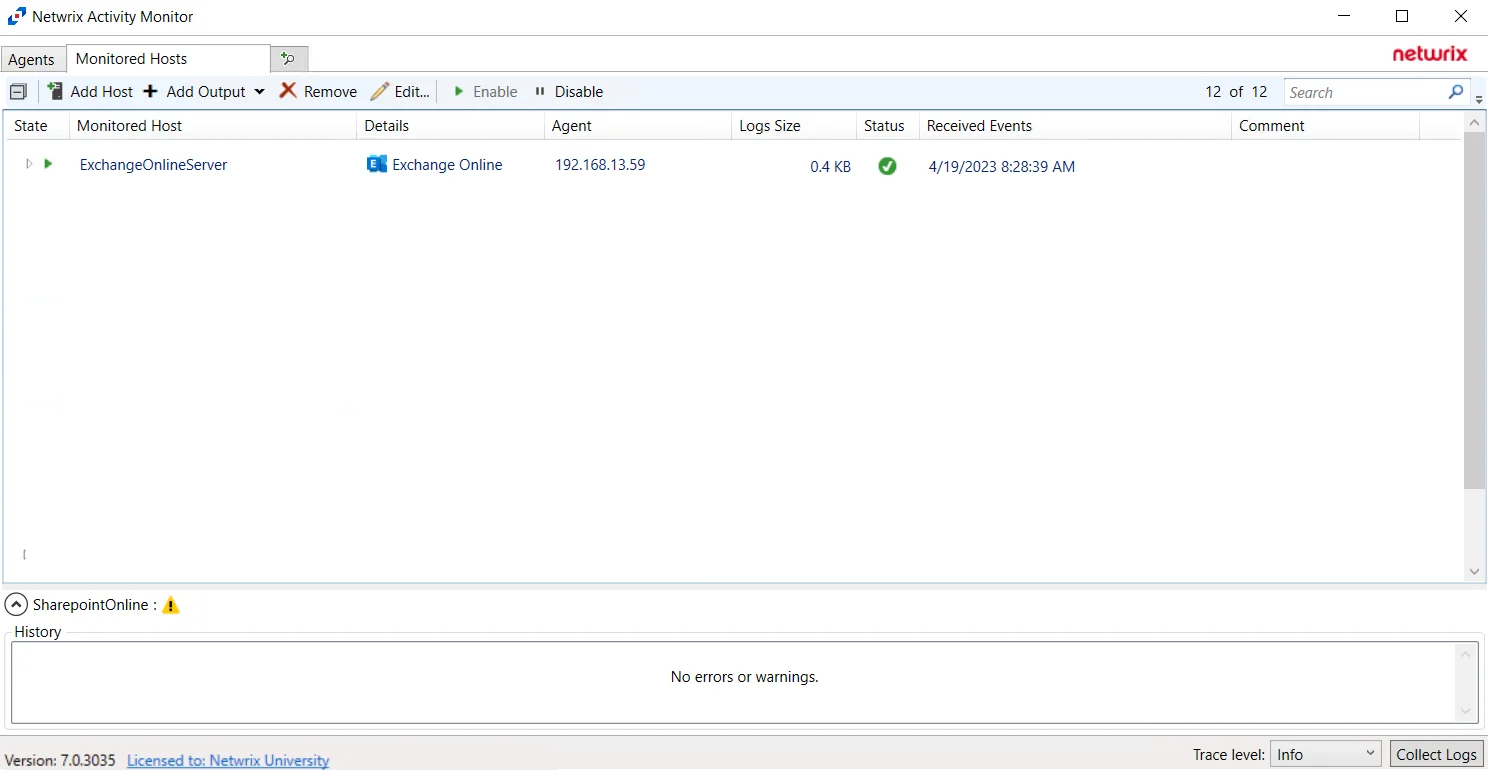
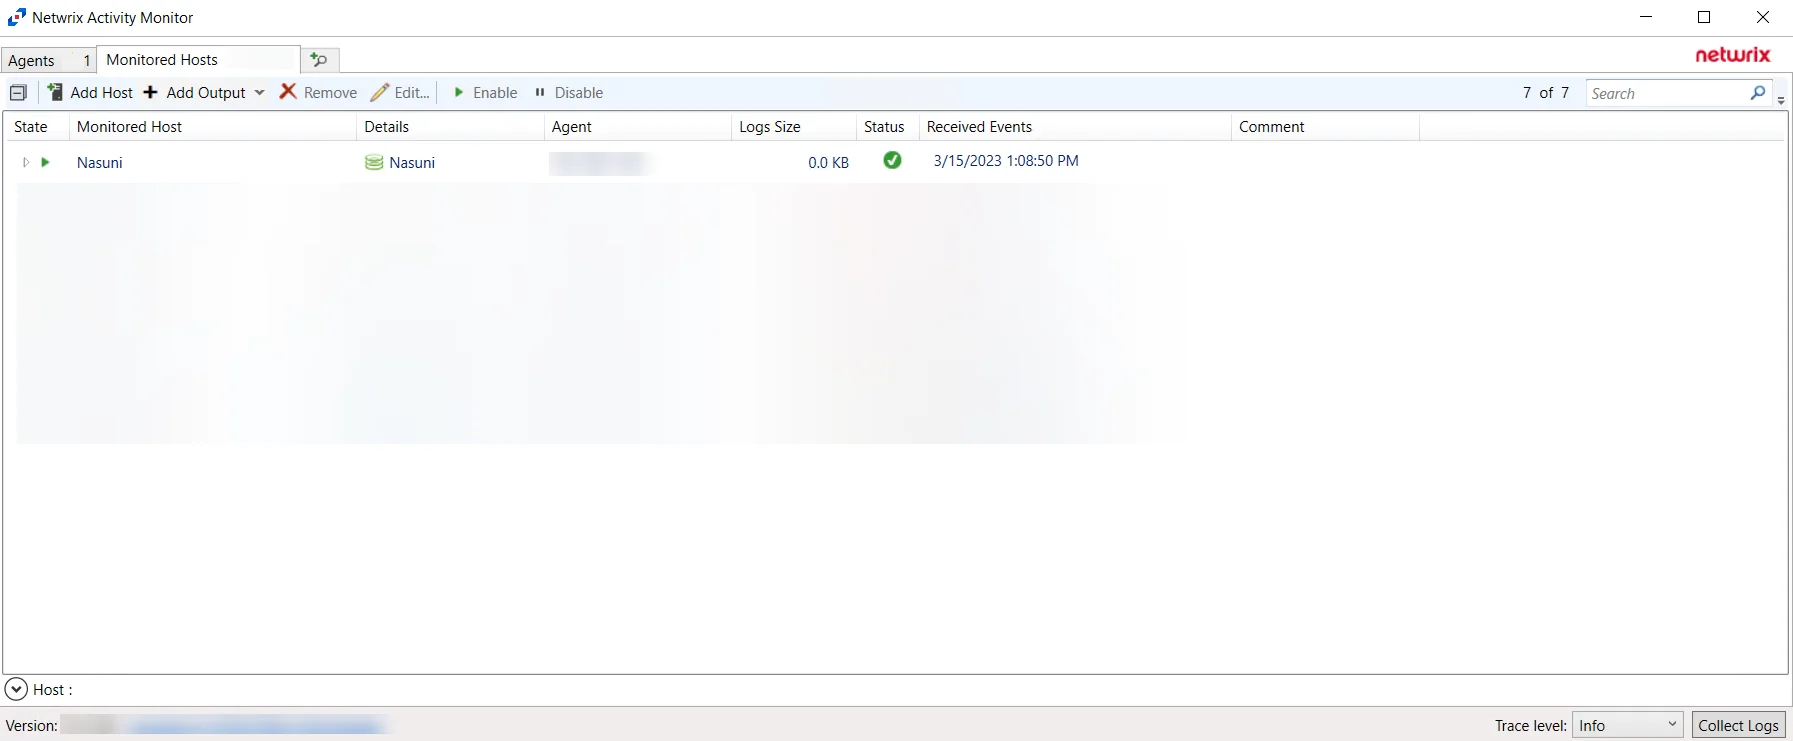
Table
The monitored hosts table provides the following information:
- State — State of the monitored host. The two states are Enabled and Disabled.
- Monitored Host – Name or IP Address of the host being monitored
- Report As — How the Monitored Host is being reported as. This can be customized in the host's properties.
- Details — Displays additional details about the monitored host, such as the Platform and the Log Path.
- Agent – Name or IP Address of the server where the activity agent is deployed
- Retention – Number of days for which the activity log files are retained
- Log Size – Size of the activity log files
- Status – Indicates the status of activity monitoring for the host. See the Error Propagation topic for additional information.
- Received Events – Timestamp of the last event received
- Comment – Comment provided by user:
- Often this indicates the desired output, e.g. Enterprise Auditor.
- This can be useful if adding the same monitored host multiple times with different configurations for different outputs.
- If a Activity Monitor Agent has been deployed to a Windows server where an activity agent is deployed, then the Comment identifies the host as “Managed by Activity Monitor”, and that ‘monitored host’ is not editable. Add the host again for other outputs.
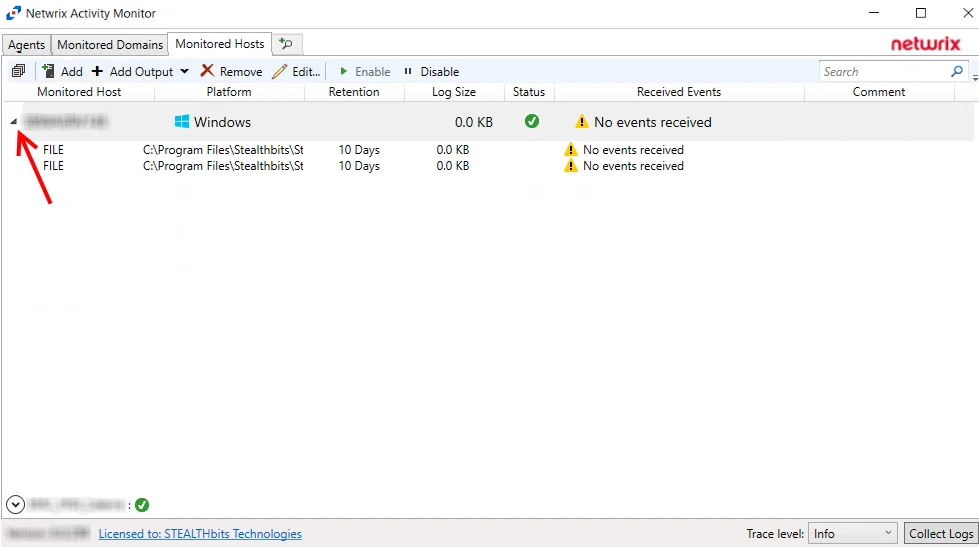
Hosts can have more than one output. To view a host's outputs, expand the host by clicking the white arrow to the left of the Monitored Host name.
For integration with Netwrix Enterprise Auditor, only one configuration of a ‘monitored host’ can be set as the Netwrix Enterprise Auditor output. After a ‘monitored host’ has been added, use the Edit feature to identify the configuration as being for Netwrix Enterprise Auditor on the Log Files tab of the host’s Properties window. See the Log Files Tab topic for additional information.
Monitoring Status
The Status collapsible section located above the Status Bar of the Activity Monitor provides visibility into a host's monitoring state and history of state changes. Host monitoring status is depicted in the Monitored Hosts table under the Status column. Users can expand the Status section to view more information on various status conditions.
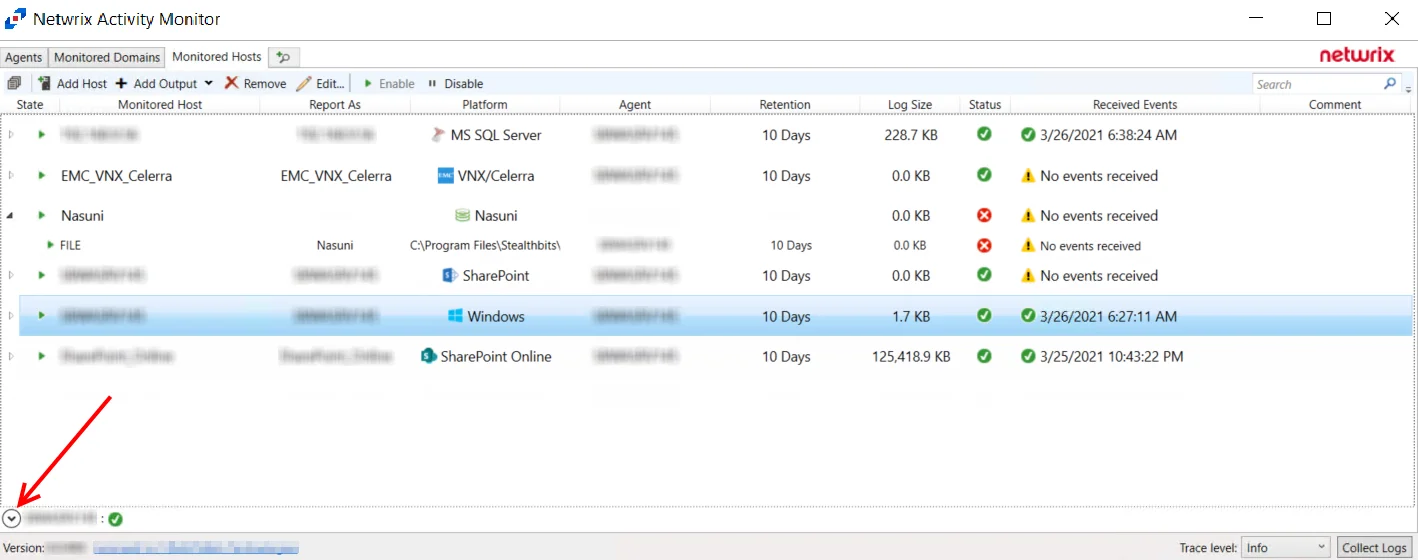
Click the Down Arrow to expand the Status section. The information listed is dependent on which host or output is currently selected in the Monitored Hosts table. Users can find information on the Current State of a host, as well as viewing a history of changes in state.
The possible statuses depend on the type of hosts being monitored. What is common is that the status can help identify a problem and provide a possible workaround. The following sections provide more information about device-specific states.
Linux Monitoring Status
For file activity monitoring on Linux, Activity Monitor relies on auditd component of the Linux Auditing System. One of the features of auditd is the immutable mode, which locks the audit configuration and protects it from being changed. When the immutable mode is enabled, the only way to change the auditing configuration is to reboot the server.
Activity Monitor supports the immutable mode. It compares the current auditd configuration with the desired one. If they differ and the immutable mode is enabled, the product displays a warning in the status section that a server restart is required. After the reboot, the changes take effect and the immutable mode is enabled.
Qumulo Monitoring Status
The No connections from Qumulo clusters error may be displayed in the status section. This error indicates that the Qumulo nodes have not yet connected to the agent. This can happen either because an incorrect address or port is specified in the Audit page of the Qumulo Web Interface, or because the port (4496 by default) is blocked by a firewall.
Output for Monitored Hosts
Once a host is being monitored the event stream can be sent to multiple outputs.
Configured outputs are grouped under the host. You can have multiple outputs configured for a host. The host event outputs are:
- File – Creates an activity log as a TSV or JSON file for every day of activity
- Syslog – Sends activity events to the configured SIEM server or Netwrix Threat Manager, where supported
Add File Output
Follow the steps to add a File output.
Step 1 – On the Monitored Hosts tab, select the desired host and click Add Output.
Step 2 – Select File from the drop-down menu. The Add New Output window opens.
Step 3 – Configure the tab(s) as desired.
Step 4 – Click Add Output to save your settings. The Add New Output window closes.
The new output displays in the table. Click the Edit button to open the Output properties window to modify these settings. See the Output Types topic for additional information.
Add Syslog Output
Follow the steps to add a Syslog output.
Step 1 – On the Monitored Hosts tab, select the desired host and click Add Output.
Step 2 – Select Syslog from the drop-down menu. The Add New Output window opens.
Step 3 – Configure the tab(s) as desired.
Step 4 – Click Add Output to save your settings. The Add New Output window closes.
The new output displays in the table. Click the Edit button to open the Output properties window to modify these settings. See the Output Types topic for additional information.
Add New Host Window
Once an agent has been deployed, you can configure a host to be monitored by clicking the Add Host button on the Monitored Hosts tab.
The window opens for all types of hosts that can be monitored with an Activity Agent. See the following topics for additional information:
- Dell Celerra or VNX
- Dell Isilon/PowerScale
- Dell PowerStore
- Dell Unity
- Exchange Online
- Hitachi
- Microsoft Entra ID
- Nasuni
- NetApp
- Nutanix
- Panzura
- Qumulo
- SharePoint
- SharePoint Online
- SQL Server
- Windows
Dell Celerra or VNX
Understanding File Activity Monitoring
The Activity Monitor can be configured to monitor the following:
- Ability to collect all or specific file activity for specific values or specific combinations of values
It provides the ability to feed activity data to SIEM products. The following dashboards have been specifically created for Activity Monitor event data:
- For IBM® QRadar®, see the Netwrix File Activity Monitor App for QRadar for additional information.
- For Splunk®, see the File Activity Monitor App for Splunk for additional information.
It also provides the ability to feed activity data to other Netwrix products:
- Netwrix Enterprise Auditor
- Netwrix Threat Prevention
- Netwrix Threat Manager
Prior to adding a Dell Celerra or VNX host to the Activity Monitor, the prerequisites for the target environment must be met. See the Dell Celerra & Dell VNX Activity Auditing Configuration topic for additional information.
Remember, the Activity Agent must be deployed to a Windows server that acts as a proxy for monitoring the target environment.
Add Dell VNX/Celerra Host
Follow the steps to add a Dell Celerra or VNX host to be monitored.
Step 1 – Navigate to the Monitored Hosts tab and click Add. The Add New Host window opens.

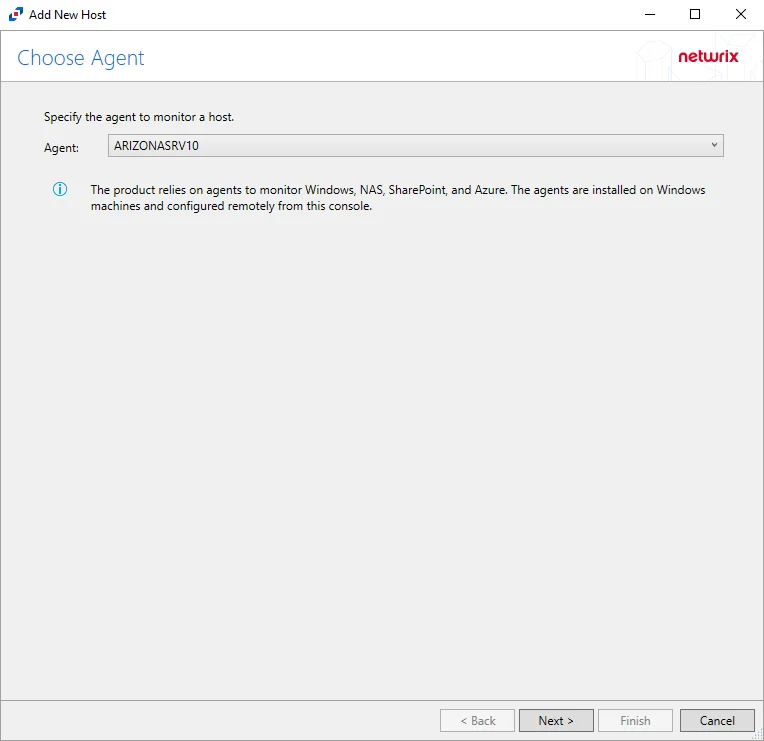
Step 2 – On the Choose Agent page, select the Agent to monitor the storage device. Click Next.

Step 3 – On the Add Host page, select the Dell VNX/Celerra radio button and enter the CIFS Server NetBIOS Name for the device. If desired, add a Comment. Click Next.
NOTE: All Dell event source types must have the CEE Monitor Service installed on the agent in order to collect events. Activity Monitor will detect if the CEE Monitor is not installed and display a warning to install the service. If the CEE Monitor service is installed on a remote machine, manual configuration is required. See the Dell CEE Options Tab topic for additional information.
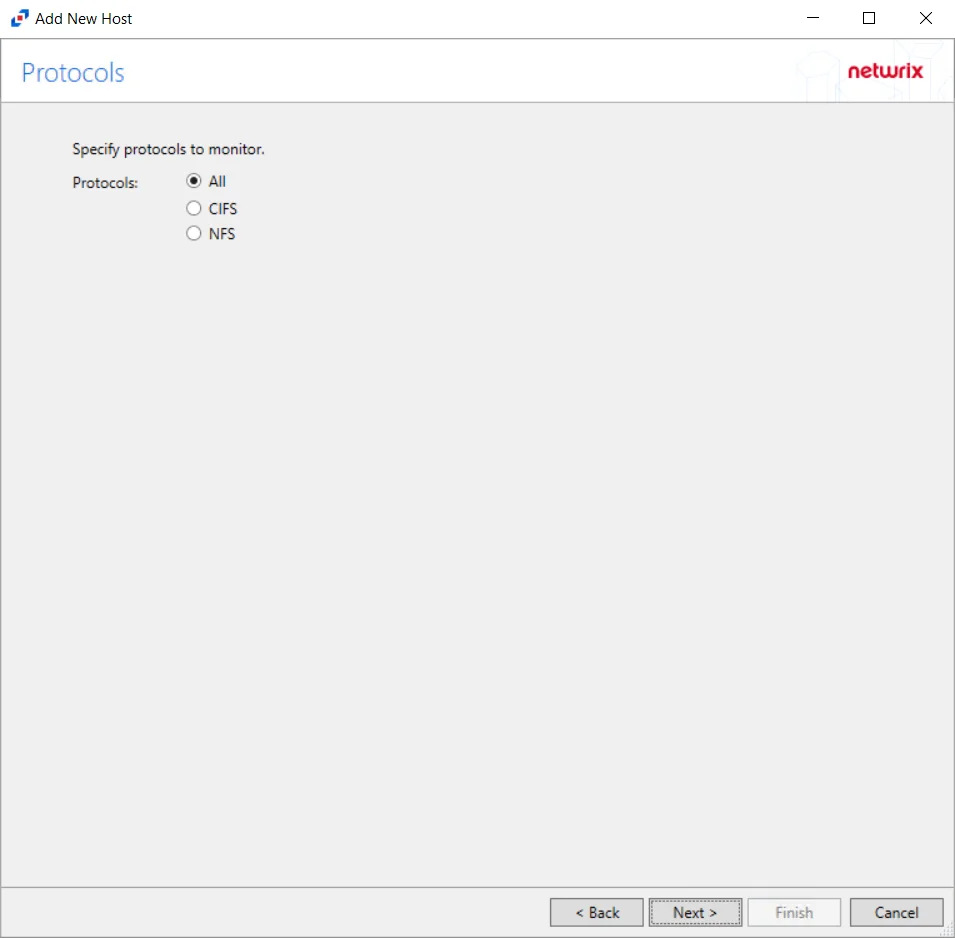
Step 4 – On the Protocols page, select which protocols to monitor. The list of protocols that can be monitored are All, CIFS, or NIFS. Click Next.
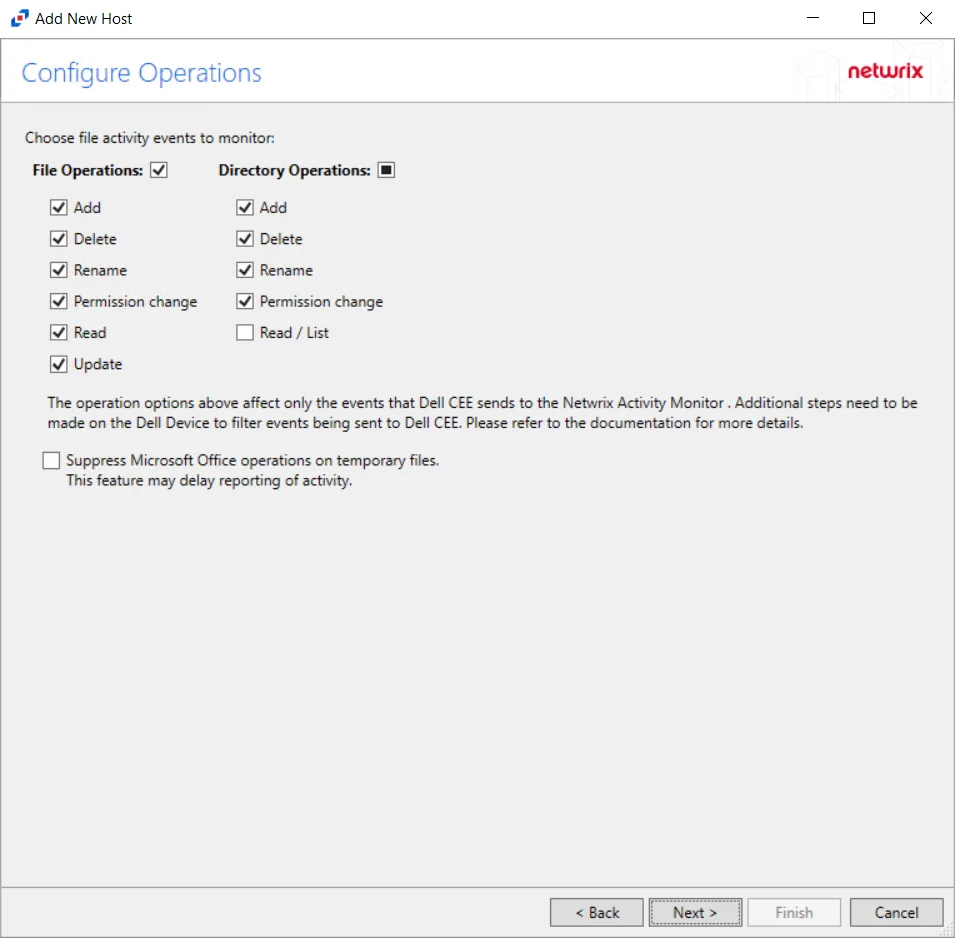
Step 5 – On the Configure Operations page, select the File Operations and Directory Operations to be monitored. Additional options include:
CAUTION: Suppress Microsoft Office operations on temporary files – Filters out events for Microsoft Office temporary files. When Microsoft Office files are saved or edited, many temporary files are created. With this option enabled, events for these temporary files are ignored. This feature may delay reporting of activity.
Click Next.
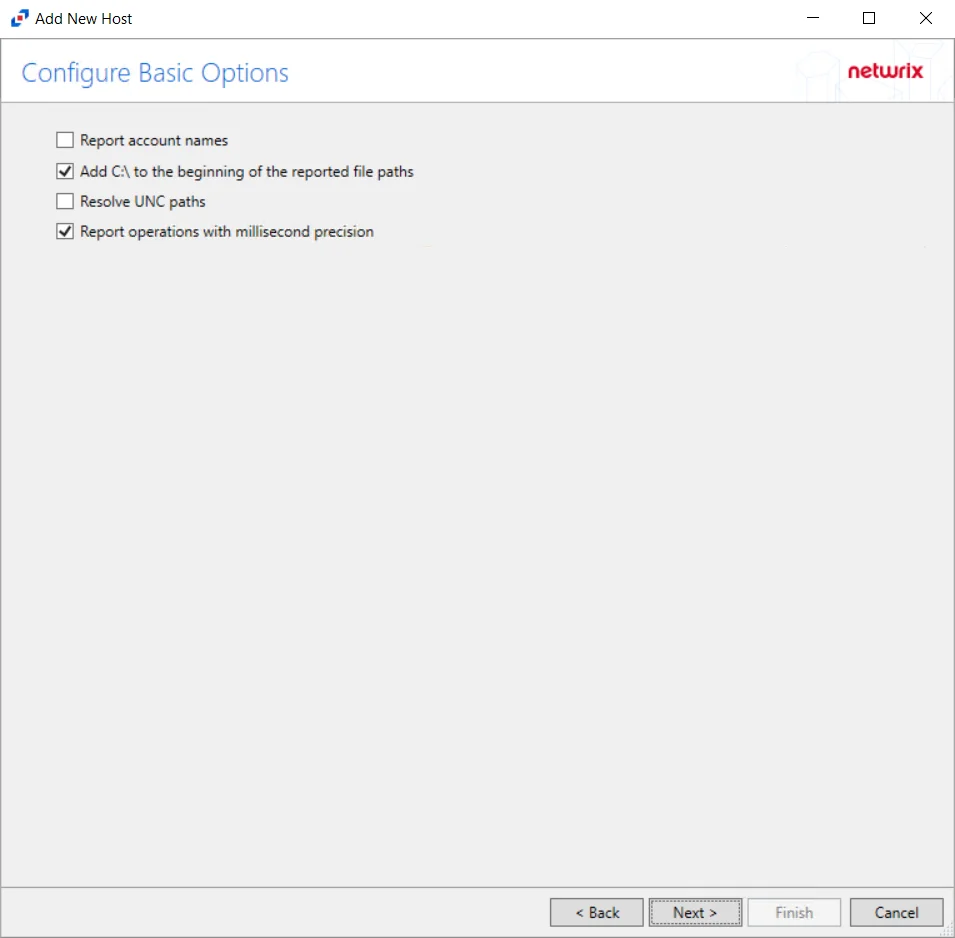
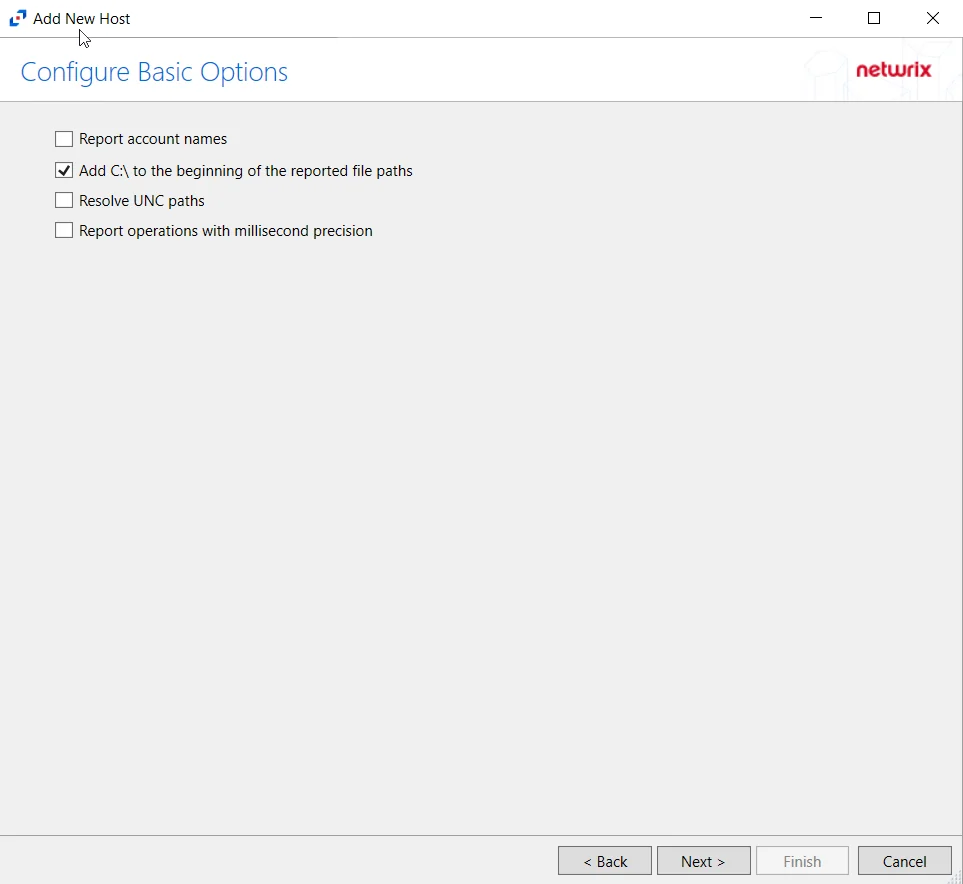
Step 6 – On the Configure Basic Options page, choose which settings to enable. The “Log files” are the activity logs created by the activity agent on the proxy host. Select the desired options:
- Report account names – Adds an Account Name column in the generated TSV files
- Add C:\ to the beginning of the reported file paths – Adds ‘C:\” to file paths to be displayed
like a Windows file path:
- Display example if checked – C:\Folder\file.txt
- Display example if unchecked – /Folder/file.text
- Resolve UNC paths – Adds a UNC Path column and a Rename UNC Path column in the generated
TSV files
- This option corresponds to the REPORT_UNC_PATH parameter in the INI file. It is disabled by
default. The UNC Path is in the following format:
- For CIFS activity – \[HOST][SHARE][PATH]
- Example CIFS activity – \ExampleHost\TestShare\DocTeam\Temp.txt
- For NFS activity – [HOST]:/[VOLUME]/[PATH]
- Example NFS activity – ExampleHost:/ExampleVolume/DocTeam/Temp.txt
- When the option is enabled, the added columns are populated when a file is accessed remotely through the UNC Path. If a file is accessed locally, these columns are empty. These columns have also been added as Syslog macros.
- When this option is selected, the user needs to provide credentials in the Auditing tab. If
credentials are not provided, the following warning message is displayed:
- Credentials are required for this feature. Provide the credentials in the Auditing tab.
- This option corresponds to the REPORT_UNC_PATH parameter in the INI file. It is disabled by
default. The UNC Path is in the following format:
- Report operations with millisecond precision – Changes the timestamps of events being recorded in the TSV log file for better ordering of events if multiple events occur within the same second
Click Next.
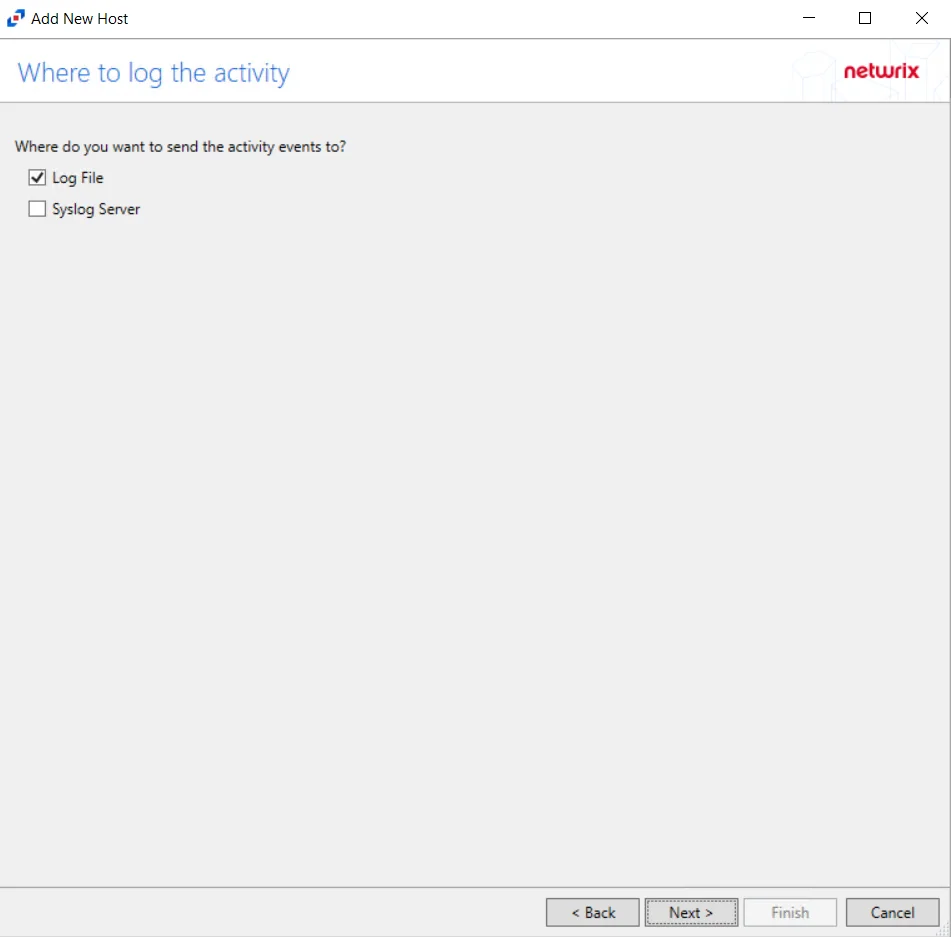
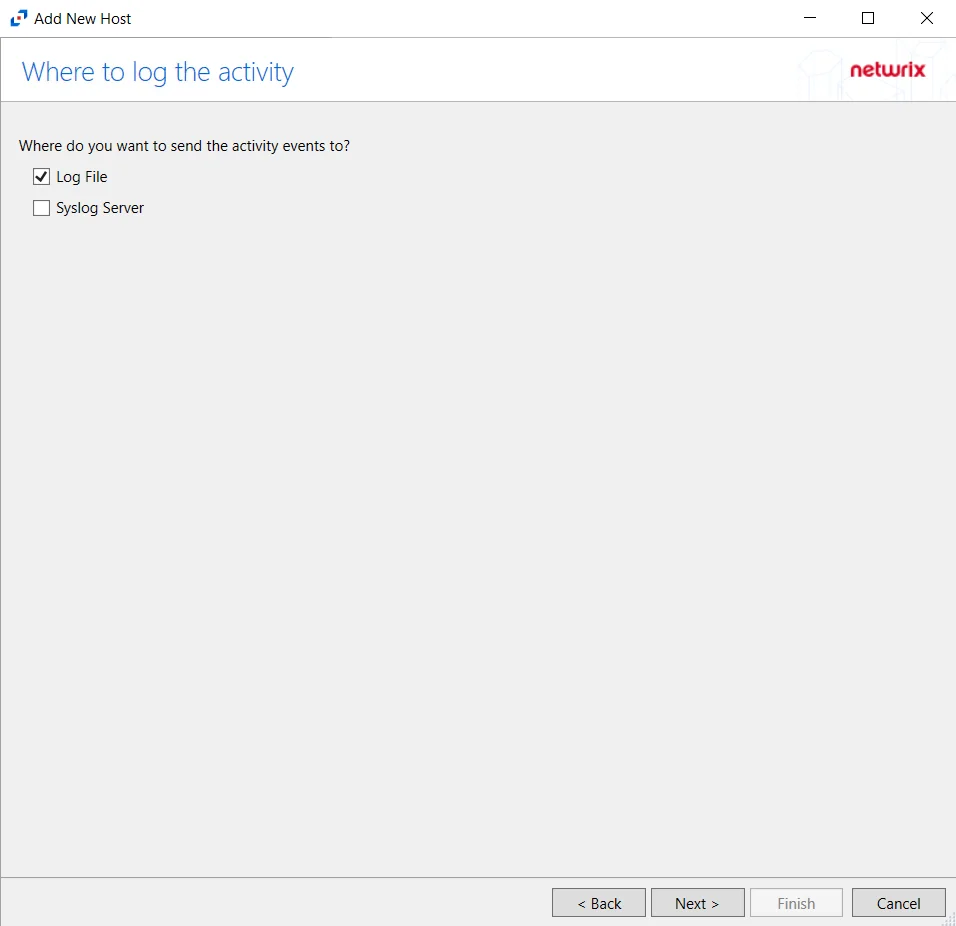
Step 7 – On the Where To Log The Activity page, select whether to send the activity to either a Log File or Syslog Server. Click Next.
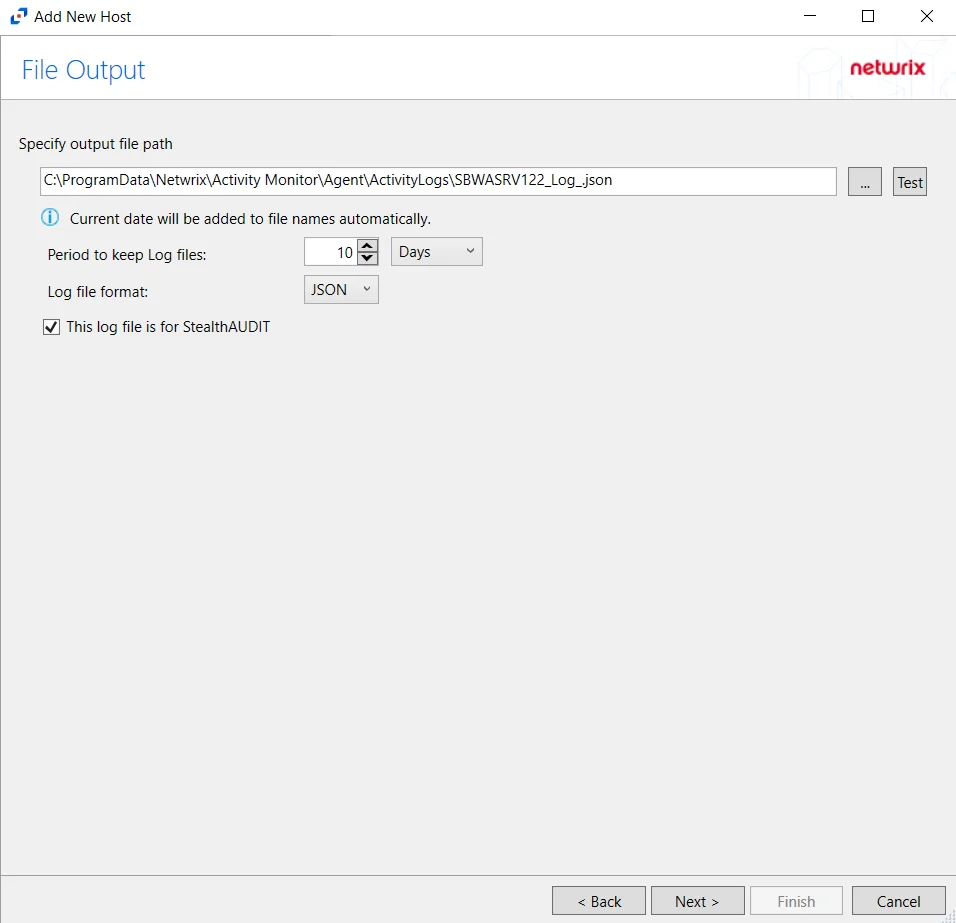
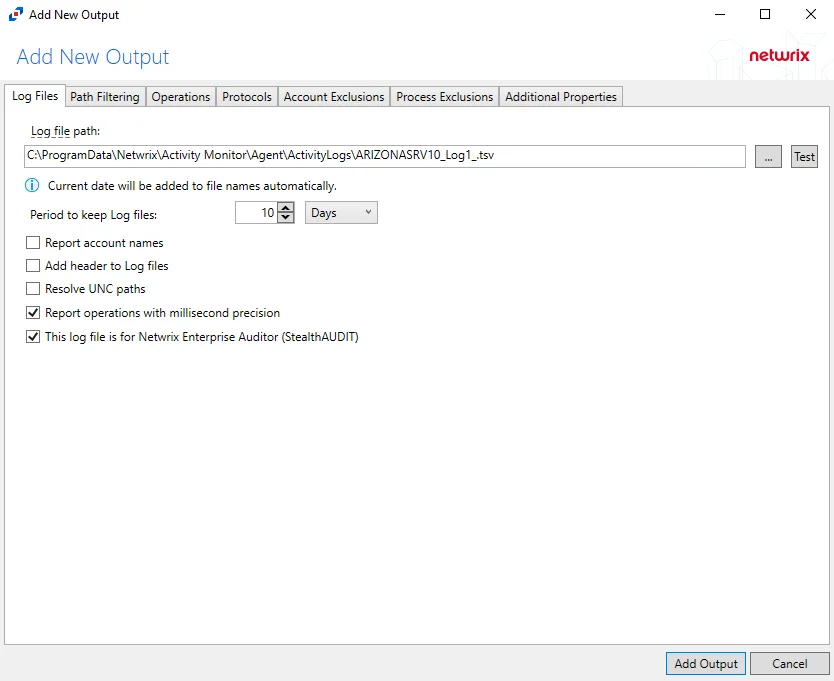
Step 8 – If Log File is selected on the Where To Log The Activity page, the File Output page can be configured.
-
Specify output file path – Specify the file path where log files are saved. Click the ellipses button (...) to open the Windows Explorer to navigate to a folder destination. Click Test to test if the path works.
-
Period to keep Log files – Log files will be deleted after the period entered number of days entered. The default is 10 days. Use the dropdown to specify whether to keep the Log files for a set amount of Minutes, Hours, or Days.
-
This log file is for Enterprise Auditor – Enable this option to have Enterprise Auditor collect this monitored host configuration
RECOMMENDED: Identify the configuration to be read by Netwrix Enterprise Auditor when integration is available.
- While the Activity Monitor can have multiple configurations per host, Enterprise Auditor can only read one of them.
-
Add header to Log files – Adds headers to TSV files. This is used to feed data into Splunk.
Click Next.
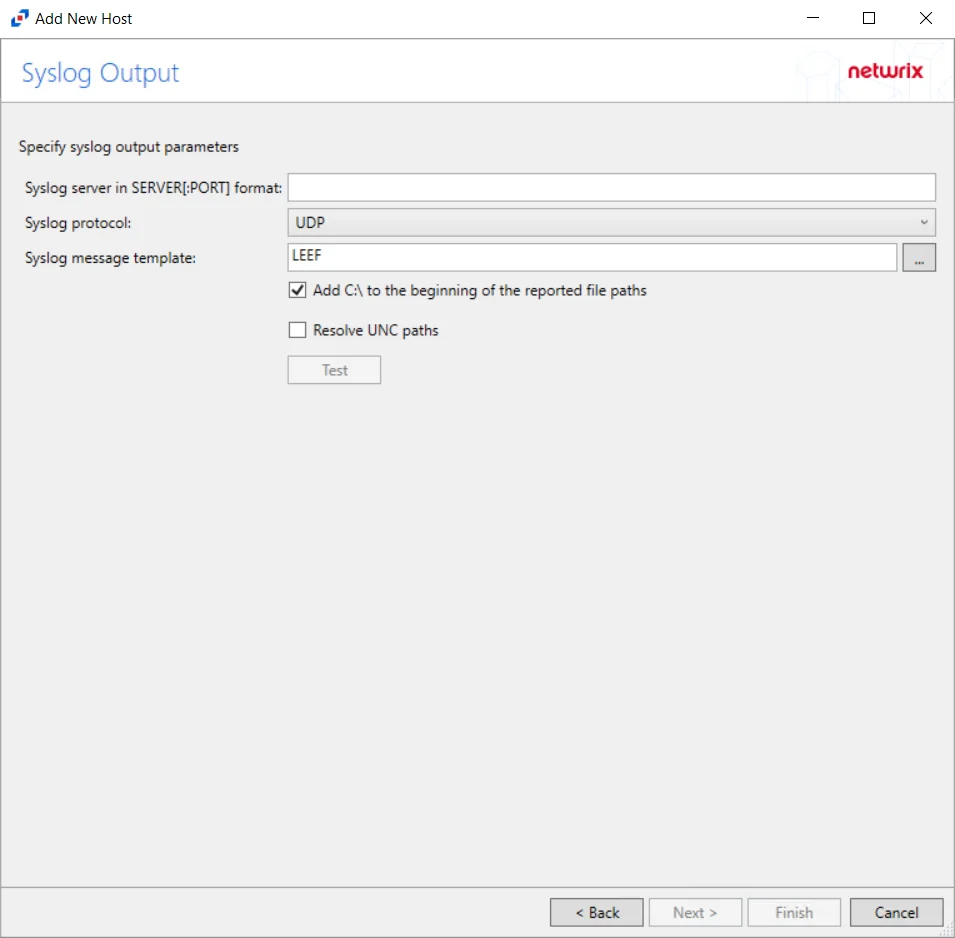
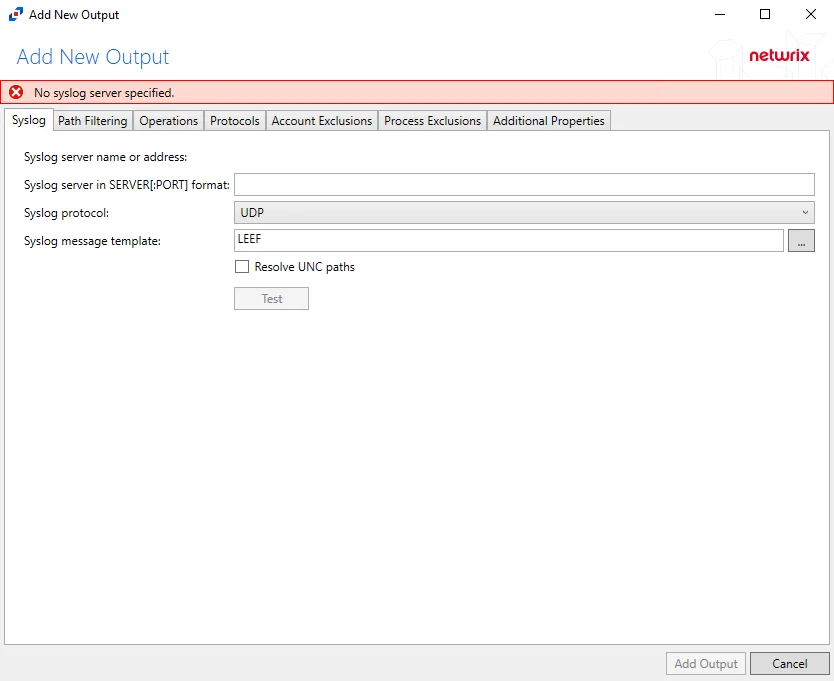
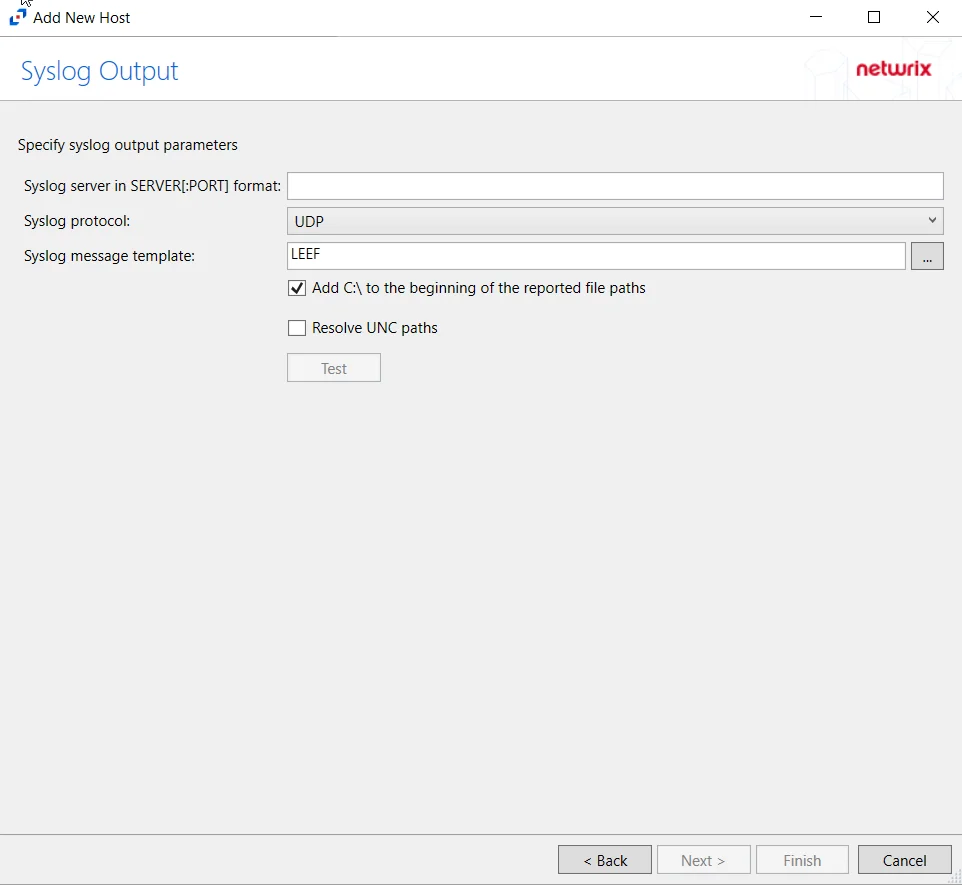
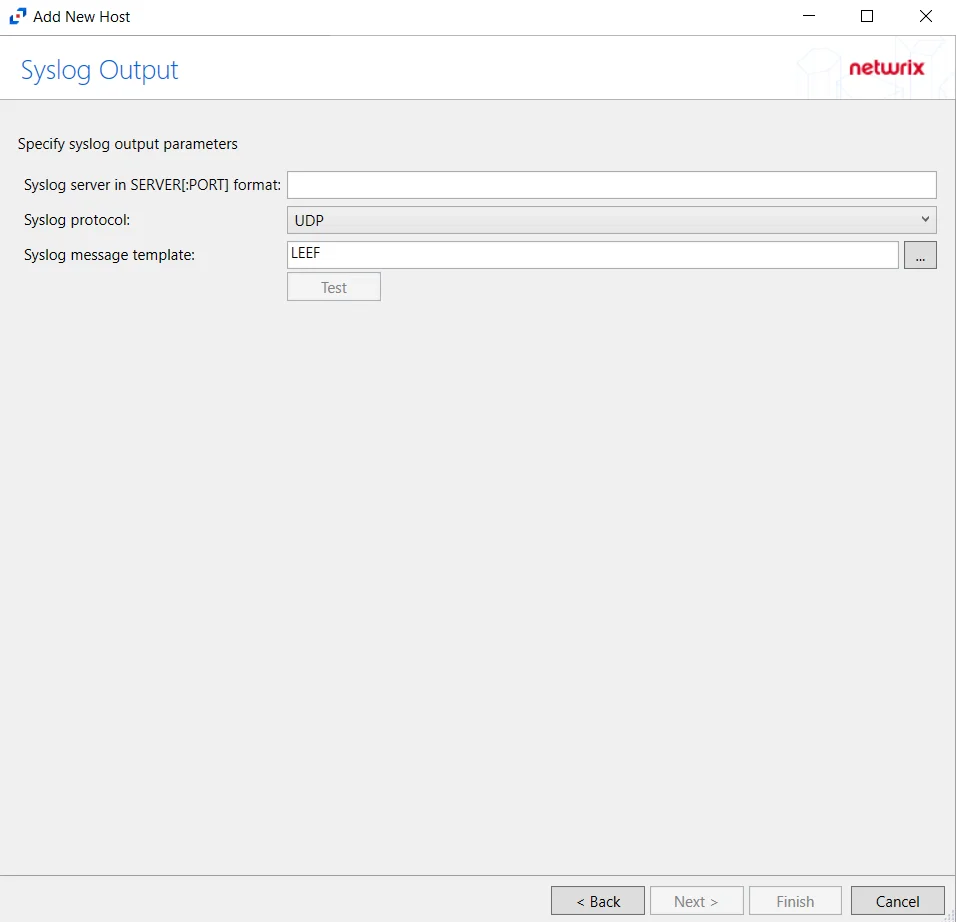
Step 9 – If Syslog Server is selected on the Where To Log The Activity page, the Syslog Output page can be configured.
-
Syslog server in SERVER[:PORT] format – Type the Syslog server name with a SERVER:Port format in the text box.
- The server name can be short name, fully qualified name (FQDN), or IP Address, as long as the organization’s environment can resolve the name format used. The Event stream is the activity being monitored according to this configuration for the monitored host.
-
Syslog Protocol – Identify the Syslog protocol to be used for the Event stream. The drop-down menu includes:
- UDP
- TCP
- TLS
The TCP and TLS protocols add the Message framing drop-down menu. See the Syslog Tab topic for additional information.
-
Syslog message template – Click the ellipsis (…) to open the Syslog Message Template window. The following Syslog templates have been provided:
- AlienVault / Generic Syslog
- CEF – Incorporates the CEF message format
- HP Arcsight
- LEEF – Incorporates the LEEF message format
- LogRhythm
- McAfee
- QRadar – Use this template for IBM QRadar integration
- Splunk – Use this template for Splunk integration
- Threat Manager – Use this template for Threat Manager integration. This is the only supported template for Threat Manager. See the Netwrix Threat Manager Documentation for additional information.
- Custom templates can be created. Select the desired template or create a new template by modifying an existing template within the Syslog Message Template window. The new message template will be named Custom.
-
Add C:\ to the beginning of the reported file paths – Adds ‘C:\” to file paths to be displayed like a Windows file path:
- Display example if checked – C:\Folder\file.txt
- Display example if unchecked – /Folder/file.text
-
Resolve UNC paths – Adds a UNC Path column and a Rename UNC Path column in the generated TSV files
- This option corresponds to the REPORT_UNC_PATH parameter in the INI file. It is disabled by
default. The UNC Path is in the following format:
- For CIFS activity – \[HOST][SHARE][PATH]
- Example CIFS activity – \ExampleHost\TestShare\DocTeam\Temp.txt
- For NFS activity – [HOST]:/[VOLUME]/[PATH]
- Example NFS activity – ExampleHost:/ExampleVolume/DocTeam/Temp.txt
- When the option is enabled, the added columns are populated when a file is accessed remotely through the UNC Path. If a file is accessed locally, these columns are empty. These columns have also been added as Syslog macros.
- When this option is selected, the user needs to provide credentials in the Auditing tab. If
credentials are not provided, the following warning message is displayed:
- Credentials are required for this feature. Provide the credentials in the Auditing tab.
- This option corresponds to the REPORT_UNC_PATH parameter in the INI file. It is disabled by
default. The UNC Path is in the following format:
-
The Test button – Sends a test message to the Syslog server to check the connection. A green check mark or red will determine whether the test message has been sent or failed to send. Messages vary by Syslog protocol:
- UDP – Sends a test message and does not verify connection
- TCP/TLS – Sends test message and verifies connection
- TLS – Shows error if TLS handshake fails
See the Syslog Tab topic for additional information.
Click Finish.
The added Dell Celerra or VNX host is displayed in the Monitored Hosts table. Once a host has been added for monitoring, configure the desired ouptuts. See the Output for Monitored Hosts topic for additional information.
Host Properties for Dell Celerra or VNX
Configuration settings can be edited through the tabs in the host’s Properties window. The configurable host properties are:
See the Host Properties Window topic for additional information.
Dell Isilon/PowerScale
Understanding File Activity Monitoring
The Activity Monitor can be configured to monitor the following:
- Ability to collect all or specific file activity for specific values or specific combinations of values
It provides the ability to feed activity data to SIEM products. The following dashboards have been specifically created for Activity Monitor event data:
- For IBM® QRadar®, see the Netwrix File Activity Monitor App for QRadar for additional information.
- For Splunk®, see the File Activity Monitor App for Splunk for additional information.
It also provides the ability to feed activity data to other Netwrix products:
- Netwrix Enterprise Auditor
- Netwrix Threat Prevention
- Netwrix Threat Manager
Prior to adding a Dell Isilon/PowerScale host to the Activity Monitor, the prerequisites for the target environment must be met. See the Dell Isilon/PowerScale Activity Auditing Configuration topic for additional information.
Remember, the Activity Agent must be deployed to a Windows server that acts as a proxy for monitoring the target environment.
Add Dell Isilon/PowerScale Host
Follow the steps to add a Dell Isilon/PowerScale host to be monitored.
Step 1 – Navigate to the Monitored Hosts tab and click Add. The Add New Host window opens.
Step 2 – On the Choose Agent page, select the Agent to monitor the storage device. Click Next.
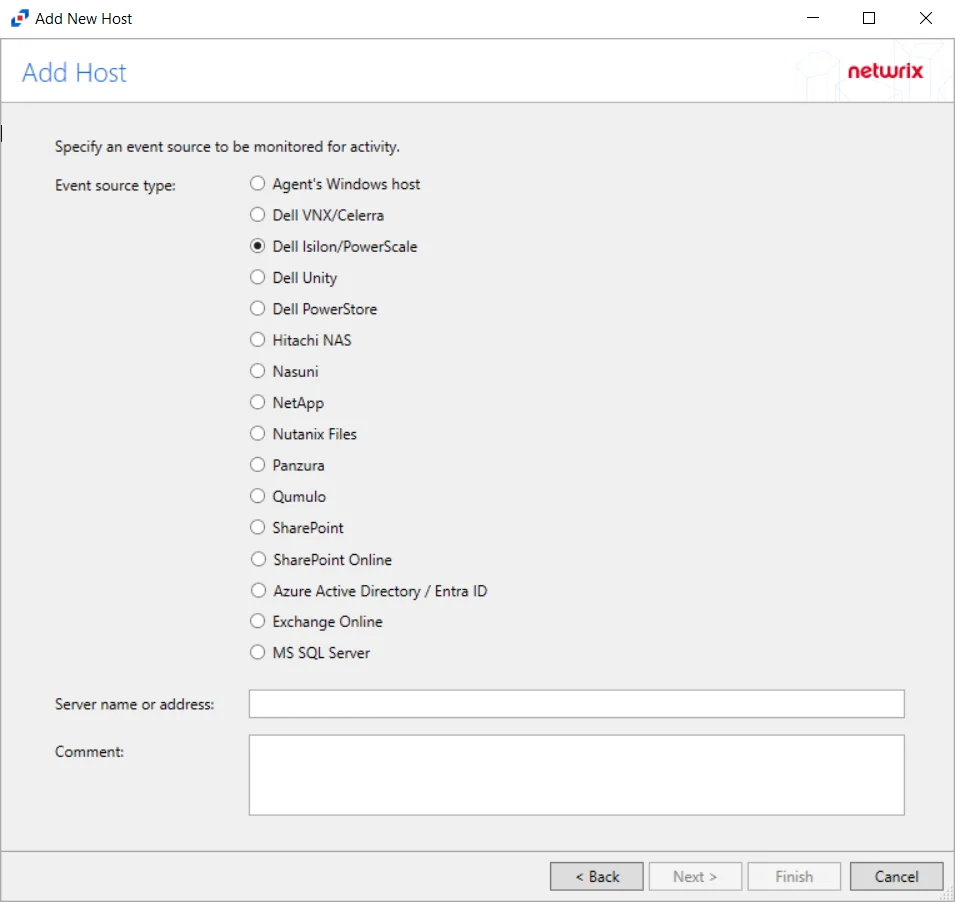
Step 3 – On the Add Host page, select the Dell Isilon radio button and enter both the Server name or address and the CIFS/NFS server name for the device. The CIFS/NFS server name can be left blank to collect activity from the Isilon cluster. If desired, add a Comment. Click Next.
NOTE: All Dell event source types must have the CEE Monitor Service installed on the agent in order to collect events. Activity Monitor will detect if the CEE Monitor is not installed and display a warning to install the service. If the CEE Monitor service is installed on a remote machine, manual configuration is required. See the Dell CEE Options Tab topic for additional information.
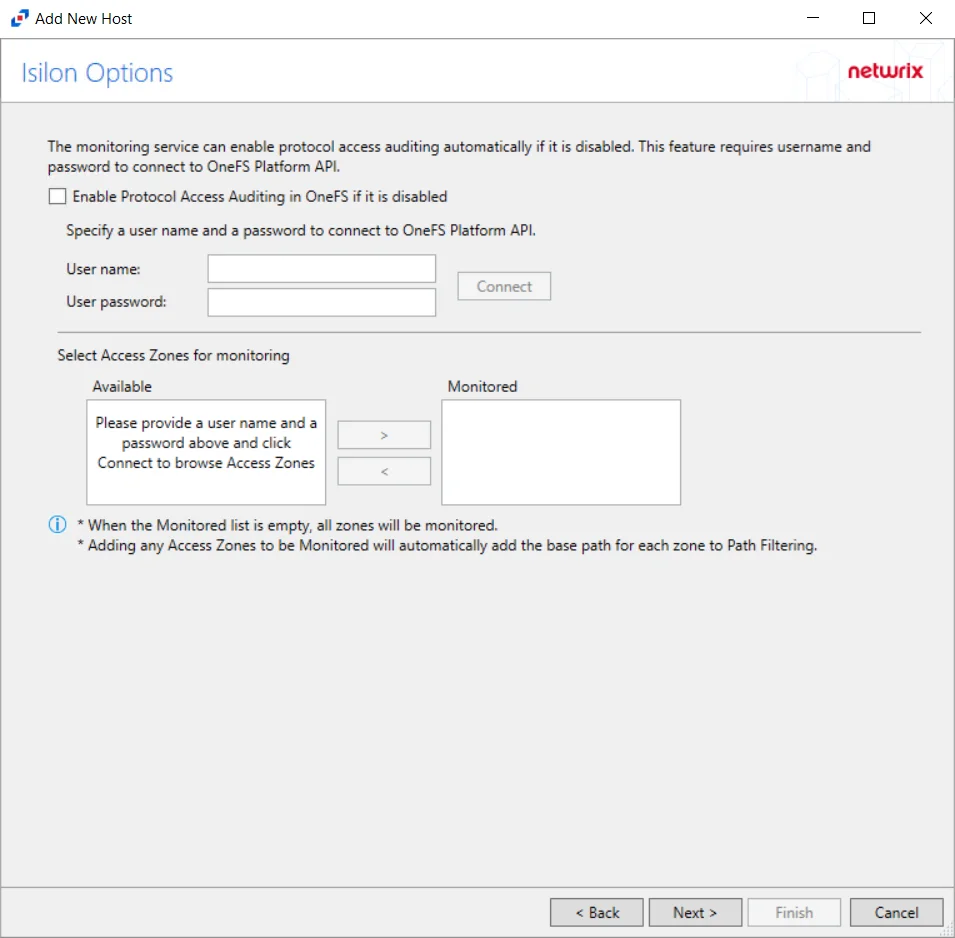
Step 4 – On the Isilon Options page, choose whether or not to automatically enable and configure auditing on the Isilon cluster. If a manual configuration has been completed, do not enable these options.
Follow these steps to use this automated option:
-
Check the Enable Protocol Access Auditing in OneFS if it is disabled box.
-
Enter the User name and User password to connect to the OneFS Platform API.
NOTE: The User name entered must be an Administrator account on the Dell Isilon device.
-
Click Connect to test the connection. If the connection is successful, discovered access zones is displayed in the Available box.
-
Access Zones:
-
By default, the Monitored box is left empty and all available access zones are monitored. All activity for the host is collected and placed in a single activity log file per day.
-
If access zones are selected, only those access zones are monitored and the activity is placed in a single activity log file per day.
- Use the arrow buttons to move the desired access zones to the Monitored box.
-
(Optional) Activity log files can be generated for each access zone. In order to generate one activity log file for each access zone, add only one access zone to this configuration of the monitored host. Then, add the host again for each access zone to be monitored. When adding an Isilon host for each access zone, the Dell device name will be the same for each configuration, but the CIFS/NFS server name must have a unique value.
NOTE: Although the Isilon Options page allows multiple access zones to be placed in the Monitored box for a single Isilon host, when generating separate activity log files for each access zones, Enterprise Auditor does not support this configuration. Enterprise Auditor integration requires all access zones to be monitored from a single configuration.
-
Click Next.
Step 5 – On the Protocols page, select which protocol to monitor. The list of protocols that can be monitored are All, CIFS, or NIFS. Click Next.
Step 6 – On the Configure Operations page, select the File Operations and Directory Operations options to be monitored. Additional options include:
CAUTION: Suppress Microsoft Office operations on temporary files – Filters out events for Microsoft Office temporary files. When Microsoft Office files are saved or edited, many temporary files are created. With this option enabled, events for these temporary files are ignored. This feature may delay reporting of activity.
Click Next.
Step 7 – On the Configure Basic Options page, choose which settings to enable. The “Log files” are the activity logs created by the activity agent on the proxy host. Select the desired options:
- Report account names – Adds an Account Name column in the generated TSV files
- Add C:\ to the beginning of the reported file paths – Adds ‘C:\” to file paths to be displayed
like a Windows file path:
- Display example if checked – C:\Folder\file.txt
- Display example if unchecked – /Folder/file.text
- Resolve UNC paths – Adds a UNC Path column and a Rename UNC Path column in the generated
TSV files
- This option corresponds to the REPORT_UNC_PATH parameter in the INI file. It is disabled by
default. The UNC Path is in the following format:
- For CIFS activity – \[HOST][SHARE][PATH]
- Example CIFS activity – \ExampleHost\TestShare\DocTeam\Temp.txt
- For NFS activity – [HOST]:/[VOLUME]/[PATH]
- Example NFS activity – ExampleHost:/ExampleVolume/DocTeam/Temp.txt
- When the option is enabled, the added columns are populated when a file is accessed remotely through the UNC Path. If a file is accessed locally, these columns are empty. These columns have also been added as Syslog macros.
- When this option is selected, the user needs to provide credentials in the Auditing tab. If
credentials are not provided, the following warning message is displayed:
- Credentials are required for this feature. Provide the credentials in the Auditing tab.
- This option corresponds to the REPORT_UNC_PATH parameter in the INI file. It is disabled by
default. The UNC Path is in the following format:
- Report operations with millisecond precision – Changes the timestamps of events being recorded in the TSV log file for better ordering of events if multiple events occur within the same second
Click Next.
Step 8 – On the Where To Log The Activity page, select whether to send the activity to either a Log File or Syslog Server. Click Next.
Step 9 – If Log File) is selected on the Where To Log The Activity page, the File Output page can be configured.
-
Specify output file path – Specify the file path where log files are saved. Click the ellipses button (...) to open the Windows Explorer to navigate to a folder destination. Click Test to test if the path works.
-
Period to keep Log files – Log files will be deleted after the period entered number of days entered. The default is 10 days. Use the dropdown to specify whether to keep the Log files for a set amount of Minutes, Hours, or Days.
-
This log file is for Enterprise Auditor – Enable this option to have Enterprise Auditor collect this monitored host configuration
RECOMMENDED: Identify the configuration to be read by Netwrix Enterprise Auditor when integration is available.
- While the Activity Monitor can have multiple configurations per host, Enterprise Auditor can only read one of them.
-
Add header to Log files – Adds headers to TSV files. This is used to feed data into Splunk.
Click Next.
Step 10 – If Syslog Server is selected on the Where To Log The Activity page, the Syslog Output page can be configured.
-
Syslog server in SERVER[:PORT] format – Type the Syslog server name with a SERVER:Port format in the text box.
- The server name can be short name, fully qualified name (FQDN), or IP Address, as long as the organization’s environment can resolve the name format used. The Event stream is the activity being monitored according to this configuration for the monitored host.
-
Syslog Protocol – Identify the Syslog protocol to be used for the Event stream. The drop-down menu includes:
- UDP
- TCP
- TLS
The TCP and TLS protocols add the Message framing drop-down menu. See the Syslog Tab topic for additional information.
-
Syslog message template – Click the ellipsis (…) to open the Syslog Message Template window. The following Syslog templates have been provided:
- AlienVault / Generic Syslog
- CEF – Incorporates the CEF message format
- HP Arcsight
- LEEF – Incorporates the LEEF message format
- LogRhythm
- McAfee
- QRadar – Use this template for IBM QRadar integration
- Splunk – Use this template for Splunk integration
- Threat Manager – Use this template for Threat Manager integration. This is the only supported template for Threat Manager. See the Netwrix Threat Manager Documentation for additional information.
- Custom templates can be created. Select the desired template or create a new template by modifying an existing template within the Syslog Message Template window. The new message template will be named Custom.
-
Add C:\ to the beginning of the reported file paths – Adds ‘C:\” to file paths to be displayed like a Windows file path:
- Display example if checked – C:\Folder\file.txt
- Display example if unchecked – /Folder/file.text
-
Resolve UNC paths – Adds a UNC Path column and a Rename UNC Path column in the generated TSV files
- This option corresponds to the REPORT_UNC_PATH parameter in the INI file. It is disabled by
default. The UNC Path is in the following format:
- For CIFS activity – \[HOST][SHARE][PATH]
- Example CIFS activity – \ExampleHost\TestShare\DocTeam\Temp.txt
- For NFS activity – [HOST]:/[VOLUME]/[PATH]
- Example NFS activity – ExampleHost:/ExampleVolume/DocTeam/Temp.txt
- When the option is enabled, the added columns are populated when a file is accessed remotely through the UNC Path. If a file is accessed locally, these columns are empty. These columns have also been added as Syslog macros.
- When this option is selected, the user needs to provide credentials in the Auditing tab. If
credentials are not provided, the following warning message is displayed:
- Credentials are required for this feature. Provide the credentials in the Auditing tab.
- This option corresponds to the REPORT_UNC_PATH parameter in the INI file. It is disabled by
default. The UNC Path is in the following format:
-
The Test button – Sends a test message to the Syslog server to check the connection. A green check mark or red will determine whether the test message has been sent or failed to send. Messages vary by Syslog protocol:
- UDP – Sends a test message and does not verify connection
- TCP/TLS – Sends test message and verifies connection
- TLS – Shows error if TLS handshake fails
See the Syslog Tab topic for additional information.
Click Finish.
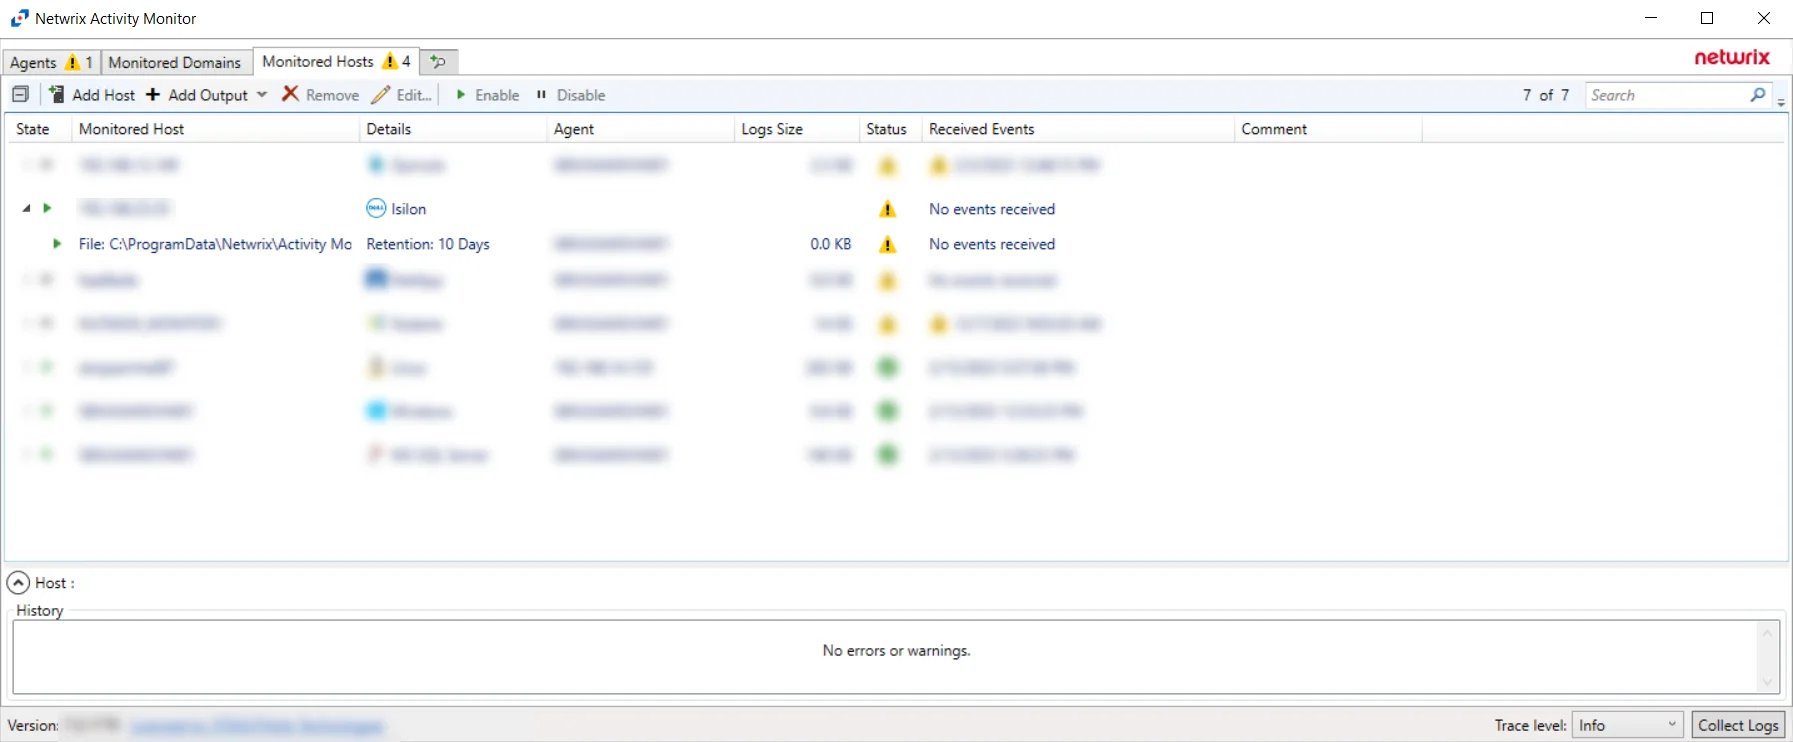
The added Dell Isilon/PowerScale host is displayed in the monitored hosts table. Once a host has been added for monitoring, configure the desired ouptuts. See the Output for Monitored Hosts topic for additional information.
Host Properties for Dell Isilon/PowerScale
Configuration settings can be edited through the tabs in the host’s Properties window. The configurable host properties are:
See the Host Properties Window topic for additional information.
Dell PowerStore
Understanding File Activity Monitoring
The Activity Monitor can be configured to monitor the following:
- Ability to collect all or specific file activity for specific values or specific combinations of values
It provides the ability to feed activity data to SIEM products. The following dashboards have been specifically created for Activity Monitor event data:
- For IBM® QRadar®, see the Netwrix File Activity Monitor App for QRadar for additional information.
- For Splunk®, see the File Activity Monitor App for Splunk for additional information.
It also provides the ability to feed activity data to other Netwrix products:
- Netwrix Threat Prevention
- Netwrix Threat Manager
Prior to adding a Dell PowerStore host to the Activity Monitor, the prerequisites for the target environment must be met. See the Dell PowerStore Activity Auditing Configuration topic for additional information.
Remember, the Activity Agent must be deployed to a Windows server that acts as a proxy for monitoring the target environment.
Add Dell PowerStore Host
Follow the steps to add a Dell PowerStore host to be monitored.
Step 1 – In Activity Monitor, go to the Monitored Hosts tab and click Add. The Add New Host window opens.
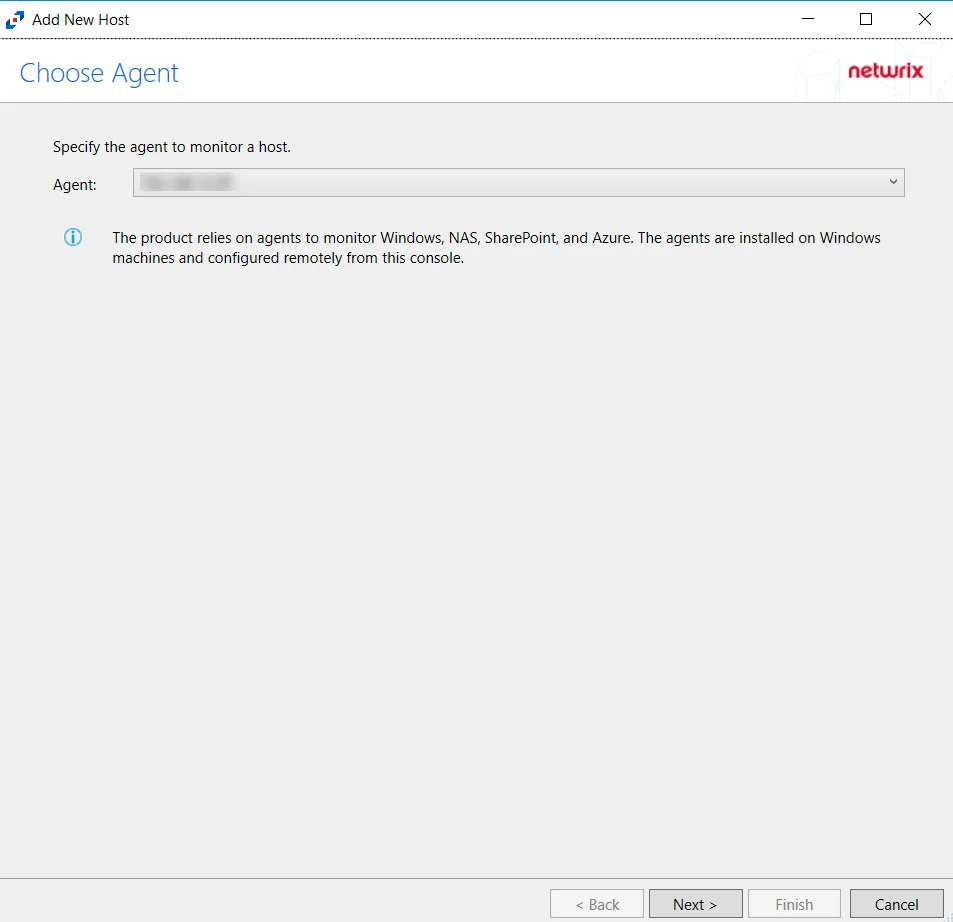
Step 2 – On the Choose Agent page, select the Agent to monitor the file server. ClickNext.
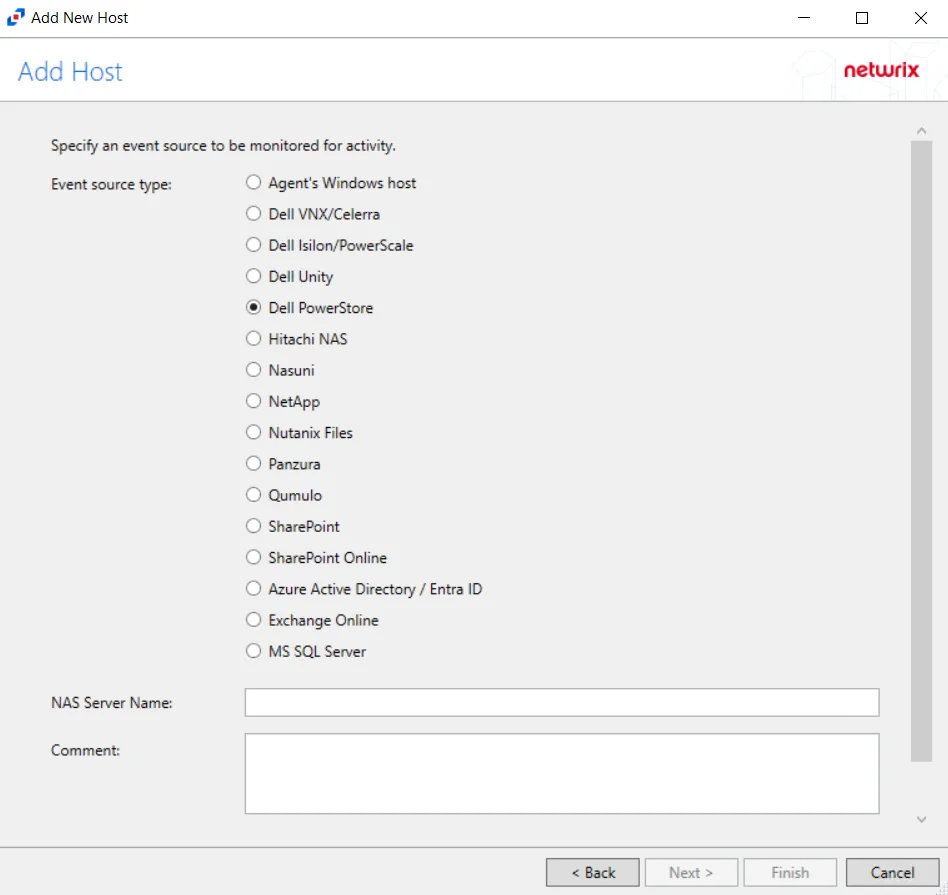
Step 3 – On the Add Host page, select the Dell PowerStore radio button and enter the file server name. Click Next.
NOTE: All Dell event source types must have the CEE Monitor Service installed on the agent in order to collect events. Activity Monitor will detect if the CEE Monitor is not installed and display a warning to install the service. If the CEE Monitor service is installed on a remote machine, manual configuration is required. See the Dell CEE Options Tab topic for additional information.
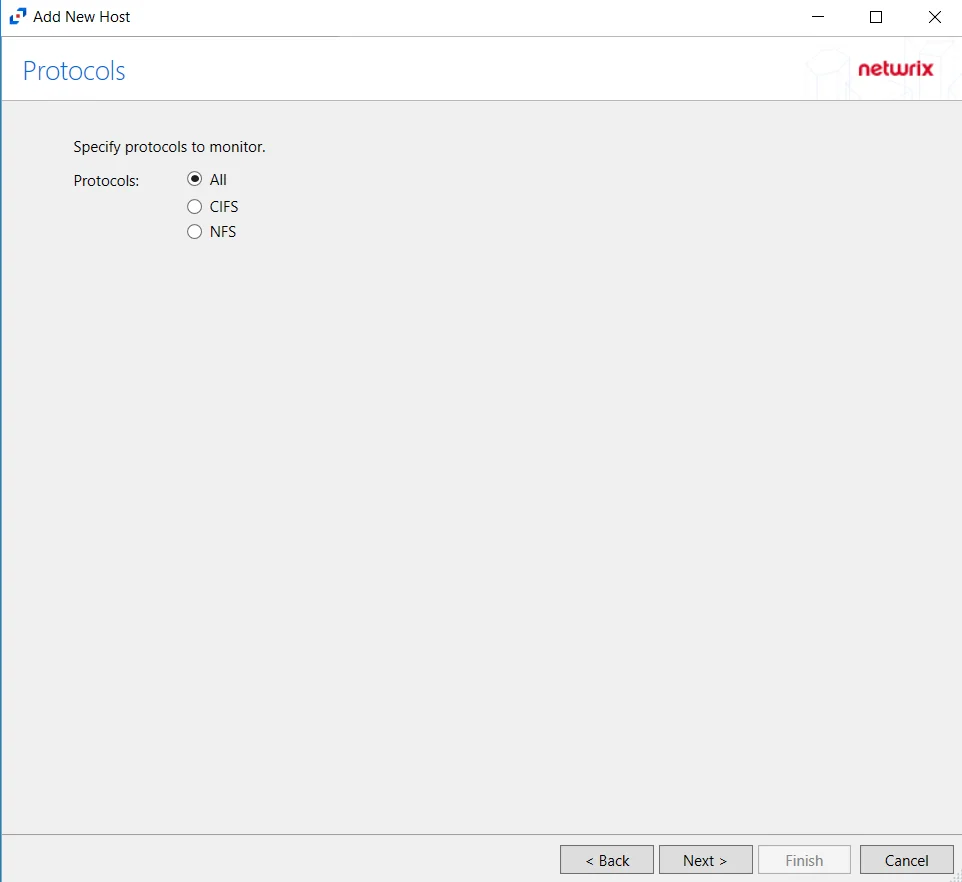
Step 4 – On the Protocols page, specify the protocols to monitor. The list of protocols that can be monitored are, All, CIFS, or NFS. Once a protocol is selected, click Next.
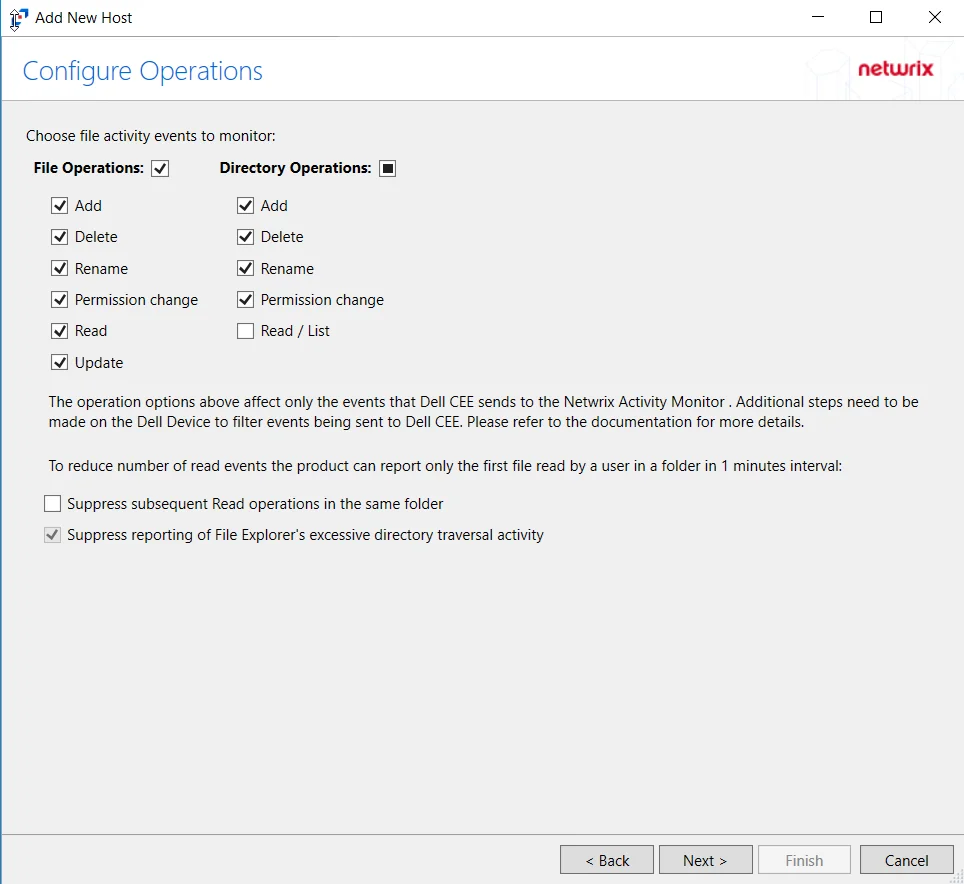
Step 5 – On the Configure Operations page, select the File Operations and Directory Operations to be monitored.
- Suppress reporting of File Explorer's excessive directory traversal activity – Filters out events of excessive directory traversal in File Explorer.
Click Next.
Step 6 – On the Configure Basic Operations page, choose which settings to enable. Select one of the following options:
- Report account names – Adds an Account Name column in the generated TSV files.
- Add C:\ to the beginning of the reported file paths – Adds ‘C:\” to file paths to be displayed
like a Windows file path:
- Display example if checked – C:\Folder\file.txt
- Display example if unchecked – /Folder/file.text
- Report UNC paths – Adds a UNC Path column and a Rename UNC Path column in the generated TSV files
- This option corresponds to the REPORT_UNC_PATH parameter in the INI file. It is disabled by
default. The UNC Path is in the following format:
- For CIFS activity –
\\[HOST]\[SHARE]\[PATH] - Example CIFS activity –
\\ExampleHost\TestShare\DocTeam\Temp.txt - For NFS activity –
[HOST]:/[VOLUME]/[PATH] - Example NFS activity –
ExampleHost:/ExampleVolume/DocTeam/Temp.txt
- For CIFS activity –
- When the option is enabled, the added columns are populated when a file is accessed remotely through the UNC Path. These columns have also been added as Syslog macros.
- This option corresponds to the REPORT_UNC_PATH parameter in the INI file. It is disabled by
default. The UNC Path is in the following format:
- Report operations with millisecond precision – Changes the timestamps of events being recorded in the TSV log file for better ordering of events if multiple events occur within the same second.
Click Next.

Step 7 – On the Where to log the activity page, select whether to send the activity to either a Log File or Syslog Server. Click Next.
NOTE: An option must be selected before moving to the next step.

Step 8 – If Log File is selected on the Where To Log The Activity page, the File Output page can be configured.
-
Specify output file path – Specify the file path where TSV log files are saved on the agent's server. Click the ellipses button (...) to open the Windows Explorer to navigate to a folder destination. Click Test to test if the path works.
-
Period to keep Log files – Log files will be deleted after the period entered as the number of days elapses. The default is 10 days. Use the dropdown to specify whether to keep the Log files for a set amount of Minutes, Hours, or Days. This retention setting applies both to the local files on the agent's server and to the archived files.
-
This log file is for Enterprise Auditor – Enable this option to have Enterprise Auditor collect this monitored host configuration
RECOMMENDED: Identify the configuration to be read by Enterprise Auditor when integration is available.
NOTE: While Activity Monitor can have multiple configurations for log file outputs per host, Enterprise Auditor can only read one of them.
-
Add header to Log files – Adds headers to TSV files. This is used to feed data into Splunk.
NOTE: Enterprise Auditor does not support log files with the header.
Click Next.
Step 9 – If Syslog Server is selected on the Where To Log The Activity page, the Syslog Output page can be configured.
-
Syslog server in SERVER[:PORT] format – Type the Syslog server name with a SERVER:Port format in the textbox.
- The server name can be short name, fully qualified name (FQDN), or IP Address, as long as the organization’s environment can resolve the name format used.
-
Syslog Protocol – Identify the Syslog protocol to be used for the Event stream. The drop-down menu includes:
- UDP
- TCP
- TLS
The TCP and TLS protocols add the Message framing drop-down menu. See the Syslog Tab topic for additional information.
-
The Test button sends a test message to the Syslog server to check the connection. A green check mark or red will determine whether the test message has been sent or failed to send. Messages vary by Syslog protocol:
- UDP – Sends a test message and does not verify connection
- TCP/TLS – Sends test message and verifies connection
- TLS – Shows error if TLS handshake fails
See the Syslog Tab topic for additional information.
Click Finish.
The added Dell PowerStore host is displayed in the monitored hosts table. Once a host has been added for monitoring, configure the desired ouptuts. See the Output for Monitored Hosts topic for additional information.
Host Properties for Dell PowerStore
Configuration settings can be edited through the tabs in the host’s Properties window. The configurable host properties are:
See the Host Properties Window topic for additional information.
Dell Unity
Understanding File Activity Monitoring
The Activity Monitor can be configured to monitor the following:
- Ability to collect all or specific file activity for specific values or specific combinations of values
It provides the ability to feed activity data to SIEM products. The following dashboards have been specifically created for Activity Monitor event data:
- For IBM® QRadar®, see the Netwrix File Activity Monitor App for QRadar for additional information.
- For Splunk®, see the File Activity Monitor App for Splunk for additional information.
It also provides the ability to feed activity data to other Netwrix products:
- Netwrix Enterprise Auditor
- Netwrix Threat Prevention
- Netwrix Threat Manager
Prior to adding a Dell Unity host to the Activity Monitor, the prerequisites for the target environment must be met. See the Dell Unity Activity Auditing Configuration topic for additional information.
Remember, the Activity Agent must be deployed to a Windows server that acts as a proxy for monitoring the target environment.
Add Dell VNX/Celerra Host
Follow the steps to add a Dell Unity host to be monitored.
Step 1 – In Activity Monitor, go to the Monitored Hosts tab and click Add. The Add New Host window opens.
Step 2 – On the Choose Agent page, select the Agent to monitor the storage device.
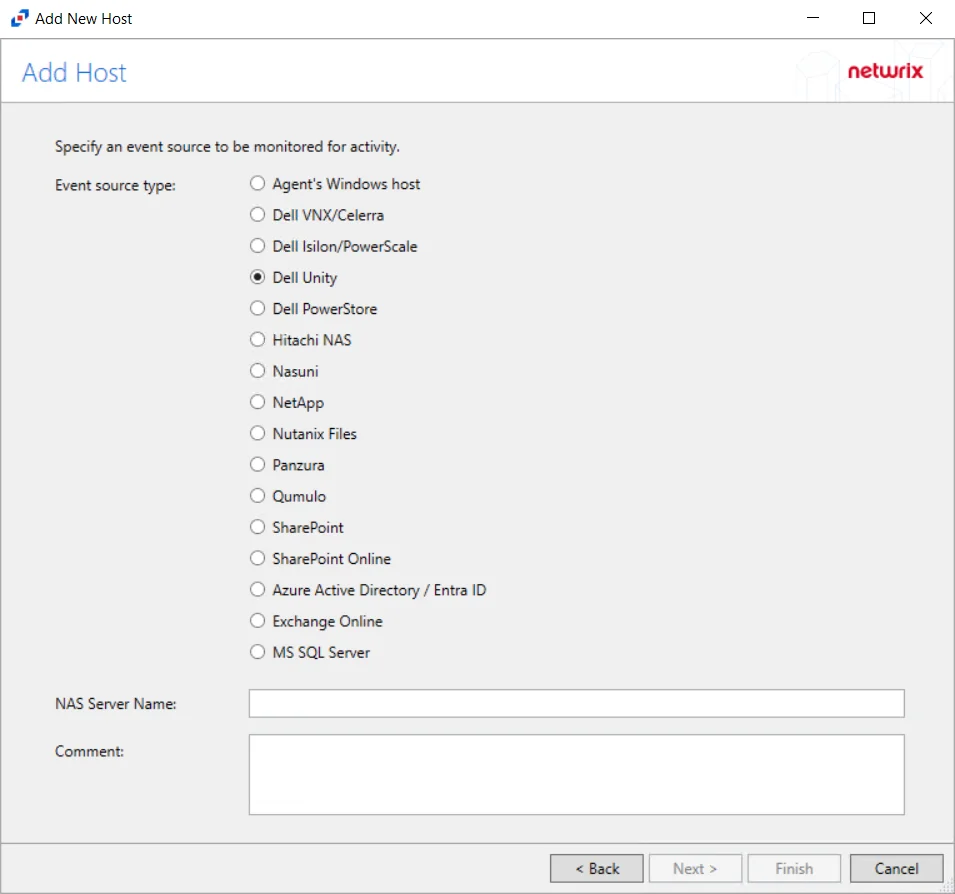
Step 3 – On the Add Host page, select the Dell Unity radio button and enter the NAS Server Name for the device. If desired, add a Comment. Click Next.
NOTE: All Dell event source types must have the CEE Monitor Service installed on the agent in order to collect events. Activity Monitor will detect if the CEE Monitor is not installed and display a warning to install the service. If the CEE Monitor service is installed on a remote machine, manual configuration is required. See the Dell CEE Options Tab topic for additional information.
Step 4 – On the Protocols page, select which protocols to monitor. The protocols that can be monitored are All, CIFS, or NIFS. Click Next.
Step 5 – On the Configure Operations page, select the File Operations and Directory Operations to be monitored. Additional options include:
CAUTION: Suppress Microsoft Office operations on temporary files – Filters out events for Microsoft Office temporary files. When Microsoft Office files are saved or edited, many temporary files are created. With this option enabled, events for these temporary files are ignored. This feature may delay reporting of activity.
Click Next.
Step 6 – On the Configure Basic Options page, choose which settings to enable. The “Log files” are the activity logs created by the activity agent on the proxy host. Select the desired options:
- Report account names – Adds an Account Name column in the generated TSV files
- Add C:\ to the beginning of the reported file paths – Adds ‘C:\” to file paths to be displayed
like a Windows file path:
- Display example if checked – C:\Folder\file.txt
- Display example if unchecked – /Folder/file.text
- Resolve UNC paths – Adds a UNC Path column and a Rename UNC Path column in the generated
TSV files
- This option corresponds to the REPORT_UNC_PATH parameter in the INI file. It is disabled by
default. The UNC Path is in the following format:
- For CIFS activity – \[HOST][SHARE][PATH]
- Example CIFS activity – \ExampleHost\TestShare\DocTeam\Temp.txt
- For NFS activity – [HOST]:/[VOLUME]/[PATH]
- Example NFS activity – ExampleHost:/ExampleVolume/DocTeam/Temp.txt
- When the option is enabled, the added columns are populated when a file is accessed remotely through the UNC Path. If a file is accessed locally, these columns are empty. These columns have also been added as Syslog macros.
- When this option is selected, the user needs to provide credentials in the Auditing tab. If
credentials are not provided, the following warning message is displayed:
- Credentials are required for this feature. Provide the credentials in the Auditing tab.
- This option corresponds to the REPORT_UNC_PATH parameter in the INI file. It is disabled by
default. The UNC Path is in the following format:
- Report operations with millisecond precision – Changes the timestamps of events being recorded in the TSV log file for better ordering of events if multiple events occur within the same second
Click Next.
Step 7 – On the Where To Log The Activity page, select whether to send the activity to either a Log File or Syslog Server. Click Next.
Step 8 – If Log File is selected on the Where To Log The Activity page, the File Output page can be configured.
-
Specify output file path – Specify the file path where log files are saved. Click the ellipses button (...) to open the Windows Explorer to navigate to a folder destination. Click Test to test if the path works.
-
Period to keep Log files – Log files will be deleted after the period entered number of days entered. The default is 10 days. Use the dropdown to specify whether to keep the Log files for a set amount of Minutes, Hours, or Days.
-
This log file is for Enterprise Auditor – Enable this option to have Enterprise Auditor collect this monitored host configuration
RECOMMENDED: Identify the configuration to be read by Netwrix Enterprise Auditor when integration is available.
- While the Activity Monitor can have multiple configurations per host, Enterprise Auditor can only read one of them.
-
Add header to Log files – Adds headers to TSV files. This is used to feed data into Splunk.
Click Next.
Step 9 – If Syslog Server is selected on the Where To Log The Activity page, the Syslog Output page can be configured.
-
Syslog server in SERVER[:PORT] format – Type the Syslog server name with a SERVER:Port format in the text box.
- The server name can be short name, fully qualified name (FQDN), or IP Address, as long as the organization’s environment can resolve the name format used. The Event stream is the activity being monitored according to this configuration for the monitored host.
-
Syslog Protocol – Identify the Syslog protocol to be used for the Event stream. The drop-down menu includes:
- UDP
- TCP
- TLS
The TCP and TLS protocols add the Message framing drop-down menu. See the Syslog Tab topic for additional information.
-
Syslog message template – Click the ellipsis (…) to open the Syslog Message Template window. The following Syslog templates have been provided:
- AlienVault / Generic Syslog
- CEF – Incorporates the CEF message format
- HP Arcsight
- LEEF – Incorporates the LEEF message format
- LogRhythm
- McAfee
- QRadar – Use this template for IBM QRadar integration
- Splunk – Use this template for Splunk integration
- Threat Manager – Use this template for Threat Manager integration. This is the only supported template for Threat Manager. See the Netwrix Threat Manager Documentation for additional information.
- Custom templates can be created. Select the desired template or create a new template by modifying an existing template within the Syslog Message Template window. The new message template will be named Custom.
-
Add C:\ to the beginning of the reported file paths – Adds ‘C:\” to file paths to be displayed like a Windows file path:
- Display example if checked – C:\Folder\file.txt
- Display example if unchecked – /Folder/file.text
-
Resolve UNC paths – Adds a UNC Path column and a Rename UNC Path column in the generated TSV files
- This option corresponds to the REPORT_UNC_PATH parameter in the INI file. It is disabled by
default. The UNC Path is in the following format:
- For CIFS activity – \[HOST][SHARE][PATH]
- Example CIFS activity – \ExampleHost\TestShare\DocTeam\Temp.txt
- For NFS activity – [HOST]:/[VOLUME]/[PATH]
- Example NFS activity – ExampleHost:/ExampleVolume/DocTeam/Temp.txt
- When the option is enabled, the added columns are populated when a file is accessed remotely through the UNC Path. If a file is accessed locally, these columns are empty. These columns have also been added as Syslog macros.
- When this option is selected, the user needs to provide credentials in the Auditing tab. If
credentials are not provided, the following warning message is displayed:
- Credentials are required for this feature. Provide the credentials in the Auditing tab.
- This option corresponds to the REPORT_UNC_PATH parameter in the INI file. It is disabled by
default. The UNC Path is in the following format:
-
The Test button – Sends a test message to the Syslog server to check the connection. A green check mark or red will determine whether the test message has been sent or failed to send. Messages vary by Syslog protocol:
- UDP – Sends a test message and does not verify connection
- TCP/TLS – Sends test message and verifies connection
- TLS – Shows error if TLS handshake fails
See the Syslog Tab topic for additional information.
Click Finish.
The added Dell Unity host is displayed in the monitored hosts table. Once a host has been added for monitoring, configure the desired ouptuts. See the Output for Monitored Hosts topic for additional information.
Host Properties for Dell Unity
Configuration settings can be edited through the tabs in the host’s Properties window. The configurable host properties are:
See the Host Properties Window topic for additional information.
Microsoft Entra ID
Understanding Microsoft Entra ID Activity Monitoring
The Activity Monitor can be configured to monitor the following Microsoft Entra ID (formerly Azure AD) changes:
- Report Sign-In events
- Reports over 800 audit events in different categories, including:
| Administrative Unit | Application Management | Authentication |
| Authorization | Authorization Policy | Contact |
| Device | Device Configuration | Directory Management |
| Entitlement Management | Group Management | Identity Protection |
| Kerberos Domain | Key Management | Label |
| Permission Grant Policy | Policy | Policy Management |
| Resource Management | Role Management | User Management |
- Reports on audit events across different services, including:
| AAD Management UX | Access Reviews | Account Provisioning | Application Proxy |
| Authentication Methods | B2C | Conditional Access | Core Directory |
| Device Registration Service | Entitlement Management | Hybrid Authentication | Identity Protection |
| Invited Users | MIM Service | MyApps | PIM |
| Self-Service Group Management | Self-service Password Management | Terms of Use |
It also provides the ability to feed activity data to other Netwrix products:
- Netwrix Enterprise Auditor
- Netwrix Threat Prevention
- Netwrix Threat Manager
Prior to adding aMicrosoft Entra ID host to the Activity Monitor, the prerequisites for the target environment must be met. See the Microsoft Entra ID Activity Auditing Configuration topic for additional information.
Remember, the Activity Agent must be deployed to a Windows server that acts as a proxy for monitoring the target environment.
Add Azure Active Directory / Entra ID Host
Follow the steps to add a Microsoft Entra ID host to be monitored.
Step 1 – In the Activity Monitor, go to the Monitored Hosts tab and click Add. The Add New Host window opens.
Step 2 – On the Choose Agent page, select the Agent to monitor the storage device.
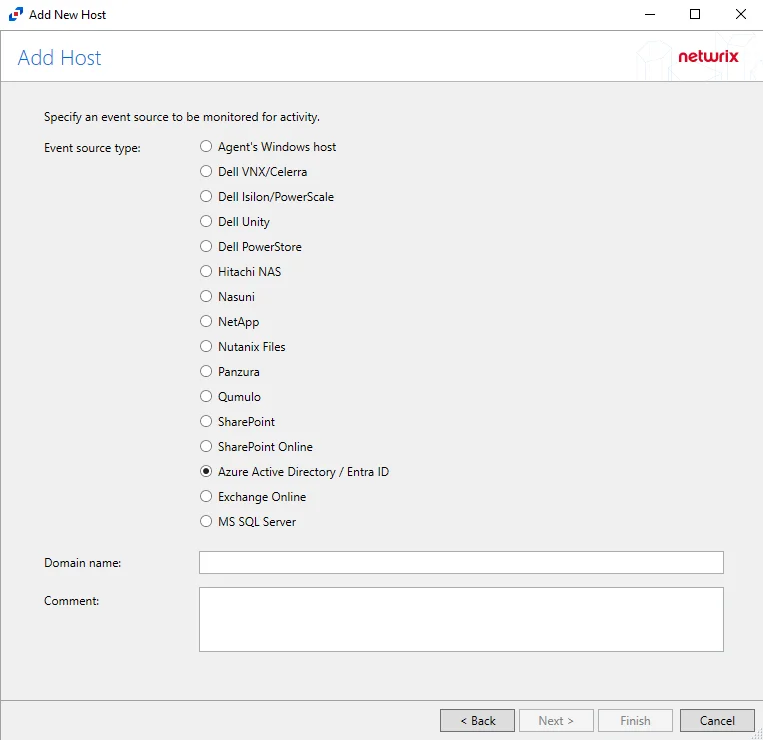
Step 3 – On the Add Host page, select the Azure Active Directory / Entra ID radio button and enter the Primary domain in the Domain name field.
(Optional) Enter a comment for the Microsoft Entra ID host.
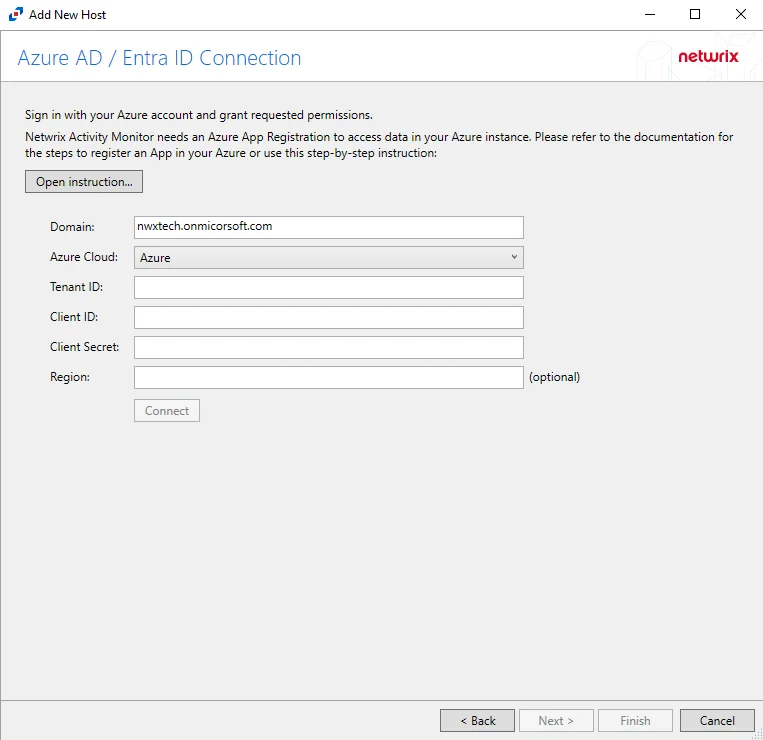
Step 4 – On the Azure AD / Entra ID Connection page, enter a Tenant ID, Client ID, and Client Secret. Optional add a Region. Then click Connect to grant permissions to read the audit log. Click Open Instruction... for steps on registering the Activity Monitor with Microsoft Entra ID. Click Next.
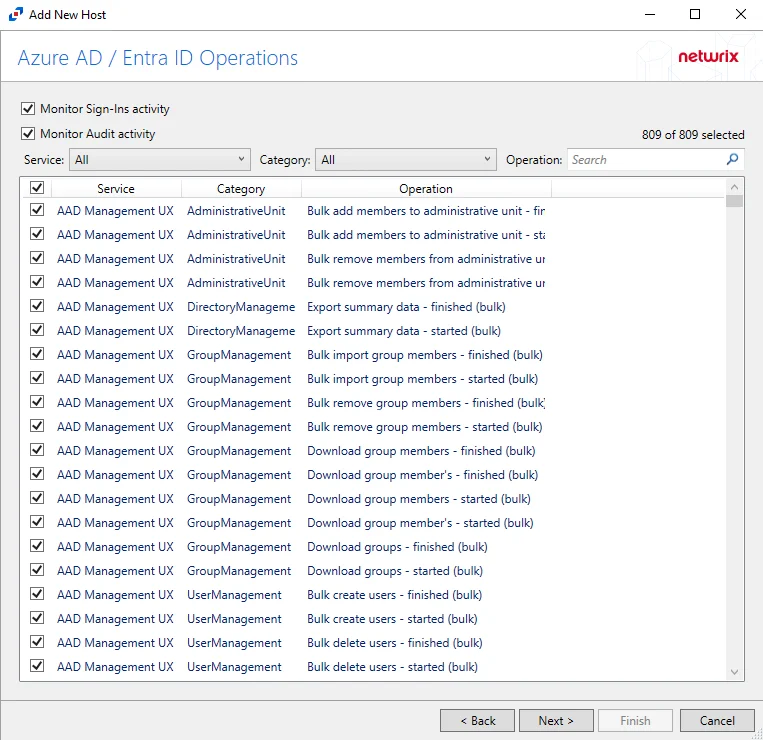
Step 5 – On the Azure AD / Entra ID Operations page, select which audit activity to monitor. Click Next.
Step 6 – On the Where To Log The Activity page, select where to send the activity events:
- Log file – Sends to a TSV or JSON file
- Syslog Server – Sends to a configured SIEM system
- Netwrix Threat Manager (StealthDEFEND) – Sends to Netwrix Threat Manager
Step 7 – If Log Files is selected on the Where To Log The Activity page, the File Output page can be configured. The configurable options are:
-
Specify output file path – Specify the file path where log files are saved. Click the ellipses button (...) to open the Windows Explorer to navigate to a folder destination. Click Test to test if the path works.
-
Period to keep Log files – Log files will be deleted after the period entered number of days entered. The default is 10 days. Use the dropdown to specify whether to keep the Log files for a set amount of Minutes, Hours, or Days.
-
This log file is for Netwrix Enterprise Auditor (StealthAUDIT) – Enable this option to have Netwrix Enterprise Auditor collect this monitored host configuration
RECOMMENDED: Identify the configuration to be read by Netwrix Enterprise Auditor when integration is available.
- While the Activity Monitor can have multiple configurations per host, Netwrix Enterprise Auditor can only read one of them.
Click Next.
Step 8 – If Syslog Server is selected on the Where To Log The Activity page, the Syslog Output page can be configured. The configurable options are:
-
Syslog server in SERVER[:PORT] format – Type the Syslog server name with a SERVER:Port format in the textbox.
- The server name can be short name, fully qualified name (FQDN), or IP Address, as long as the organization’s environment can resolve the name format used. The Event stream is the activity being monitored according to this configuration for the monitored host.
-
Syslog Protocol – Identify the Syslog protocol to be used for the Event stream. The drop-down menu includes:
- UDP
- TCP
- TLS
The TCP and TLS protocols add the Message framing drop-down menu. See the Syslog Tab topic for additional information.
-
The Test button sends a test message to the Syslog server to check the connection. A green check mark or red will determine whether the test message has been sent or failed to send. Messages vary by Syslog protocol:
- UDP – Sends a test message and does not verify connection
- TCP/TLS – Sends test message and verifies connection
- TLS – Shows error if TLS handshake fails
See the Syslog Tab topic for additional information.
Click Finish.
The added Microsoft Entra ID host is displayed in the monitored hosts table. Once a host has been added for monitoring, configure the desired ouptuts. See the Output for Monitored Hosts topic for additional information.
Host Properties for Microsoft Entra ID
Configuration settings can be edited through the tabs in the host’s Properties window. The configurable host properties are:
See the Host Properties Window topic for additional information.
Exchange Online
Prior to adding an Exchange Online host to the Activity Monitor, the prerequisites for the target environment must be met. See the Exchange Online Activity Auditing Configuration topic for additional information.
Remember, the Activity Agent must be deployed to a Windows server that acts as a proxy for monitoring the target environment.
Add Exchange Online Host
Follow the steps to add an Exchange Online host to be monitored.
Step 1 – In the Activity Monitor, go to the Monitored Hosts tab and click Add. The Add New Host window opens.
Step 2 – On the Choose Agent page, select the Agent to monitor the storage device.

Step 3 – On the Add Host page, select the Exchange Online radio button and enter the domain name.
(Optional) Enter a comment for the Exchange Online host.

Step 4 – On the Azure AD / Entra ID Connection page, enter Tenant ID, Client ID, Client Secret, and Region(optional) then click Connect to verify the connection.. Click Open Instruction... for steps on registering the Activity Monitor with Microsoft Azure. Click Next.
Step 5 – On the Exchange Online Operations page, configure the options found in the following tabs:
- Admin Activity
- Mailbox Audit
- DLP
- Other
These options can be configured again in a Exchange Online host's properties window. See the Operations Tab for additional information. Click Next.
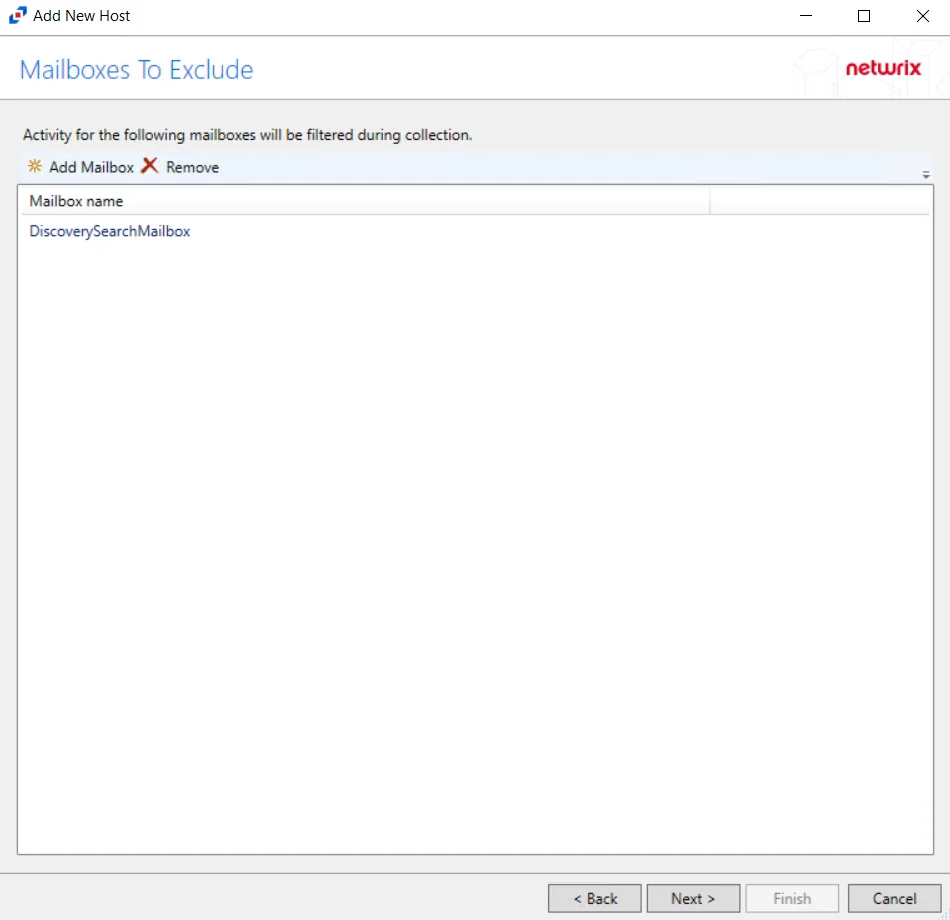
Step 6 – Click Add Mailbox to display the Select User dialog box. Specify the mailboxes that will be filtered during collection. Click Next.
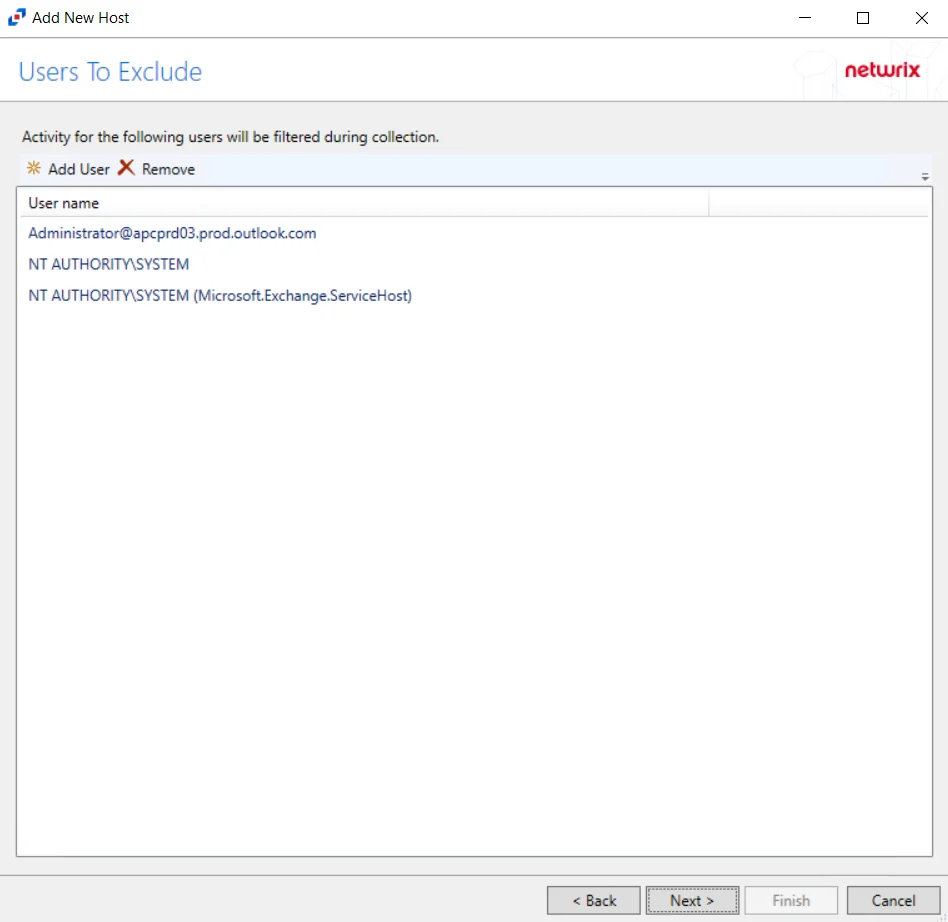
Step 7 – Click Add User to display the Select User dialog box. Specify the user or email that will be filtered during collection. Click Next.
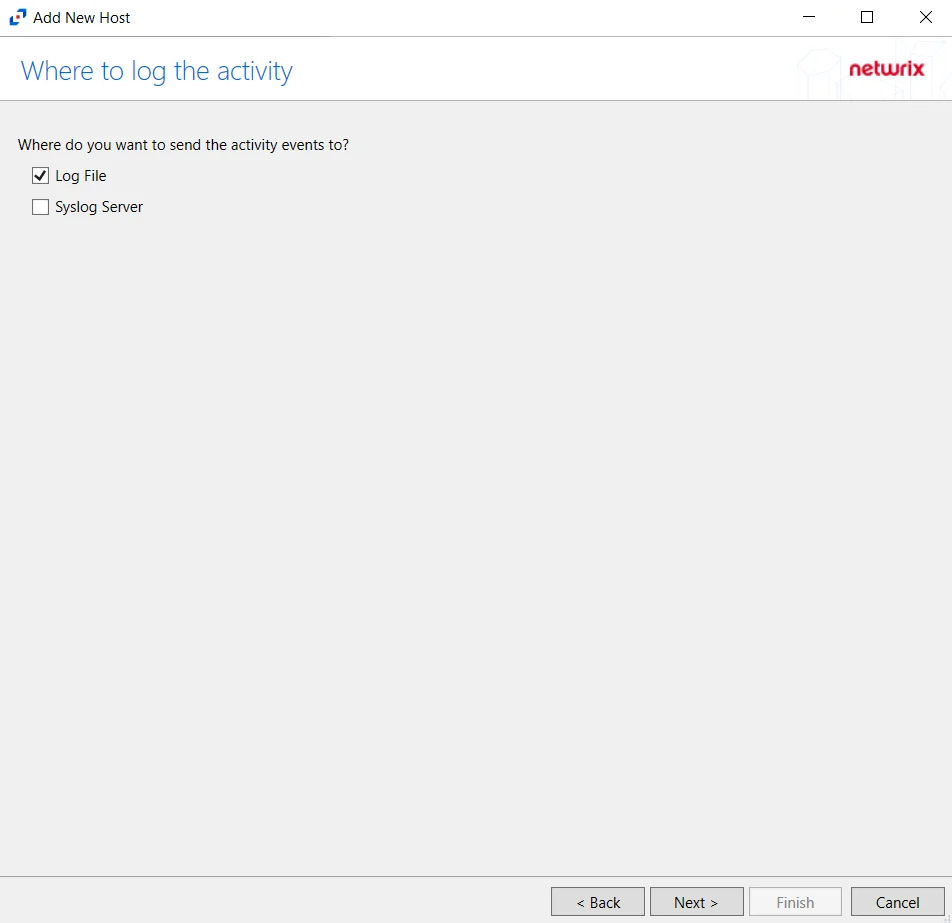
Step 8 – On the Where To Log The Activity page, select whether to send the activity to either a Log File or Syslog Server.
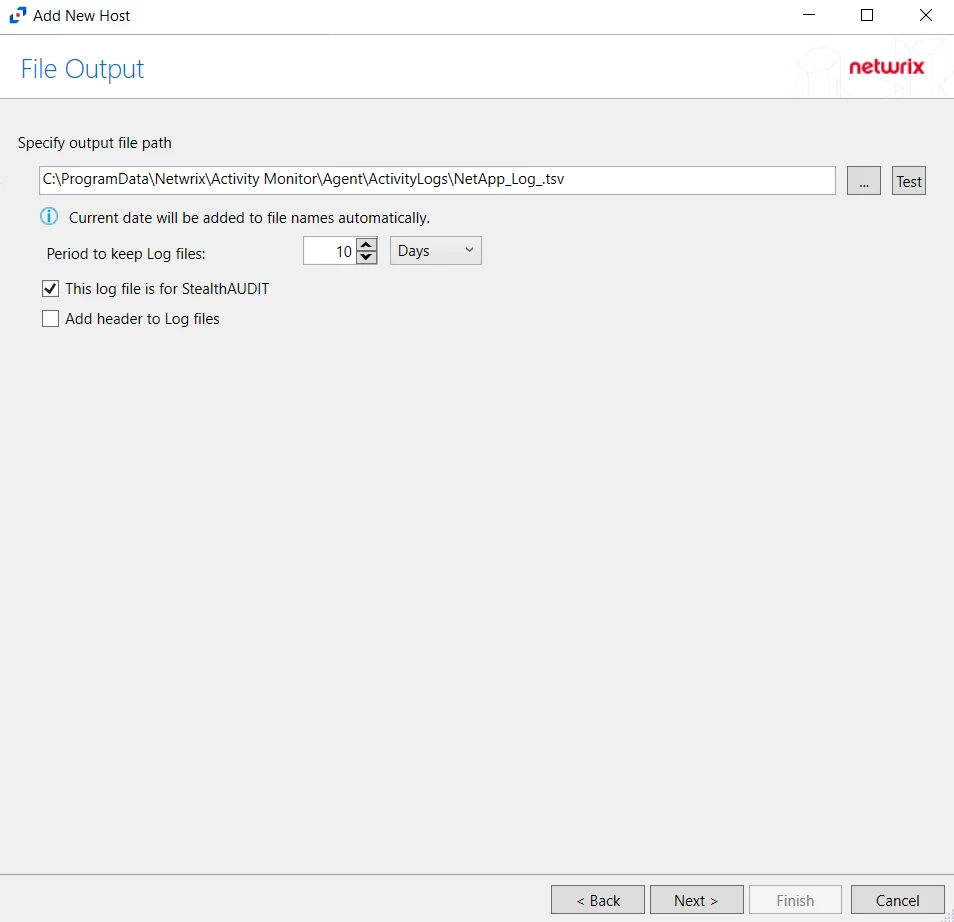
Step 9 – If Log Files is selected on the Where To Log The Activity page, the File Output page can be configured. The configurable options are:
-
Specify output file path – Specify the file path where log files are saved. Click the ellipses button (...) to open the Windows Explorer to navigate to a folder destination. Click Test to test if the path works.
-
Period to keep Log files – Log files will be deleted after the period entered number of days entered. The default is 10 days. Use the dropdown to specify whether to keep the Log files for a set amount of Minutes, Hours, or Days.
-
This log file is for Netwrix Enterprise Auditor (StealthAUDIT) – Enable this option to have Netwrix Enterprise Auditor collect this monitored host configuration
RECOMMENDED: Identify the configuration to be read by Netwrix Enterprise Auditor when integration is available.
- While the Activity Monitor can have multiple outputs per host, Netwrix Enterprise Auditor can only read one of them.
Click Next.
Step 10 – If Syslog Server is selected on the Where To Log The Activity page, the Syslog Output page can be configured. The configurable options are:
-
Syslog server in SERVER[:PORT] format – Type the Syslog server name with a SERVER:Port format in the textbox.
- The server name can be short name, fully qualified name (FQDN), or IP Address, as long as the organization’s environment can resolve the name format used. The Event stream is the activity being monitored according to this configuration for the monitored host.
-
Syslog Protocol – Identify the Syslog protocol to be used for the Event stream. The drop-down menu includes:
- UDP
- TCP
- TLS
The TCP and TLS protocols add the Message framing drop-down menu. See the Syslog Tab topic for additional information.
-
The Test button sends a test message to the Syslog server to check the connection. A green check mark or red will determine whether the test message has been sent or failed to send. Messages vary by Syslog protocol:
- UDP – Sends a test message and does not verify connection
- TCP/TLS – Sends test message and verifies connection
- TLS – Shows error if TLS handshake fails
See the Syslog Tab topic for additional information.
Click Finish.
The added Exchange Online host is displayed in the monitored hosts table. Once a host has been added for monitoring, configure the desired outputs. See the Output for Monitored Hosts topic for additional information.
Host Properties for Exchange Online
Configuration settings can be edited through the tabs in the host’s Properties window. The configurable host properties are:
See the Host Properties Window topic for additional information.
Hitachi
Understanding File Activity Monitoring
The Activity Monitor can be configured to monitor the following:
- Ability to collect all or specific file activity for specific values or specific combinations of values
It provides the ability to feed activity data to SIEM products. The following dashboards have been specifically created for Activity Monitor event data:
- For IBM® QRadar®, see the Netwrix File Activity Monitor App for QRadar for additional information.
- For Splunk®, see the File Activity Monitor App for Splunk for additional information.
It also provides the ability to feed activity data to other Netwrix products:
- Netwrix Enterprise Auditor
- Netwrix Threat Prevention
- Netwrix Threat Manager
Prior to adding a Hitachi host to the Activity Monitor, the prerequisites for the target environment must be met. See the Hitachi Activity Auditing Configuration topic for additional information.
Remember, the Activity Agent must be deployed to a Windows server that acts as a proxy for monitoring the target environment.
Add Hitachi NAS Host
Follow the steps to add a Hitachi host to be monitored.
Step 1 – In Activity Monitor, go to the Monitored Hosts tab and click Add. The Add New Host window opens.
Step 2 – On the Choose Agent page, select the Agent to monitor the storage device. Click Next.
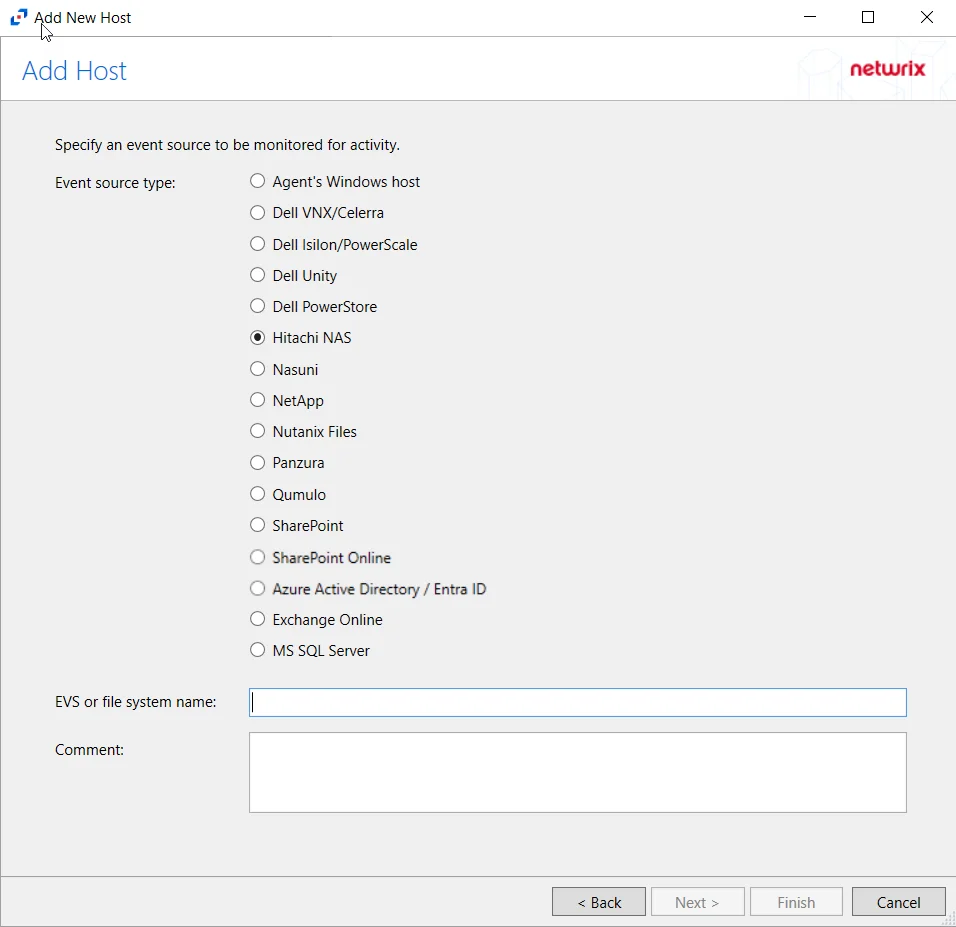
Step 3 – On the Add Host page, select the Hitachi NAS radio button and enter the EVS or file system name for the device. If desired, add a Comment. Click Next.
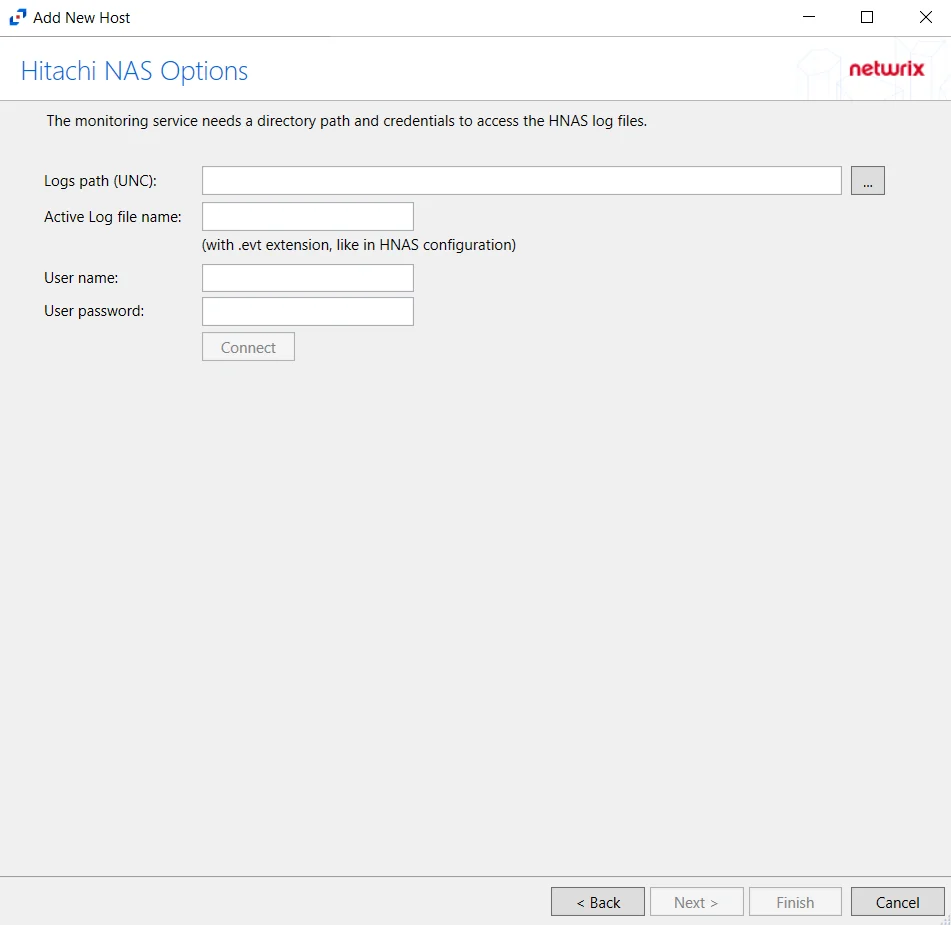
Step 4 – On the Hitachi NAS Options page, enter the Logs path (UNC) and the Active Log file name. Then enter the credentials to access the HNAS Log files. Click Connect to validate the connection with the Hitachi device. Click Next.
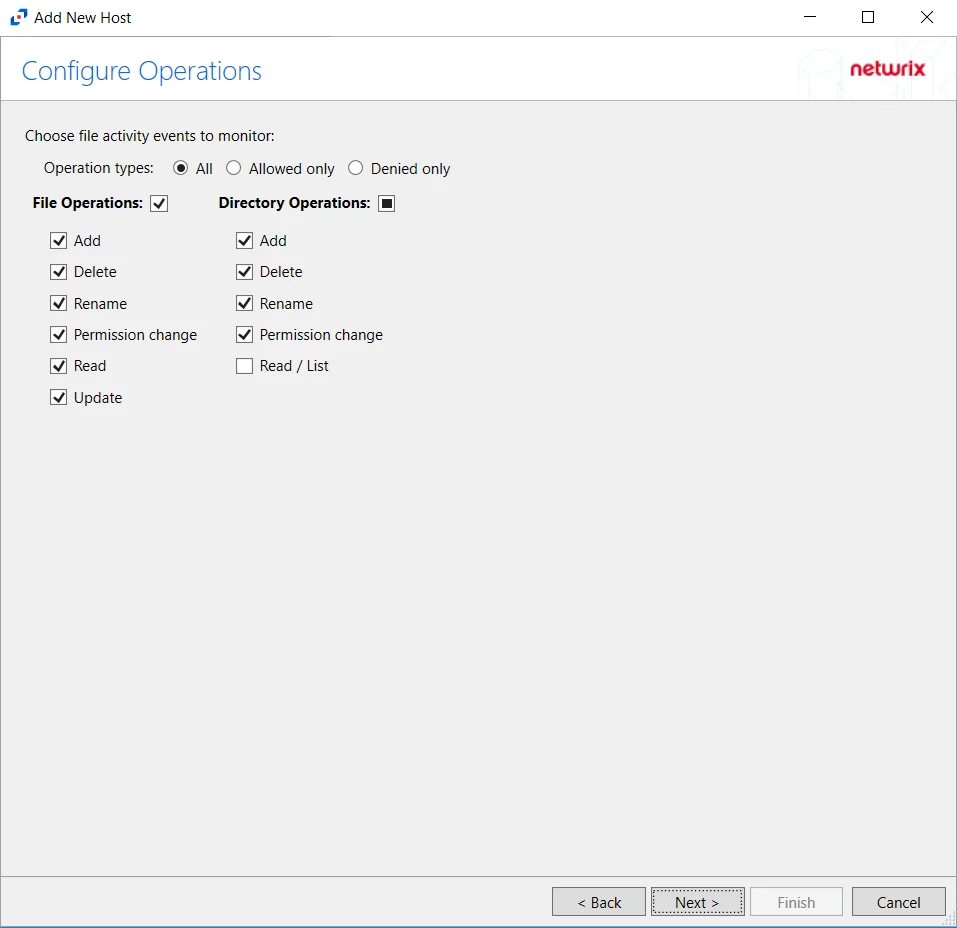
Step 5 – On the Configure Operations page, select the File Operations and Directory Operations to be monitored. Click Next.
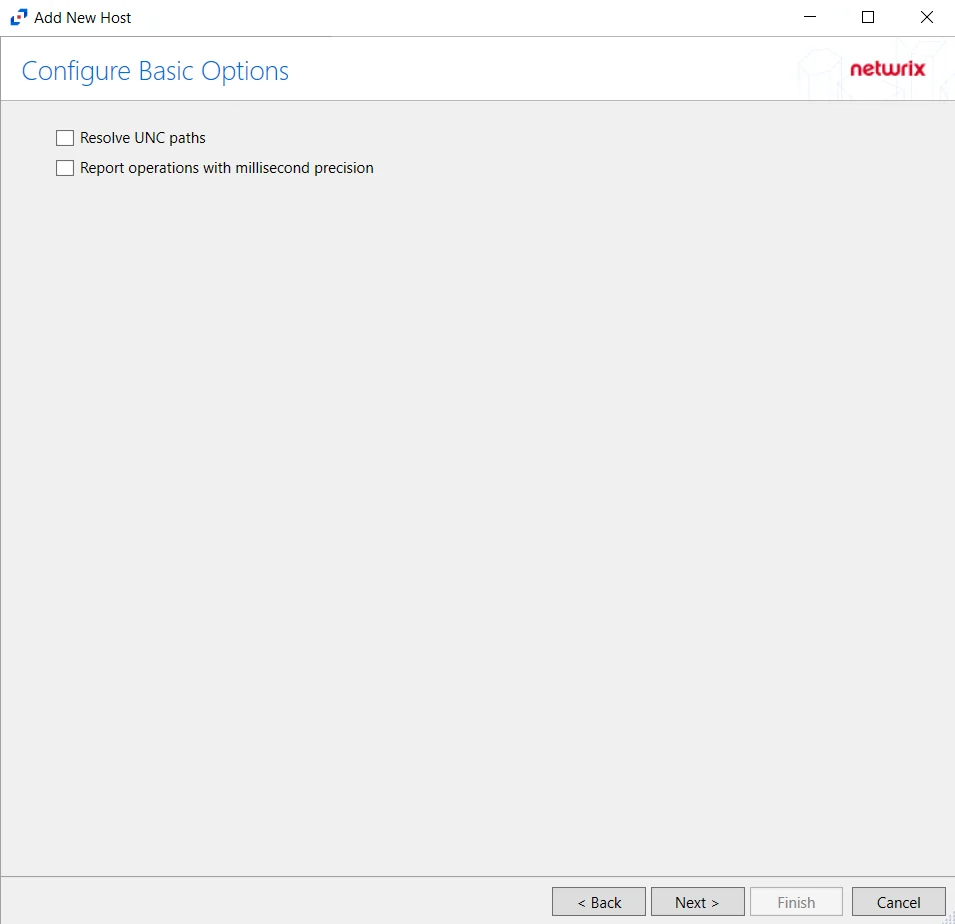
Step 6 – On the Configure Basic Options page, choose which settings to enable. The “Log files” are the activity logs created by the activity agent on the proxy host. Select the desired options:
- Report UNC paths – Adds a UNC Path column and a Rename UNC Path column in the generated TSV files
- This option corresponds to the REPORT_UNC_PATH parameter in the INI file. It is disabled by
default. The UNC Path is in the following format:
- For CIFS activity – \[HOST][SHARE][PATH]
- Example CIFS activity – \ExampleHost\TestShare\DocTeam\Temp.txt
- For NFS activity – [HOST]:/[VOLUME]/[PATH]
- Example NFS activity – ExampleHost:/ExampleVolume/DocTeam/Temp.txt
- When the option is enabled, the added columns are populated when a file is accessed remotely through the UNC Path. If a file is accessed locally, these columns are empty. These columns have also been added as Syslog macros.
- This option corresponds to the REPORT_UNC_PATH parameter in the INI file. It is disabled by
default. The UNC Path is in the following format:
- Report operations with millisecond precision – Changes the timestamps of events being recorded in the TSV log file for better ordering of events if multiple events occur within the same second
Click Next.
Step 7 – On the Where To Log The Activity page, select whether to send the activity to either a Log File) or Syslog Server. Click Next.
Step 8 – If Log File is selected on the Where To Log The Activity page, the File Output page can be configured.
-
Specify output file path – Specify the file path where log files are saved. Click the ellipses button (...) to open the Windows Explorer to navigate to a folder destination. Click Test to test if the path works.
-
Period to keep Log files – Log files will be deleted after the period entered number of days entered. The default is 10 days. Use the dropdown to specify whether to keep the Log files for a set amount of Minutes, Hours, or Days.
-
This log file is for Enterprise Auditor – Enable this option to have Netwrix Enterprise Auditor collect this monitored host configuration
RECOMMENDED: Identify the configuration to be read by Netwrix Enterprise Auditor when integration is available.
- While Activity Monitor can have multiple configurations per host, Netwrix Enterprise Auditor can only read one of them.
-
Add header to Log files – Adds headers to TSV files. This is used to feed data into Splunk.
Click Next.
Step 9 – If Syslog Server is selected on the Where To Log The Activity page, the Syslog Output page can be configured.
-
Syslog server in SERVER[:PORT] format – Type the Syslog server name with a SERVER:Port format in the textbox.
- The server name can be short name, fully qualified name (FQDN), or IP Address, as long as the organization’s environment can resolve the name format used. The Event stream is the activity being monitored according to this configuration for the monitored host.
-
Syslog Protocol – Identify the Syslog protocol to be used for the Event stream. The drop-down menu includes:
- UDP
- TCP
- TLS
The TCP and TLS protocols add the Message framing drop-down menu. See the Syslog Tab topic for additional information.
-
The Test button sends a test message to the Syslog server to check the connection. A green check mark or red will determine whether the test message has been sent or failed to send. Messages vary by Syslog protocol:
- UDP – Sends a test message and does not verify connection
- TCP/TLS – Sends test message and verifies connection
- TLS – Shows error if TLS handshake fails
See the Syslog Tab topic for additional information.
Click Finish.
The added Hitachi host is displayed in the monitored hosts table. Once a host has been added for monitoring, configure the desired ouptuts. See the Output for Monitored Hosts topic for additional information.
Host Properties for Hitachi
Configuration settings can be edited through the tabs in the host’s Properties window. The configurable host properties are:
See the Host Properties Window topic for additional information.
Nasuni
Understanding File Activity Monitoring
The Activity Monitor can be configured to monitor the following:
- Ability to collect all or specific file activity for specific values or specific combinations of values
It provides the ability to feed activity data to SIEM products. The following dashboards have been specifically created for Activity Monitor event data:
- For IBM® QRadar®, see the Netwrix File Activity Monitor App for QRadar for additional information.
- For Splunk®, see the File Activity Monitor App for Splunk for additional information.
It also provides the ability to feed activity data to other Netwrix products:
- Netwrix Enterprise Auditor
- Netwrix Threat Prevention
- Netwrix Threat Manager
Prior to adding a Nasuni Edge Appliance host to the Activity Monitor, the prerequisites for the target environment must be met. See the Nasuni Edge Appliance Activity Auditing Configuration topic for additional information.
Remember, the Activity Agent must be deployed to a Windows server that acts as a proxy for monitoring the target environment.
Add Nasuni Host
Follow the steps to add a Nasuni Edge Appliance host to be monitored.
Step 1 – In Activity Monitor, go to the Monitored Hosts tab and click Add. The Add New Host window opens.
Step 2 – On the Choose Agent page, select the Agent to monitor the storage device. Click Next.

Step 3 – On the Add Host page, select the Nasuni radio button and enter the host name or IP Address of the Nasuni Edge Appliance in the Nasuni Filer textbox. If desired, add a Comment. Click Next.
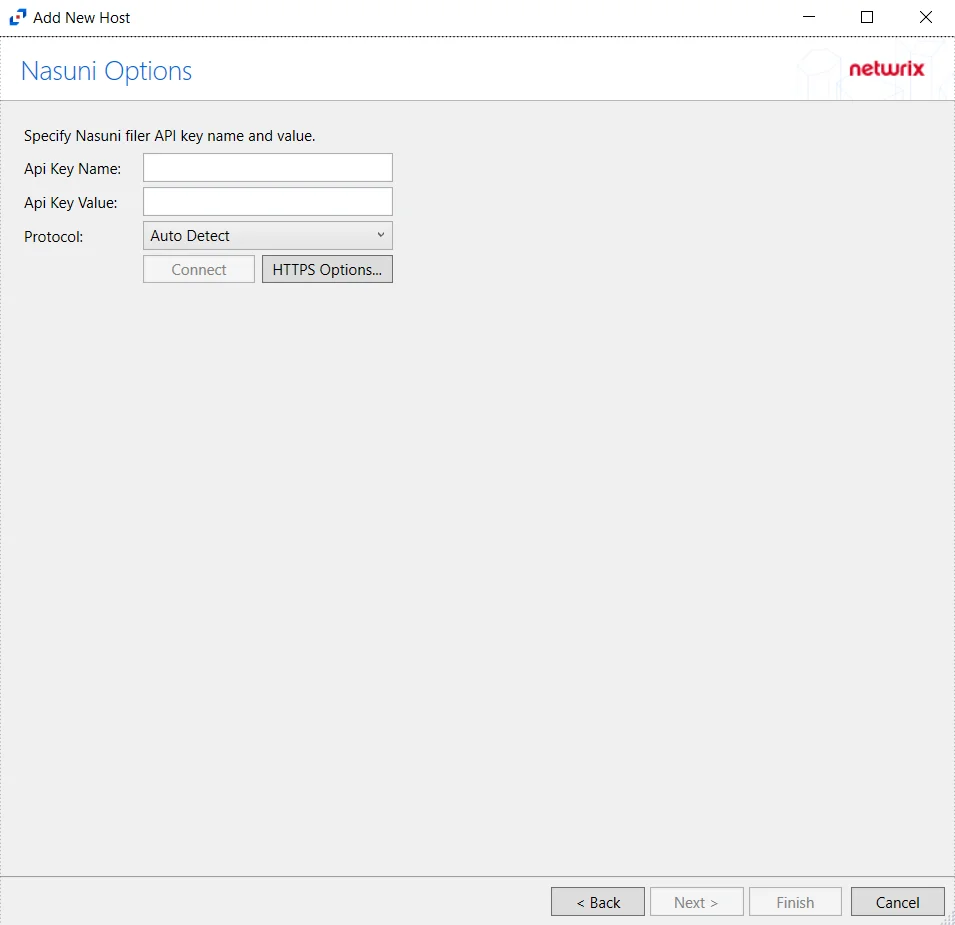
Step 4 – On the Nasuni Options page, enter the API Key Name and the API Key Value. Click Connect to validate the connection with the Nasuni device.
- Protocol – Select from the following options in the drop-down list:
- Auto Detect
- HTTPS
- HTTPS, ignore certificate errors
- Connect – Click to connect using the selected protocol and validate the connection with NetApp
Click Next.
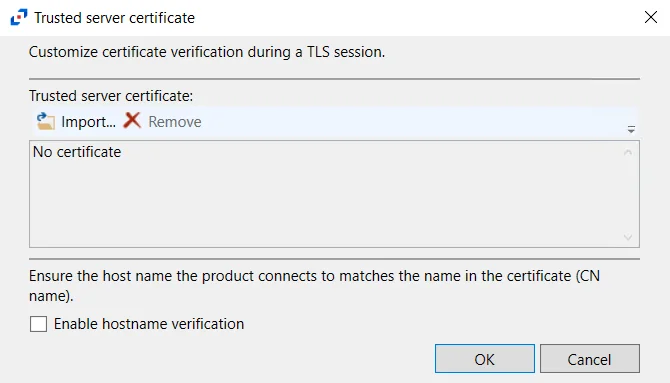
- HTTPS Options – Opens the Trusted server certificate window to customize the certificate
verification during a TLS session
- Import – Click to browse for a trusted server certificate
- Remove – Click to remove the selected trusted server certificate
- Enable hostname verification – Select this checkbox to ensure that the host name the product connects to matches the name in the certificate (CN name)
- Click OK to close the window and save the modifications.
Step 5 – On the Configure Operations page, select the File Operations, Directory Operations, and Link Operations to be monitored. Additional options include:
CAUTION: Enabling the Suppress subsequent Read operations in the same folder option can result in Read events not being monitored.
- Suppress subsequent Read operations in the same folder – Logs only one Read operation when subsequent Read operations occur in the same folder. This option is provided to improve overall performance and reduce output log volume.
- Suppress reporting of File Explorer's excessive directory traversal activity – Filters out events of excessive directory traversal in File Explorer.
- Suppress Microsoft Office operations on temporary files – Filters out events for Microsoft Office temporary files. When Microsoft Office files are saved or edited, many temporary files are created. With this option enabled, events for these temporary files are ignored.
Click Next.

Step 6 – On the Configure Basic Options page, choose which settings to enable. The “Log files” are the activity logs created by the activity agent on the proxy host. Select the desired options:
- Report account names – Adds an Account Name column in the generated TSV files
- Add C:\ to the beginning of the reported file paths – Adds ‘C:\” to file paths to be displayed
like a Windows file path:
- Display example if checked – C:\Folder\file.txt
- Display example if unchecked – /Folder/file.text
- Report UNC paths – Adds a UNC Path column and a Rename UNC Path column in the generated
TSV files
- This option corresponds to the REPORT_UNC_PATH parameter in the INI file. It is disabled by
default. The UNC Path is in the following format:
- For CIFS activity – \[HOST][SHARE][PATH]
- Example CIFS activity – \ExampleHost\TestShare\DocTeam\Temp.txt
- For NFS activity – [HOST]:/[VOLUME]/[PATH]
- Example NFS activity – ExampleHost:/ExampleVolume/DocTeam/Temp.txt
- When the option is enabled, the added columns are populated when a file is accessed remotely through the UNC Path. These columns have also been added as Syslog macros.
- This option corresponds to the REPORT_UNC_PATH parameter in the INI file. It is disabled by
default. The UNC Path is in the following format:
- Report operations with millisecond precision – Changes the timestamps of events being recorded in the TSV log file for better ordering of events if multiple events occur within the same second
Click Next.
Step 7 – On the Where To Log The Activity page, select whether to send the activity to either a Log File) or Syslog Server. Click Next.
Step 8 – If Log File is selected on the Where To Log The Activity page, the File Output page can be configured.
-
Specify output file path – Specify the file path where log files are saved. Click the ellipses button (...) to open the Windows Explorer to navigate to a folder destination. Click Test to test if the path works.
-
Period to keep Log files – Log files will be deleted after the period entered number of days entered. The default is 10 days. Use the dropdown to specify whether to keep the Log files for a set amount of Minutes, Hours, or Days.
-
This log file is for Enterprise Auditor – Enable this option to have Enterprise Auditor collect this monitored host configuration
RECOMMENDED: Identify the configuration to be read by Enterprise Auditor when integration is available.
- While Activity Monitor can have multiple configurations per host, Enterprise Auditor can only read one of them.
-
Add header to Log files – Adds headers to TSV files. This is used to feed data into Splunk.
Click Next.
Step 9 – If Syslog Server is selected on the Where To Log The Activity page, the Syslog Output page can be configured.
-
Syslog server in SERVER[:PORT] format – Type the Syslog server name with a SERVER:Port format in the textbox.
- The server name can be short name, fully qualified name (FQDN), or IP Address, as long as the organization’s environment can resolve the name format used. The Event stream is the activity being monitored according to this configuration for the monitored host.
-
Syslog Protocol – Identify the Syslog protocol to be used for the Event stream. The drop-down menu includes:
- UDP
- TCP
- TLS
The TCP and TLS protocols add the Message framing drop-down menu. See the Syslog Tab topic for additional information.
-
The Test button sends a test message to the Syslog server to check the connection. A green check mark or red will determine whether the test message has been sent or failed to send. Messages vary by Syslog protocol:
- UDP – Sends a test message and does not verify connection
- TCP/TLS – Sends test message and verifies connection
- TLS – Shows error if TLS handshake fails
See the Syslog Tab topic for additional information.
Click Finish.
The added Nasuni host is displayed in the monitored hosts table. Once a host has been added for monitoring, configure the desired ouptuts. See the Output for Monitored Hosts topic for additional information.
Host Properties for Nasuni
Configuration settings can be edited through the tabs in the host’s Properties window. The configurable host properties are:
See the Host Properties Window topic for additional information.
NetApp
Understanding File Activity Monitoring
The Activity Monitor can be configured to monitor the following:
- Ability to collect all or specific file activity for specific values or specific combinations of values
It provides the ability to feed activity data to SIEM products. The following dashboards have been specifically created for Activity Monitor event data:
- For IBM® QRadar®, see the Netwrix File Activity Monitor App for QRadar for additional information.
- For Splunk®, see the File Activity Monitor App for Splunk for additional information.
It also provides the ability to feed activity data to other Netwrix products:
- Netwrix Enterprise Auditor
- Netwrix Threat Prevention
- Netwrix Threat Manager
Prior to adding a NetApp Data ONTAP host to the Activity Monitor, the prerequisites for the target environment must be met. See the NetApp Data ONTAP Cluster-Mode Activity Auditing Configuration topic or the NetApp Data ONTAP 7-Mode Activity Auditing Configuration topic in the for additional information.
Remember, the Activity Agent must be deployed to a Windows server that acts as a proxy for monitoring the target environment.
Add NetApp Host
Follow the steps to add a NetApp Data ONTAP host to be monitored.
Step 1 – In Activity Monitor, go to the Monitored Hosts tab and click Add. The Add New Host window opens.
Step 2 – On the Choose Agent page, select the Agent to monitor the storage device. Click Next.

Step 3 – On the Add Host page, select the NetApp radio button. Then, in the NetApp Filer/SVM textbox, enter the following information:
- Cluster-Mode devices – Enter the NetApp Filer/SVM
- 7-Mode devices – Enter the NetApp DNS name. If using vFilers, then it is necessary to use the vFiler name here.
Click Next.
CAUTION: Cluster-Mode is case sensitive. The case of the Filer or SVM name must match exactly to how it is in NetApp's FPolicy configuration.
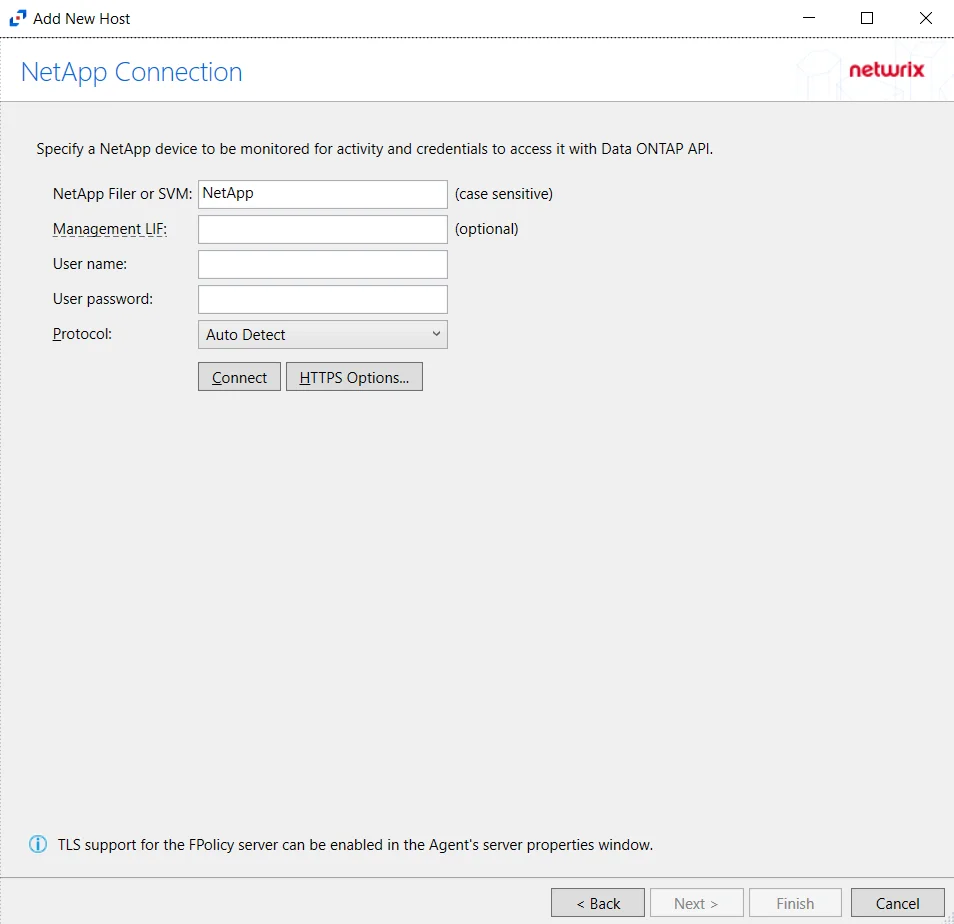
Step 4 – On the NetApp Connection page, enter the following:
- NetApp Filer or SVM – Enter the name of the NetApp Filer or SVM. The name is case sensitive.
- Management LIF – (Optional) If using Cluster Management LIF, a Management LIF can be specified if SVM Management LIF is not used (Vserver Tunneling)
- User name – Enter the user name for the credentials to connect to the NetApp server
- User password – Enter the password for the credentials to connect to the NetApp server
- Protocol – Select from the following options in the drop-down list:
- Auto Detect
- HTTPS
- HTTPS, ignore certificate errors
- HTTP
- Connect – Click to connect using the selected protocol and validate the connection with NetApp
Click Next.
- HTTPS Options – Opens the Trusted server certificate window to customize the certificate
verification during a TLS session
- Import – Click to browse for a trusted server certificate
- Remove – Click to remove selected trusted server certificate
- Enable hostname verification – Select this checkbox to ensure that the host name the product connects to matches the name in the certificate (CN name)
- Click OK to close the window and save the modifications.
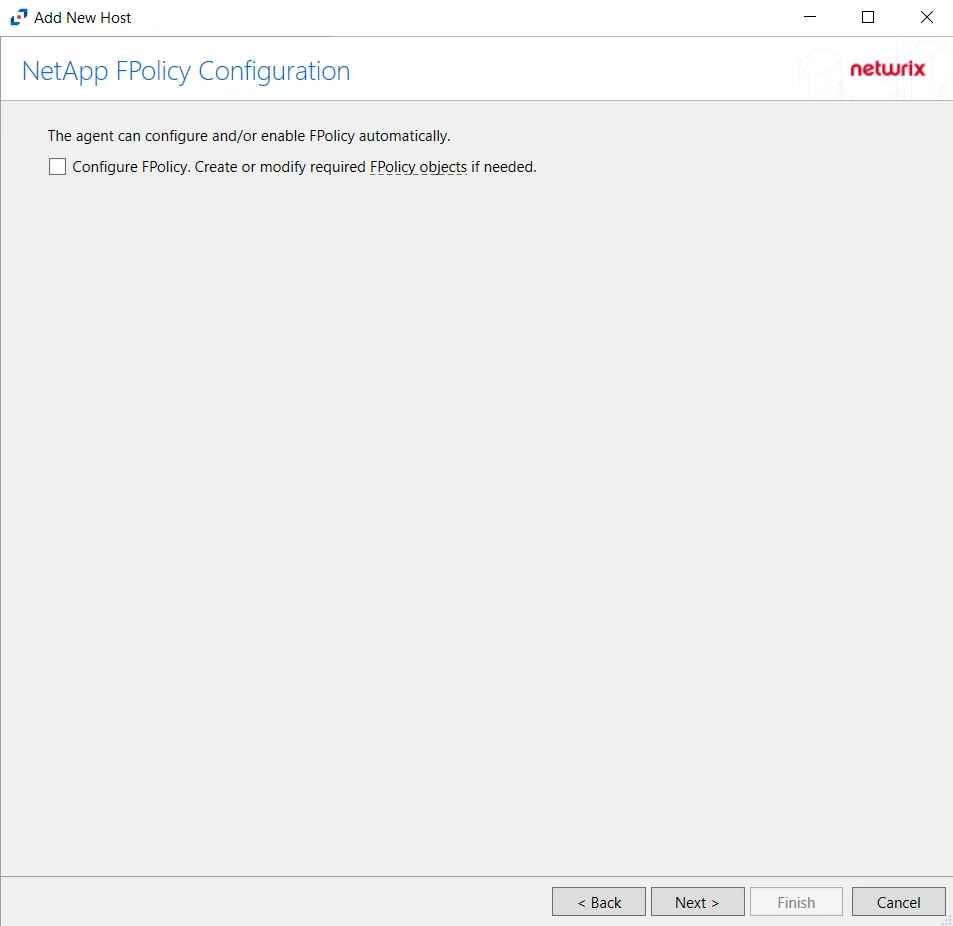
Step 5 – On the NetApp Mode FPolicy Configuration page, choose whether or not to automatically configure FPolicy through Activity Monitor. If that is desired, check the Configure FPolicy option. Any additional permissions required are listed. Be sure to select the appropriate file protocol to configure the FPolicy.
CAUTION: NetApp FPolicy Enable and Connect requires the provisioned user account to have full permissions. For Cluster-mode devices, the credentials are identified as ‘Employing the “Configure FPolicy” Option’.
Additional permissions that are required if enabling Configure FPolicy are:
- Command
vserver fpolicy- Access level:All - Command
security certificate install- Access levelAll(Need for FPolicy TLS only)
Click Next.
Important Notes
RECOMMENDED: For NetApp Cluster-Mode, create a tailored FPolicy manually. If manually configuring the FPolicy, do not select the ConfigureFPolicy checkbox.
If automatic configuration is selected, proceed to the Configure Privileged Access section after successfully adding the host.
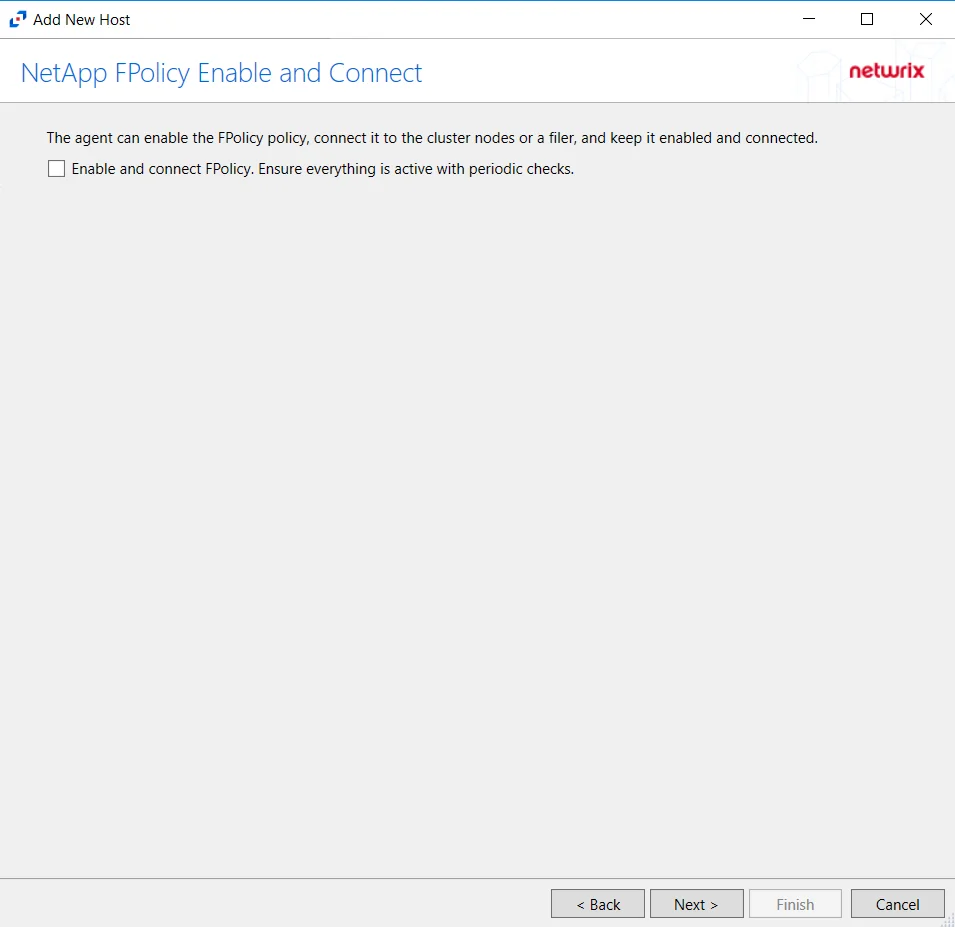
The options on the Configure Operations page require the provisioned user account to have, at a minimum, the less privileged permissions. For Cluster-mode devices, the credentials are identified as ‘Employing the “Enable and connect FPolicy” Option’.
CAUTION: On the NetApp FPolicy Enable and Connect page, choose whether or not to Enable and connect FPolicy, which will “Ensure everything is active with periodic checks.”
Additional permissions that are required if enabling Enable and connect FPolicy are:
- Command
vserver fpolicy disable- Access levelAll - Command
vserver fpolicy enable- Access levelAll - Command
vserver fpolicy engine-connect- Access levelAll - Command
network interface- Access levelreadonly
Important Notes
RECOMMENDED: Enable this functionality. Without this option enabled, it is necessary to manually connect the FPolicy every time it is disconnected for any reason. For reliable, high availability file monitoring, use this option.
Click Next.
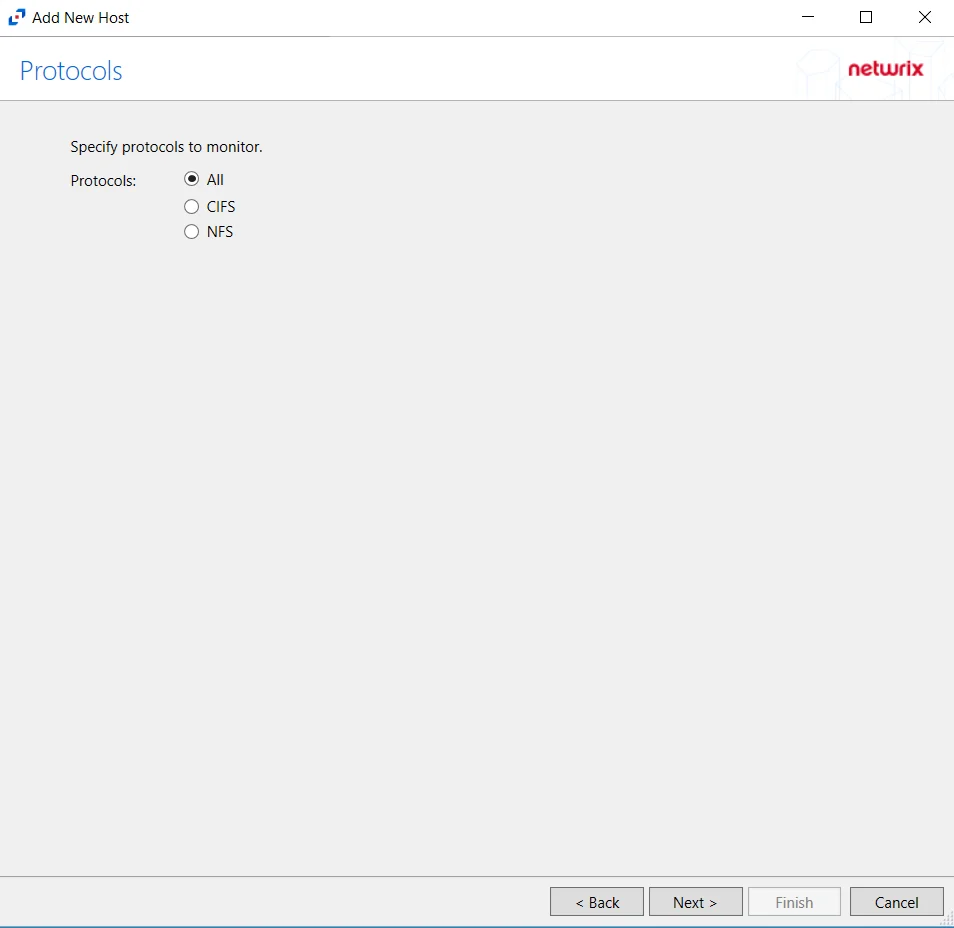
Step 6 – On the Protocols page, select which protocols to monitor. The protocols that can be monitored are:
- All
- CIFS
- NFS
Click Next.
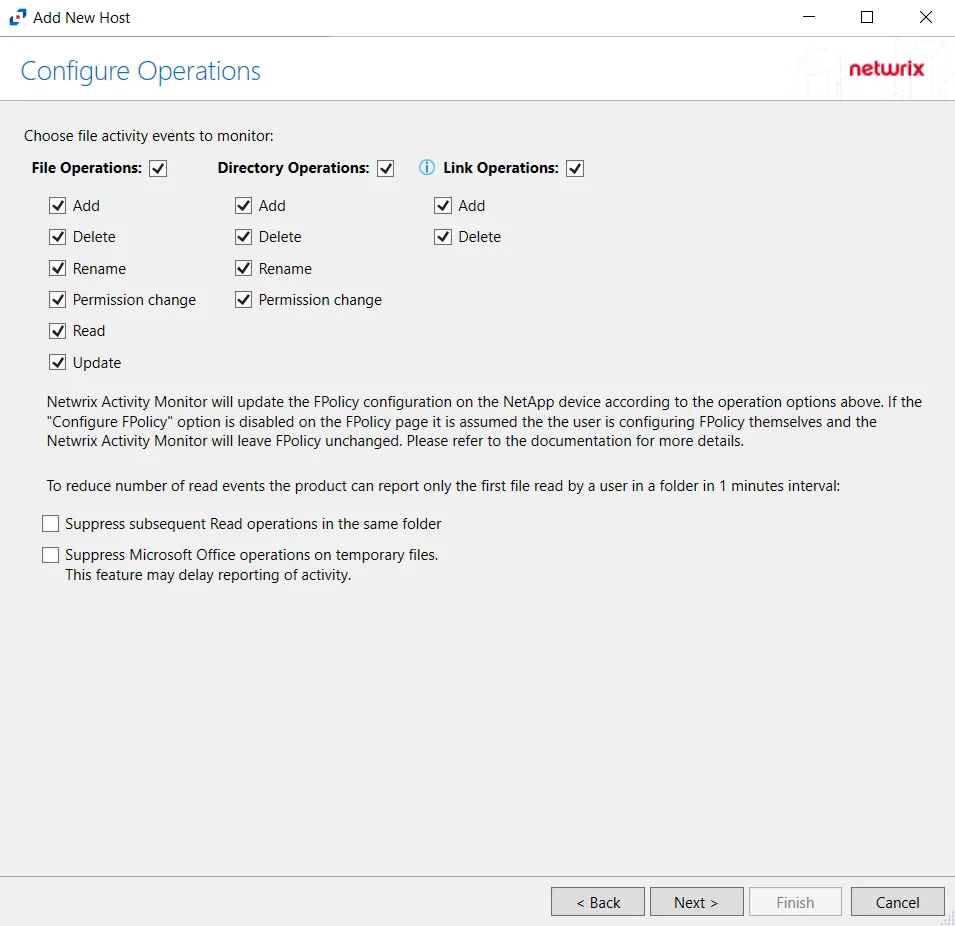
Step 7 – On the Configure Operations page, select the File Operations and Directory Operations to be monitored.
NOTE: NetApp Data ONTAP Cluster-Mode Device folders are now readable by checking the Read / List option listed under Directory Operations. This option is also accessible within the NetApp server’s properties > Operations tab.
If the Configure FPolicy option is enabled, then Activity Monitor updates the FPolicy according to these settings. If it was not enabled, then the manually configured FPolicy must be set to monitor these operations. Only operations being monitored by the FPolicy are available to the activity agent.
Additional options include:
CAUTION: Enabling the Suppress subsequent Read operations in the same folder option can result in Read events not being monitored.
- Suppress subsequent Read operations in the same folder – Logs only one Read operation when subsequent Read operations occur in the same folder. This option is provided to improve overall performance and reduce output log volume.
- Suppress Microsoft Office operations on temporary files – Filters out events for Microsoft Office temporary files. When Microsoft Office files are saved or edited, many temporary files are created. With this option enabled, events for these temporary files are ignored.
Click Next.

Step 8 – On the Configure Basic Options page, choose which settings to enable. The “Log files” are the activity logs created by the activity agent on the proxy host. Select the desired options:
- Report account names – Adds an Account Name column in the generated TSV files
- Add C:\ to the beginning of the reported file paths – Adds ‘C:\” to file paths to be displayed
like a Windows file path:
- Display example if checked – C:\Folder\file.txt
- Display example if unchecked – /Folder/file.text
- Report UNC paths – Adds a UNC Path column and a Rename UNC Path column in the generated TSV files
- This option corresponds to the REPORT_UNC_PATH parameter in the INI file. It is disabled by
default. The UNC Path is in the following format:
- For CIFS activity –
\\[HOST]\[SHARE]\[PATH] - Example CIFS activity –
\\ExampleHost\TestShare\DocTeam\Temp.txt - For NFS activity –
[HOST]:/[VOLUME]/[PATH] - Example NFS activity –
ExampleHost:/ExampleVolume/DocTeam/Temp.txt
- For CIFS activity –
- When the option is enabled, the added columns are populated when a file is accessed remotely through the UNC Path. If a file is accessed locally, these columns are empty. These columns have also been added as Syslog macros.
- This option corresponds to the REPORT_UNC_PATH parameter in the INI file. It is disabled by
default. The UNC Path is in the following format:
- Report operations with millisecond precision – Changes the timestamps of events being recorded in
the TSV log file for better ordering of events if multiple events occur within the same second
- Enterprise Auditor 8.1+ is required for this feature
Click Next.
Step 9 – On the Where To Log The Activity page, select whether to send the activity to either a Log File or Syslog Server. Click Next.
Step 10 – If Log File) is selected on the Where To Log The Activity page, the File Output page can be configured.
-
Specify output file path – Specify the file path where log files are saved. Click the ellipses button (...) to open the Windows Explorer to navigate to a folder destination. Click Test to test if the path works.
-
Period to keep Log files – Log files will be deleted after the period entered number of days entered. The default is 10 days. Use the dropdown to specify whether to keep the Log files for a set amount of Minutes, Hours, or Days.
-
This log file is for Enterprise Auditor – Enable this option to have Netwrix Enterprise Auditor collect this monitored host configuration
RECOMMENDED: Identify the configuration to be read by Netwrix Enterprise Auditor when integration is available.
- While Activity Monitor can have multiple configurations per host, Netwrix Enterprise Auditor can only read one of them.
-
Add header to Log files – Adds headers to TSV files. This is used to feed data into Splunk.
Click Next.
Step 11 – If Syslog Server is selected on the Where To Log The Activity page, the Syslog Output page can be configured.
-
Syslog server in SERVER[:PORT] format – Type the Syslog server name with a SERVER:Port format in the textbox.
- The server name can be short name, fully qualified name (FQDN), or IP Address, as long as the organization’s environment can resolve the name format used. The Event stream is the activity being monitored according to this configuration for the monitored host.
-
Syslog Protocol – Identify the Syslog protocol to be used for the Event stream. The drop-down menu includes:
- UDP
- TCP
- TLS
The TCP and TLS protocols add the Message framing drop-down menu. See the Syslog Tab topic for additional information.
-
The Test button sends a test message to the Syslog server to check the connection. A green check mark or red will determine whether the test message has been sent or failed to send. Messages vary by Syslog protocol:
- UDP – Sends a test message and does not verify connection
- TCP/TLS – Sends test message and verifies connection
- TLS – Shows error if TLS handshake fails
See the Syslog Tab topic for additional information.
Click Finish.
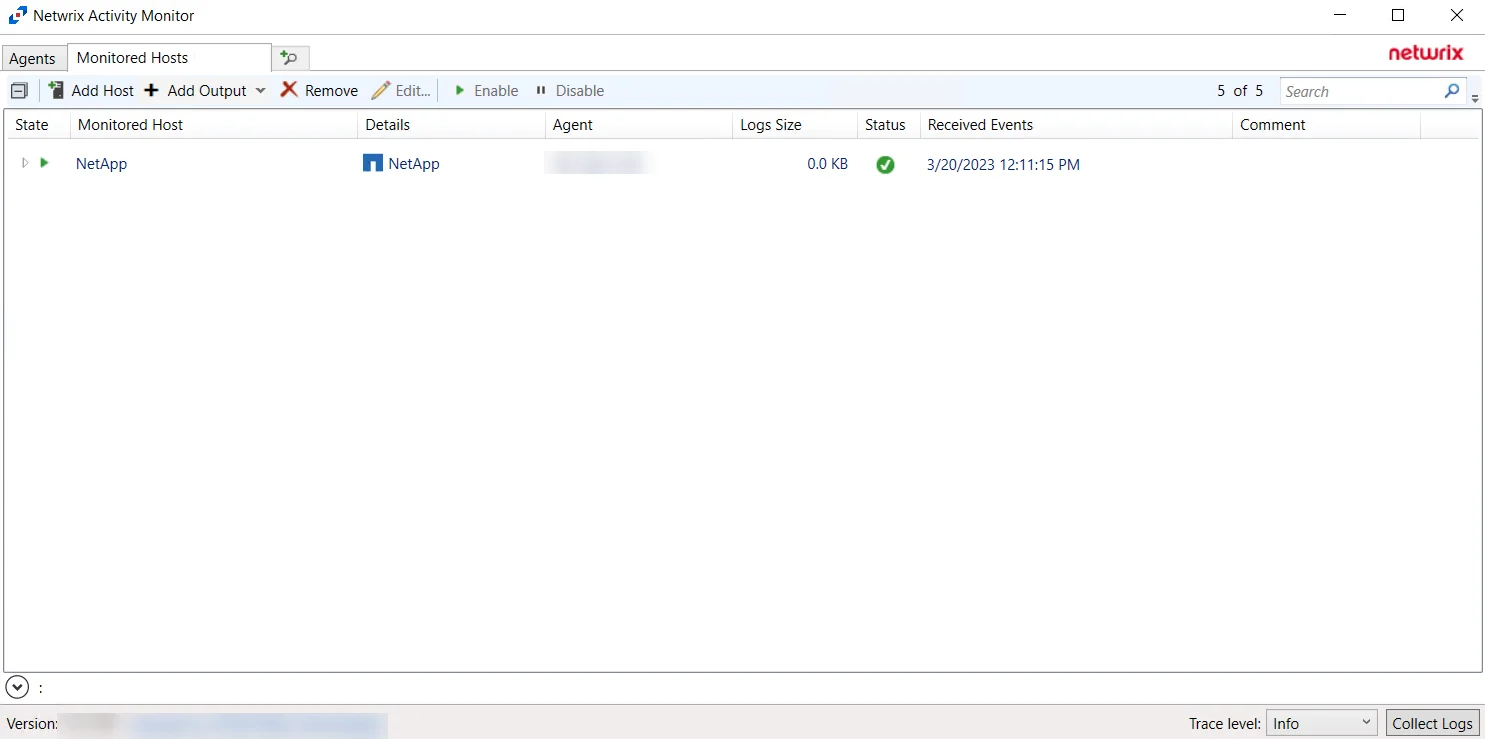
The added NetApp host is displayed in the monitored hosts table. Once a host has been added for monitoring, configure the desired ouptuts. See the Output for Monitored Hosts topic for additional information.
Remember, if automatic configuration of the FPolicy was selected, it is necessary to Configure Privileged Access.
Configure Privileged Access
If automatic configuration of the FPolicy is used for NetApp Data ONTAP Cluster-Mode devices, it is necessary to configure privileged access. Follow the steps to configure privileged access. Remember, this requires the provisioned user account to have full permissions, identified as the credentials ‘Employing the “Configure FPolicy” Option’.
Step 1 – On to the Monitored Hosts tab, select the desired host and click Edit. The host’s Properties window opens.
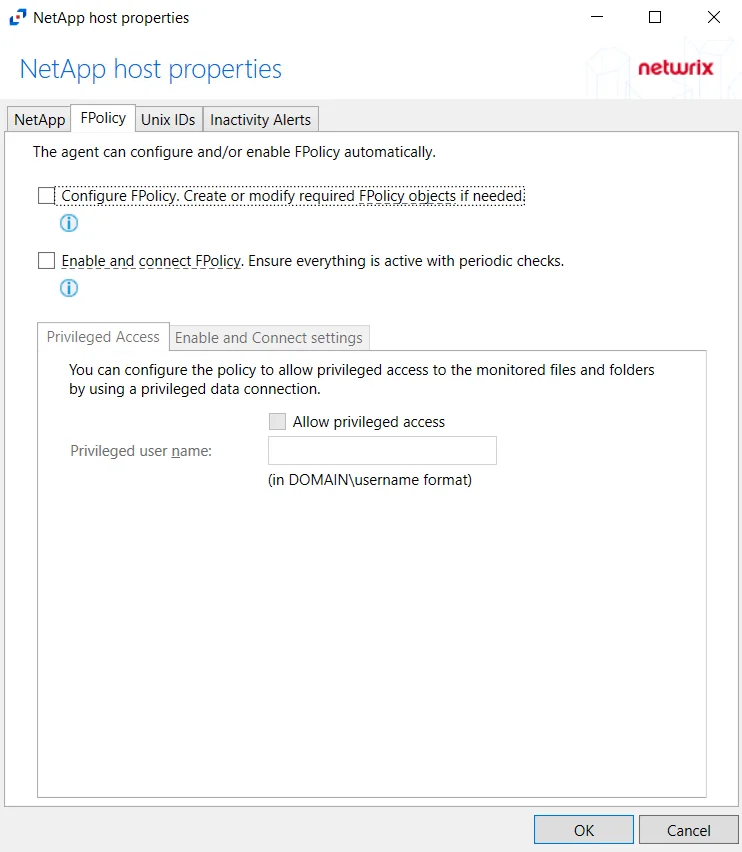
Step 2 – On the FPolicy tab, select the Privileged Access tab. Select the Allow privileged access checkbox and provide the Privileged user name in the textbox.
NOTE: This option is only available if the Configure FPolicy option is enabled.
Privileged access must be allowed and configured with appropriate credentials to leverage Enterprise Auditor permission (FSAA) scans for this NetApp device
For information on the other options for this tab, see the FPolicy Tab section.
Host Properties for NetApp
Configuration settings can be edited through the tabs in the host’s Properties window. The configurable host properties are:
See the Host Properties Window topic for additional information.
Nutanix
Understanding File Activity Monitoring
The Activity Monitor can be configured to monitor the following:
- Ability to collect all or specific file activity for specific values or specific combinations of values
It provides the ability to feed activity data to SIEM products. The following dashboards have been specifically created for Activity Monitor event data:
- For IBM® QRadar®, see the Netwrix File Activity Monitor App for QRadar for additional information.
- For Splunk®, see the File Activity Monitor App for Splunk for additional information.
It also provides the ability to feed activity data to other Netwrix products:
- Netwrix Enterprise Auditor
- Netwrix Threat Prevention
- Netwrix Threat Manager
Prior to adding a Nutanix files host to the Activity Monitor, the prerequisites for the target environment must be met. See Nutanix Activity Auditing Configuration for more information.
Remember, the Activity Agent must be deployed to a Windows server that acts as a proxy for monitoring the target environment.
Network Adapter for Nutanix File Server
Ensure that the correct network adapter is specified in the Network page for an agent before adding a Nutanix file server to be monitored.
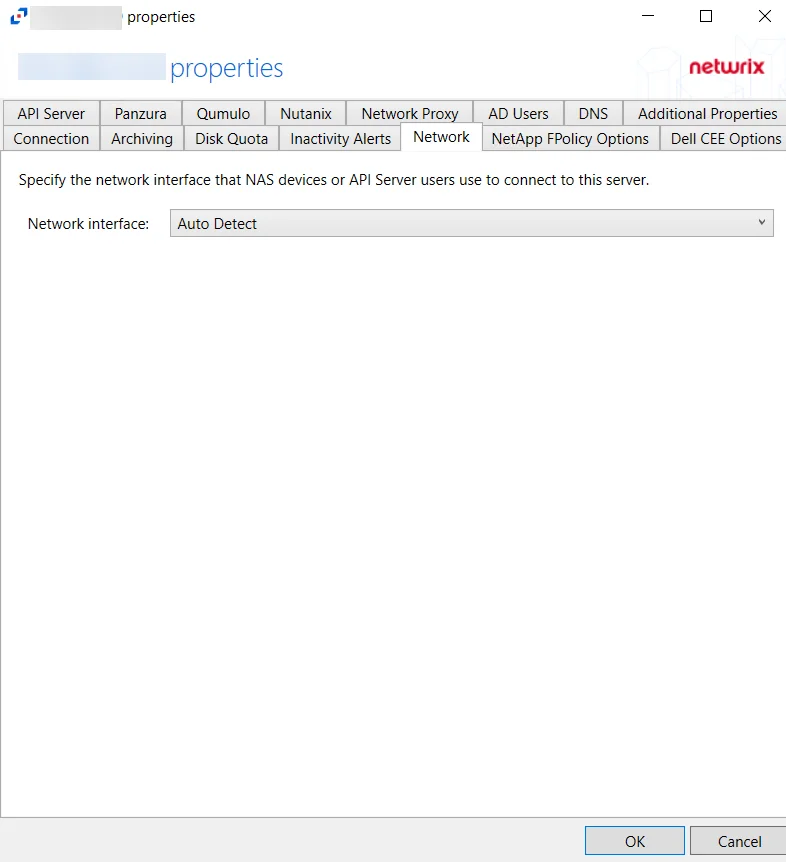
The agent registers the IP address of the network adapter in the Nutanix auditing configuration for activity delivery. Nutanix Files server connects to the agent using the TCP port 4501. See the Network Tab topic for additional information.
Add Nutanix Host
Follow the steps to add a Nutanix files host to be monitored.
Step 1 – In Activity Monitor, go to the Monitored Hosts tab and click Add. The Add New Host window opens.
Step 2 – On the Choose Agent page, select the Agent to monitor the file server from the drop-down list. Click Next.

Step 3 – On the Add Host page, select the Nutanix Files radio button and enter the file server name. Click Next.
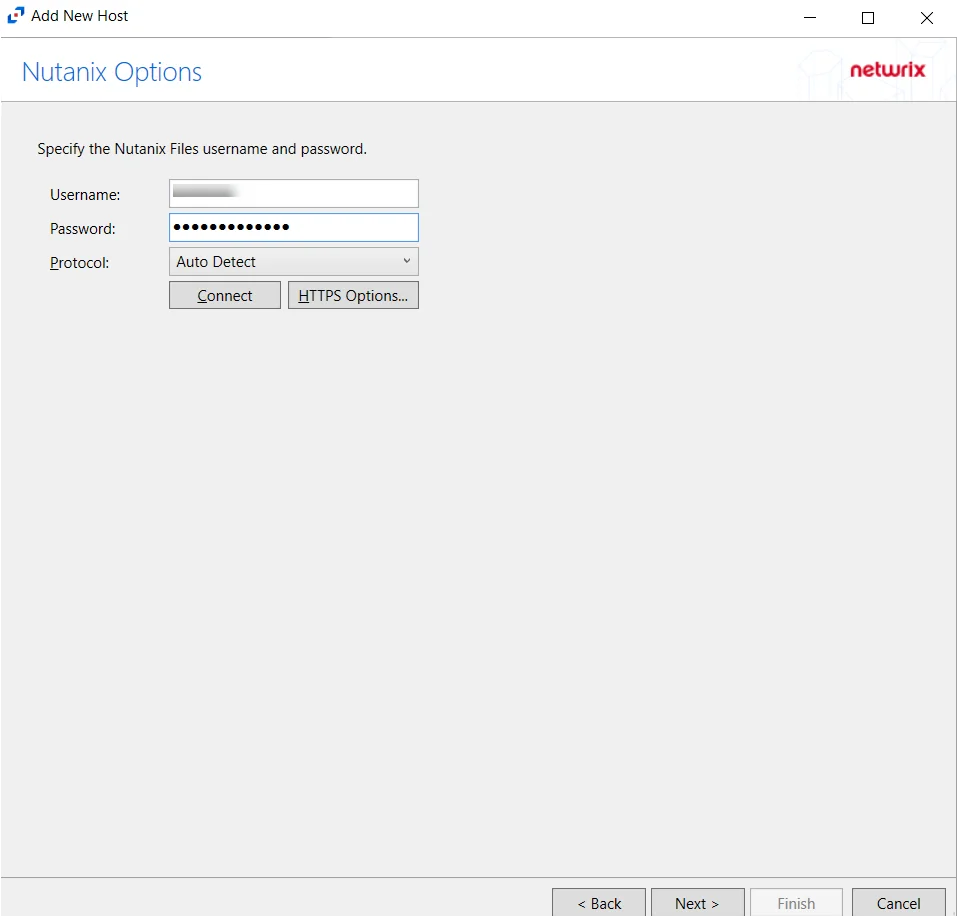
Step 4 – On the Nutanix Options page, enter the user name and password.
NOTE: The credentials used on the Nutanix Options page are for the Nutanix user having REST API access.
- Protocol – Select from the following options in the drop-down list:
- Auto Detect
- HTTPS
- HTTPS, ignore certificate errors
- Connect – Click Connect to connect to the Nutanix device using the selected protocol and validate the connection.
Click Next.
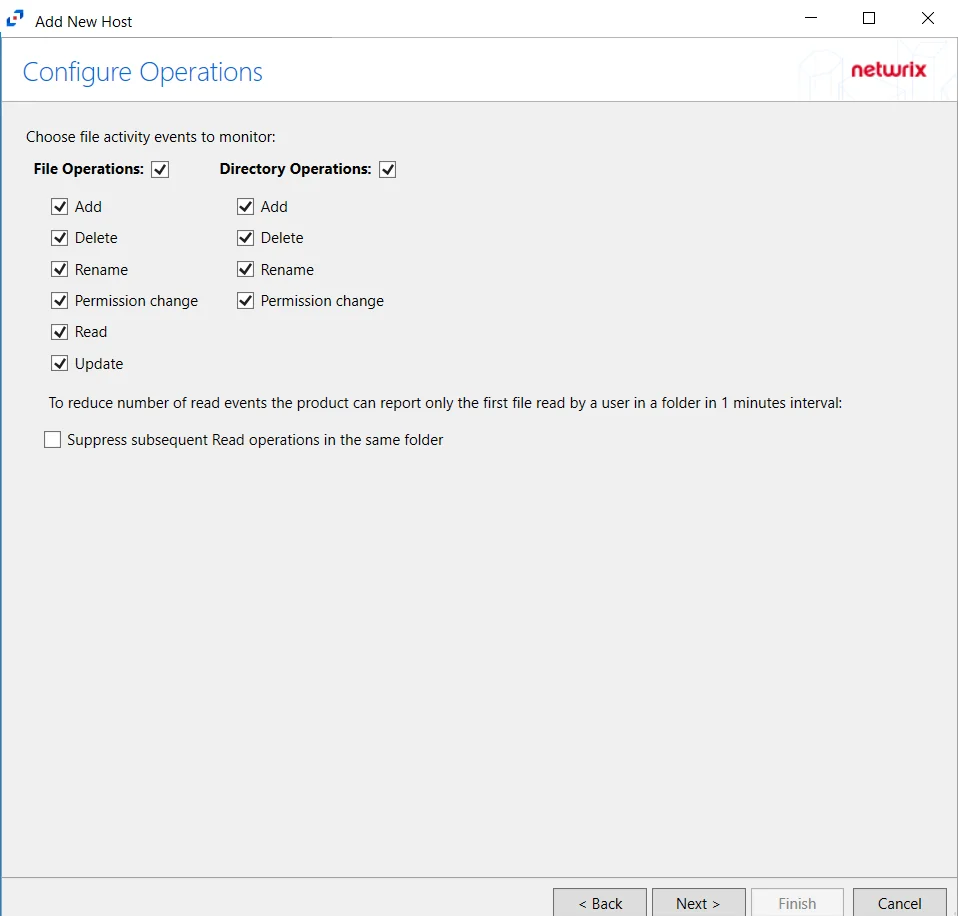
Step 5 – On the Configure Operations page, select the File Operations and Directory Operations to be monitored.
Click Next.
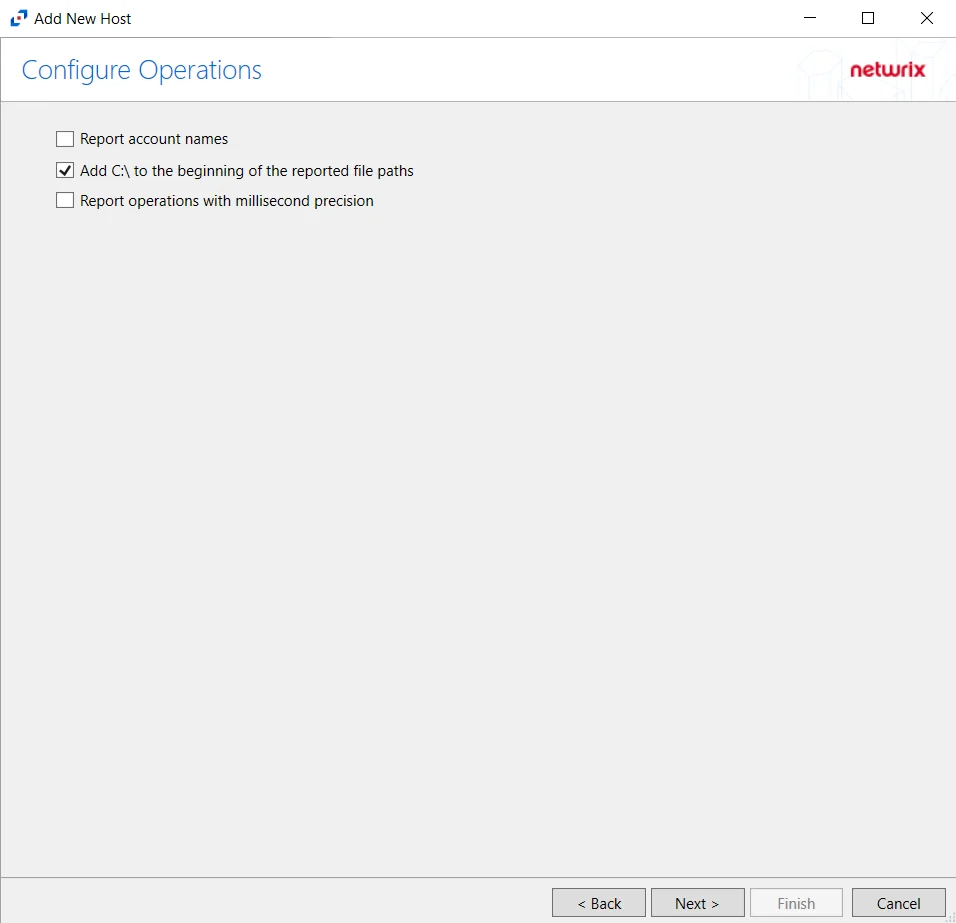
Step 6 – On the Configure Basic Operations page, choose which settings to enable. The “Log files” are the activity logs created by the activity agent on the agent's server. Select one of the following options:
- Report account names: Adds an Account Name column in the generated TSV files.
- Add C:\ to the beginning of the reported file paths: Adds ‘C:\” to file paths to be displayed like
a Windows file path:
- Display example if checked: C:\Folder\file.txt
- Display example if unchecked: /Folder/file.text
- Report operations with millisecond precision - Changes the timestamps of events being recorded in
the TSV log file for better ordering of events if multiple events occur within the same second.
- Enterprise Auditor 8.1+ is required to use this feature.
Click Next.
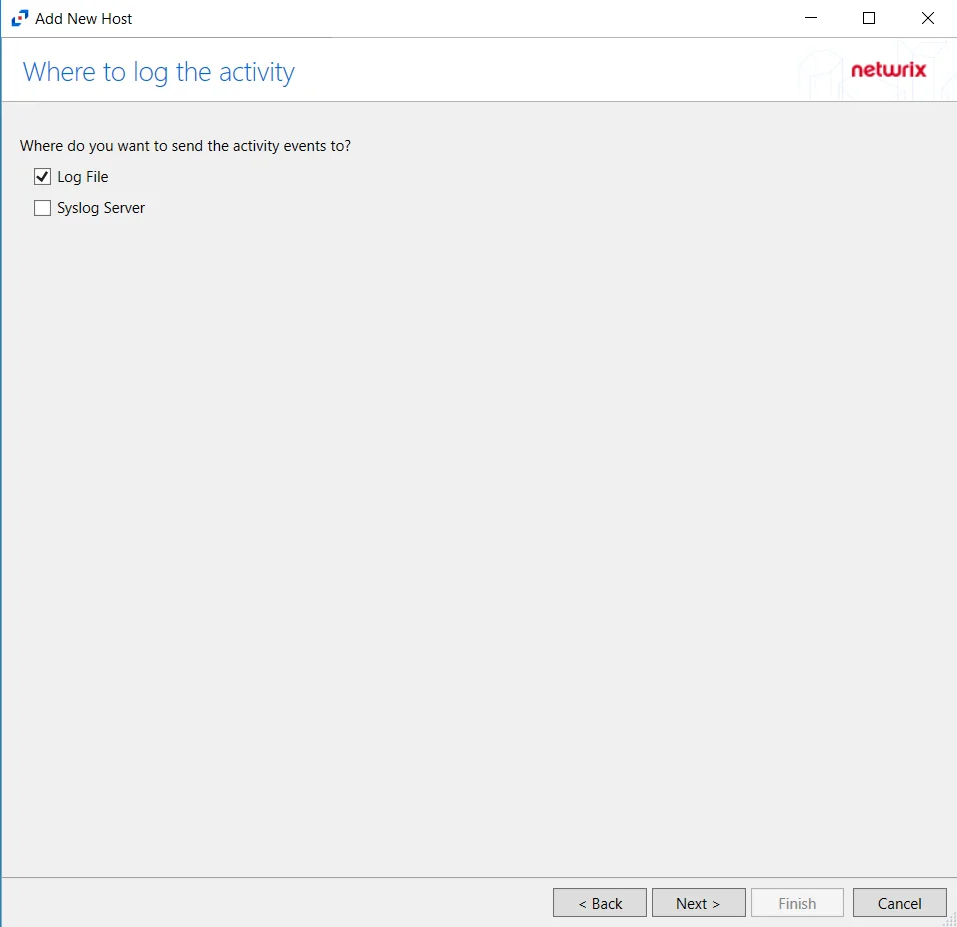
Step 7 – On the Where To Log The Activity page, select whether to send the activity to either a Log File or Syslog Server. Click Next.
NOTE: An option must be selected before moving to the next step.
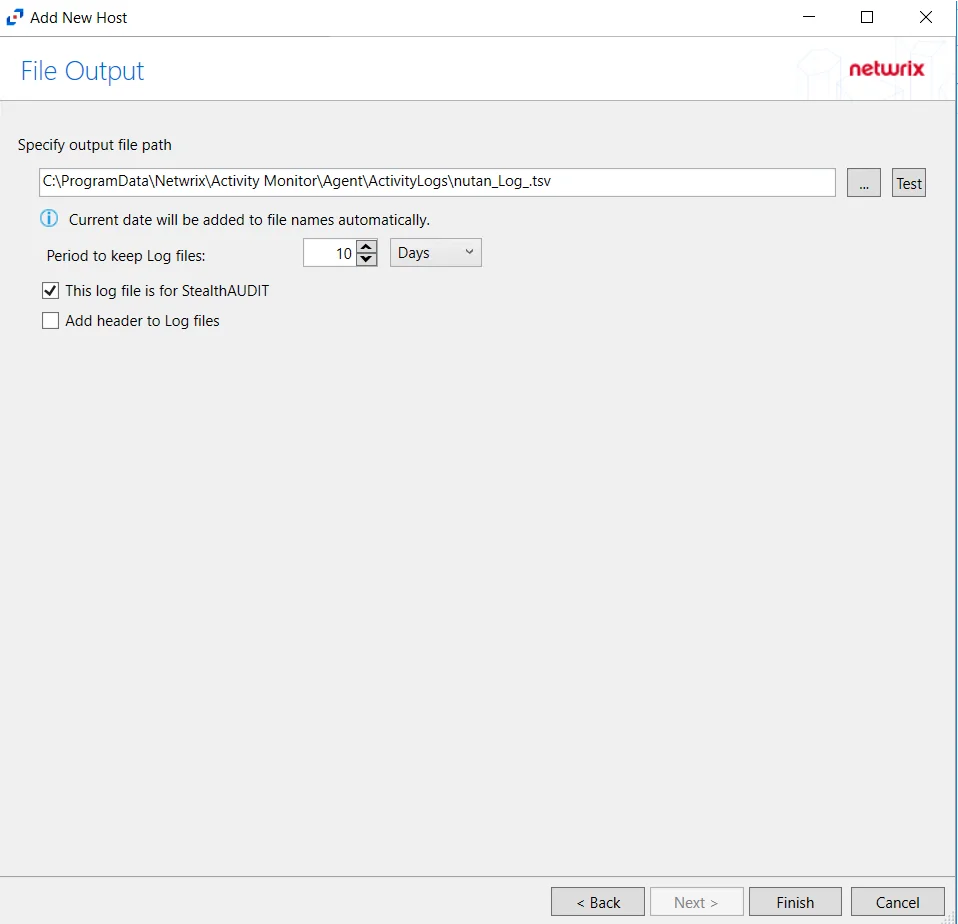
Step 8 – If Log File is selected on the Where To Log The Activity page, configure the File Output page.
-
Specify output file path – Specify the file path where TSV log files are saved on the agent's server. Click the ellipses button (...) to open the Windows Explorer to navigate to a folder destination. Click Test to test if the path works.
-
Period to keep Log files –Log files will be deleted after the period entered as the number of days elapses. The default is 10 days. Use the dropdown to specify whether to keep the Log files for a set amount of Minutes, Hours, or Days. This setting applies to both the local files on the agent's server and to the archived files.
-
This log file is for Enterprise Auditor – Enable this option to have Enterprise Auditor collect this monitored host configuration
RECOMMENDED: Identify the configuration to be read by Enterprise Auditor when integration is available.
NOTE: While Activity Monitor can have multiple configurations for log file outputs per host, Enterprise Auditor can only read one of them.
-
Add header to Log files – Adds headers to TSV files. This is used to feed data into Splunk.
NOTE: Enterprise Auditor does not support log files with the header.
Click Next.
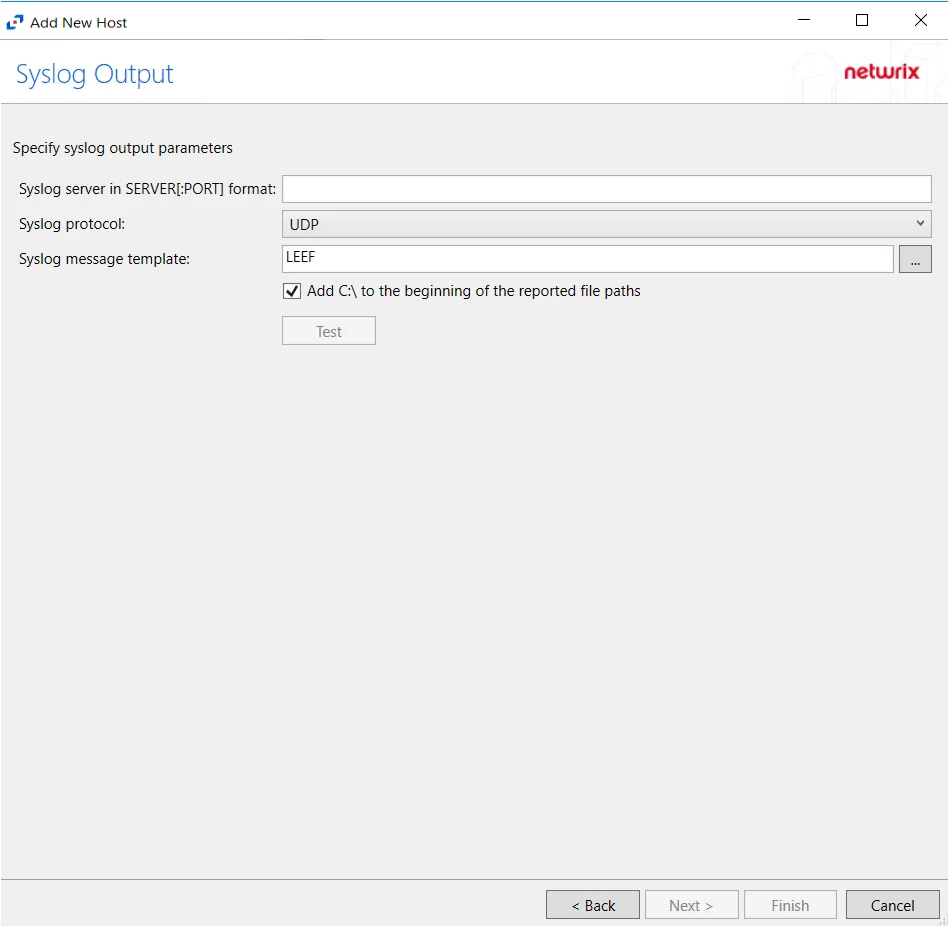
Step 9 – If Syslog Server is selected on the Where To Log The Activity page, configure the Syslog Output page.
-
Syslog server in SERVER[:PORT] format – Type the Syslog server name with a SERVER:Port format in the textbox.
- The server name can be short name, fully qualified name (FQDN), or IP Address, as long as the organization’s environment can resolve the name format used.
-
Syslog Protocol – Identify the Syslog protocol to be used for the Event stream. The drop-down menu includes:
- UDP
- TCP
- TLS
The TCP and TLS protocols add the Message framing drop-down menu. See the Syslog Tab topic for additional information.
-
The Test button sends a test message to the Syslog server to check the connection. A green check mark or red will determine whether the test message has been sent or failed to send. Messages vary by Syslog protocol:
- UDP – Sends a test message and does not verify connection
- TCP/TLS – Sends test message and verifies connection
- TLS – Shows error if TLS handshake fails
See the Syslog Tab topic for additional information.
Click Finish.
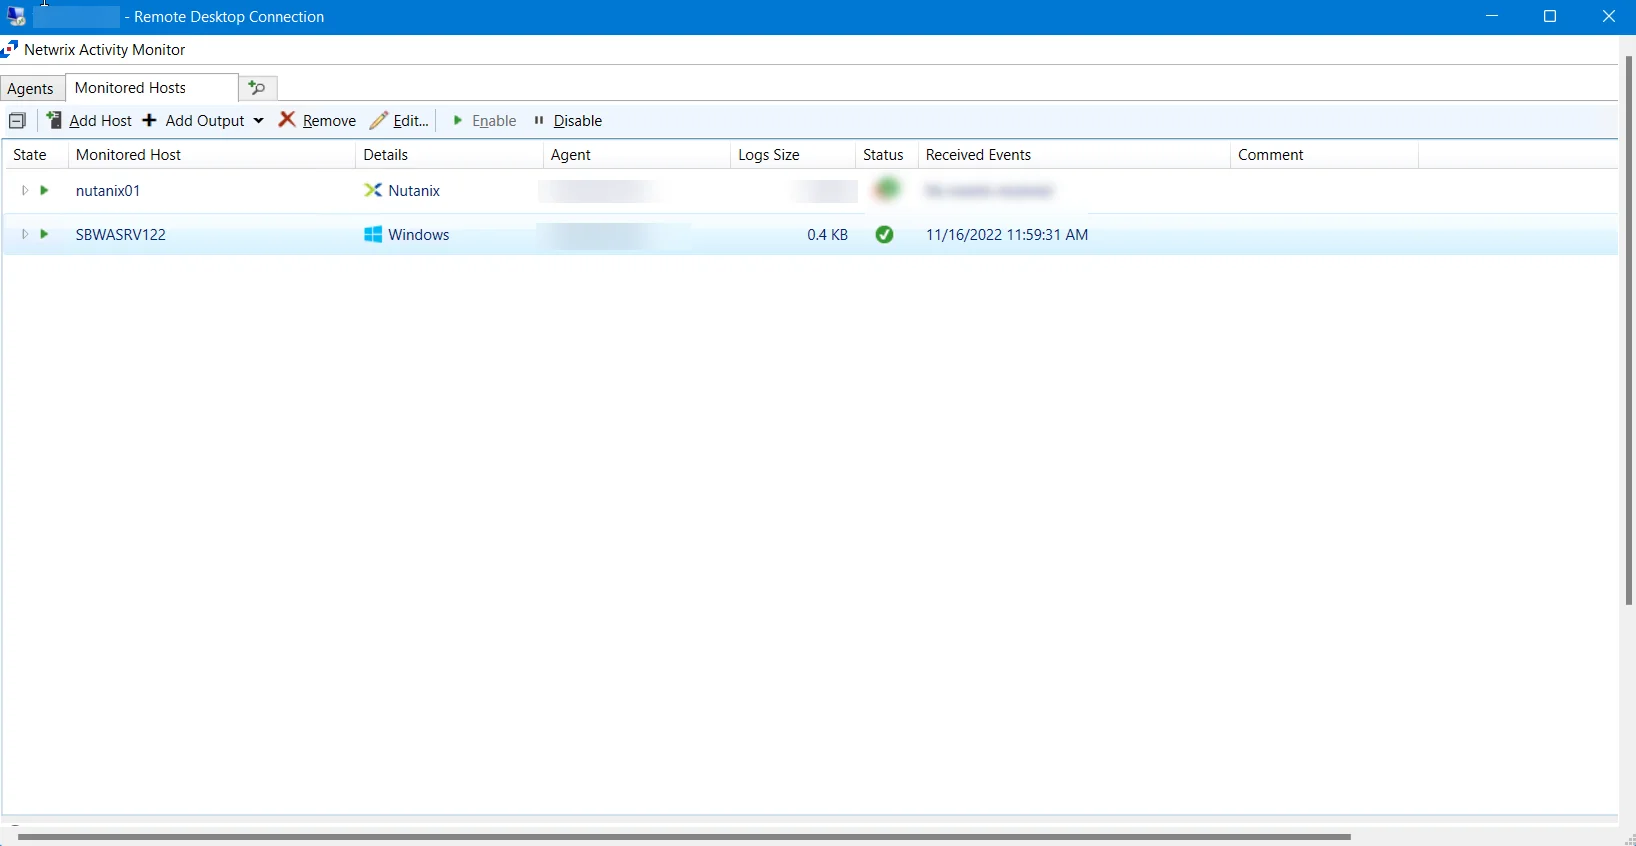
The added Nutanix host is displayed in the monitored hosts table. Once a host has been added for monitoring, configure the desired ouptuts. See the Output for Monitored Hosts topic for additional information.
Host Properties for Nutanix
Configuration settings can be edited through the tabs in the host’s Properties window. The configurable host properties are:
See the Host Properties Window topic for additional information.
Panzura
Understanding File Activity Monitoring
The Activity Monitor can be configured to monitor the following:
- Ability to collect all or specific file activity for specific values or specific combinations of values
It provides the ability to feed activity data to SIEM products. The following dashboards have been specifically created for Activity Monitor event data:
- For IBM® QRadar®, see the Netwrix File Activity Monitor App for QRadar for additional information.
- For Splunk®, see the File Activity Monitor App for Splunk for additional information.
It also provides the ability to feed activity data to other Netwrix products:
- Netwrix Threat Prevention
- Netwrix Threat Manager
Remember, the Activity Agent must be deployed to a Windows server that acts as a proxy for monitoring the target environment.
Add Panzura Host
Prior to adding a Panzura host to the Activity Monitor, the prerequisites for the target environment must be met. See the Panzura CloudFS Monitoring topic for additional information.
Follow the steps to add a Panzura host to be monitored.
Step 1 – In Activity Monitor, go to the Monitored Hosts tab and click Add. The Add New Host window opens.
Step 2 – On the Choose Agent page, select the Agent to monitor the storage device. Click Next.

Step 3 – On the Add Host page, select the Panzura radio button and enter the Panzura filer name. Click Next.
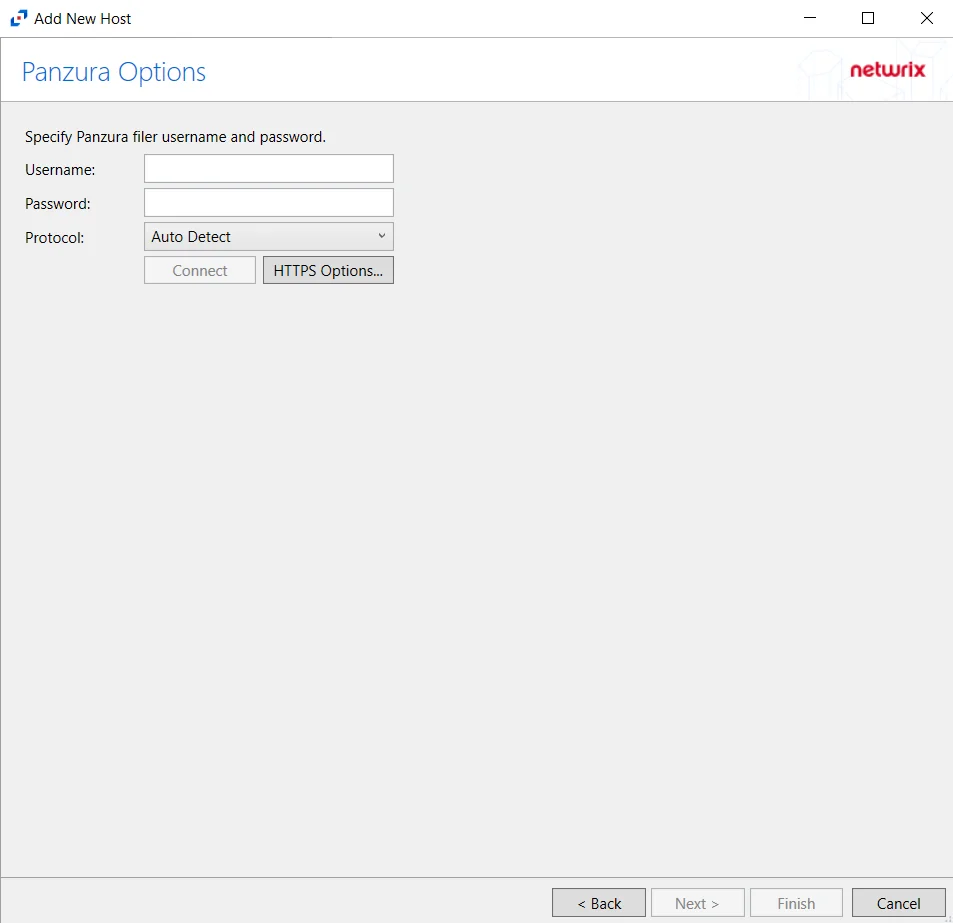
Step 4 – On the Panzura Options page, enter the Username, Password, and select the Protocol to be used by the Panzura host.
-
The different protocols that can be selected are:
- Auto Detect (Default)
- HTTPS
- HTTPS, ignore certificate errors
Click HTTPS Options to open the Trusted server certificate window.
Click Next.
-
HTTPS Options – Opens the Trusted server certificate window to customize the certificate verification during a TLS session
- Import – Click to browse for a trusted server certificate
- Remove – Click to remove selected trusted server certificate
- Enable hostname verification – Select this checkbox to ensure that the host name the product connects to matches the name in the certificate (CN name)
- Click OK to close the window and save the modifications
Click Connect to connect to the Panzura device. Click Next.
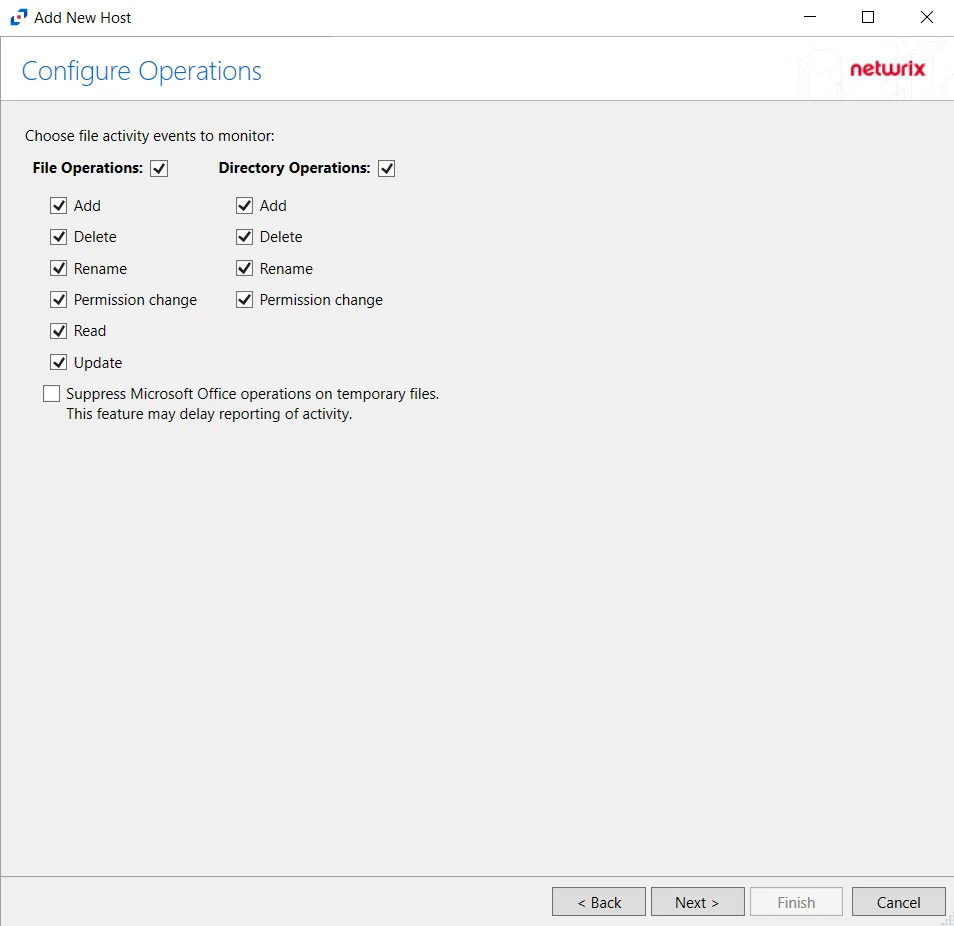
Step 5 – On the Configure Operations page, select the File Operations and Directory Operations to be monitored.
- Suppress Microsoft Office operations on temporary files – Filters out events for Microsoft Office temporary files. When Microsoft Office files are saved or edited, many temporary files are created. With this option enabled, events for these temporary files are ignored.
Click Next.
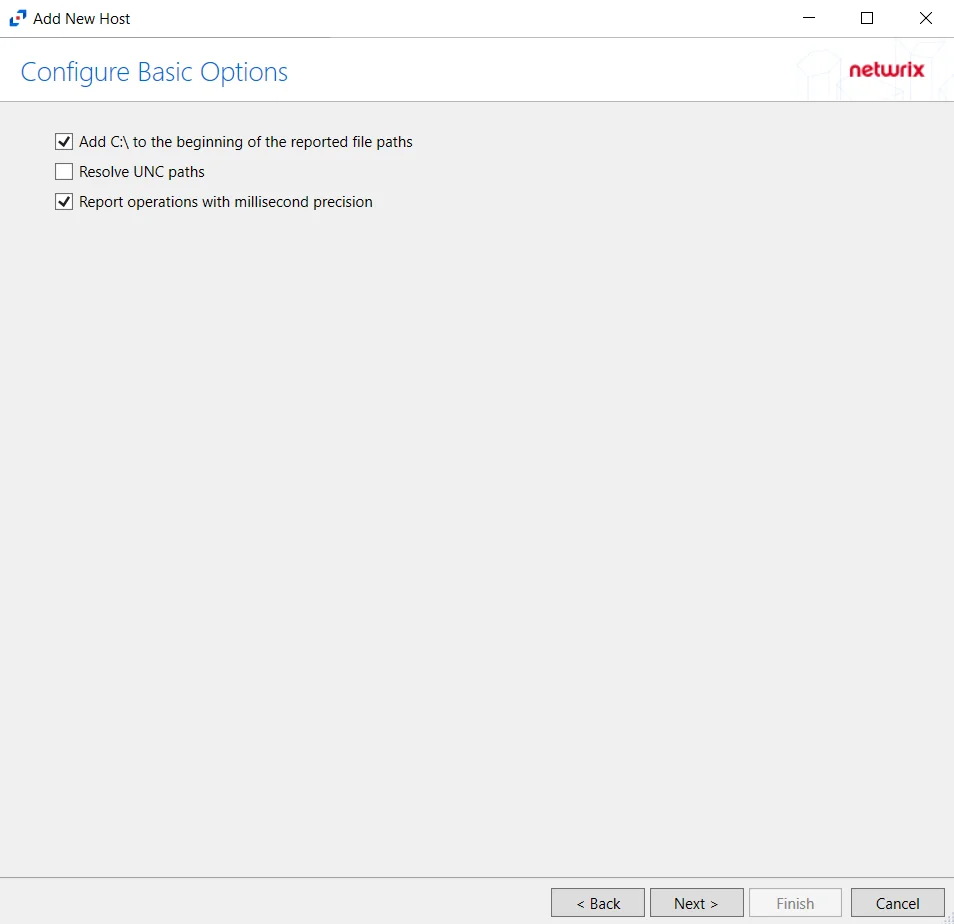
Step 6 – On the Configure Basic Options page, choose which of the following settings to enable:
- Add C:\ to the beginning of the reported file paths - Adds ‘C:\” to file paths to be displayed
like a Windows file path:
- Display example if checked – C:\Folder\file.txt
- Display example if unchecked – /Folder/file.text
- Report UNC paths - Adds a UNC Path column and a Rename UNC Path column in the generated TSV files
- This option corresponds to the REPORT_UNC_PATH parameter in the INI file. It is disabled by
default. The UNC Path is in the following format:
- For CIFS activity – \[HOST][SHARE][PATH]
- Example CIFS activity – \ExampleHost\TestShare\DocTeam\Temp.txt
- For NFS activity – [HOST]:/[VOLUME]/[PATH]
- Example NFS activity – ExampleHost:/ExampleVolume/DocTeam/Temp.txt
- When the option is enabled, the added columns are populated when a file is accessed remotely through the UNC Path. If a file is accessed locally, these columns are empty. These columns have also been added as Syslog macros.
- This option corresponds to the REPORT_UNC_PATH parameter in the INI file. It is disabled by
default. The UNC Path is in the following format:
- Report operations with millisecond precision - Changes the timestamps of events being recorded in
the TSV log file for better ordering of events if multiple events occur within the same second.
- Enterprise Auditor 8.1+ is required to use this feature.
Click Next.
Step 7 – On the Where To Log The Activity page, select whether to send the activity to either a Log File) or Syslog Server. Click Next.
NOTE: An option must be selected before moving to the next step.
Step 8 – If Log File) is selected on the Where To Log The Activity page, the File Output page can be configured.
-
Specify output file path – Specify the file path where TSV log files are saved on the agent's server. Click the ellipses button (...) to open the Windows Explorer to navigate to a folder destination. Click Test to test if the path works.
-
Period to keep Log files – Log files will be deleted after the period entered as the number of days elapses. The default is 10 days. Use the dropdown to specify whether to keep the Log files for a set amount of Minutes, Hours, or Days.
-
This log file is for Enterprise Auditor – Enable this option to have Enterprise Auditor collect this monitored host configuration
RECOMMENDED: Identify the configuration to be read by Enterprise Auditor when integration is available.
- While Activity Monitor can have multiple configurations per host, Enterprise Auditor can only read one of them.
-
Add header to Log files – Adds headers to TSV files. This is used to feed data into Splunk.
Click Next.
Step 9 – If Syslog Server is selected on the Where To Log The Activity page, the Syslog Output page can be configured.
-
Syslog server in SERVER[:PORT] format – Type the Syslog server name with a SERVER:Port format in the textbox.
- The server name can be short name, fully qualified name (FQDN), or IP Address, as long as the organization’s environment can resolve the name format used. The Event stream is the activity being monitored according to this configuration for the monitored host.
-
Syslog Protocol – Identify the Syslog protocol to be used for the Event stream. The drop-down menu includes:
- UDP
- TCP
- TLS
The TCP and TLS protocols add the Message framing drop-down menu. See the Syslog Tab topic for additional information.
-
The Test button sends a test message to the Syslog server to check the connection. A green check mark or red will determine whether the test message has been sent or failed to send. Messages vary by Syslog protocol:
- UDP – Sends a test message and does not verify connection
- TCP/TLS – Sends test message and verifies connection
- TLS – Shows error if TLS handshake fails
See the Syslog Tab topic for additional information.
Click Finish.
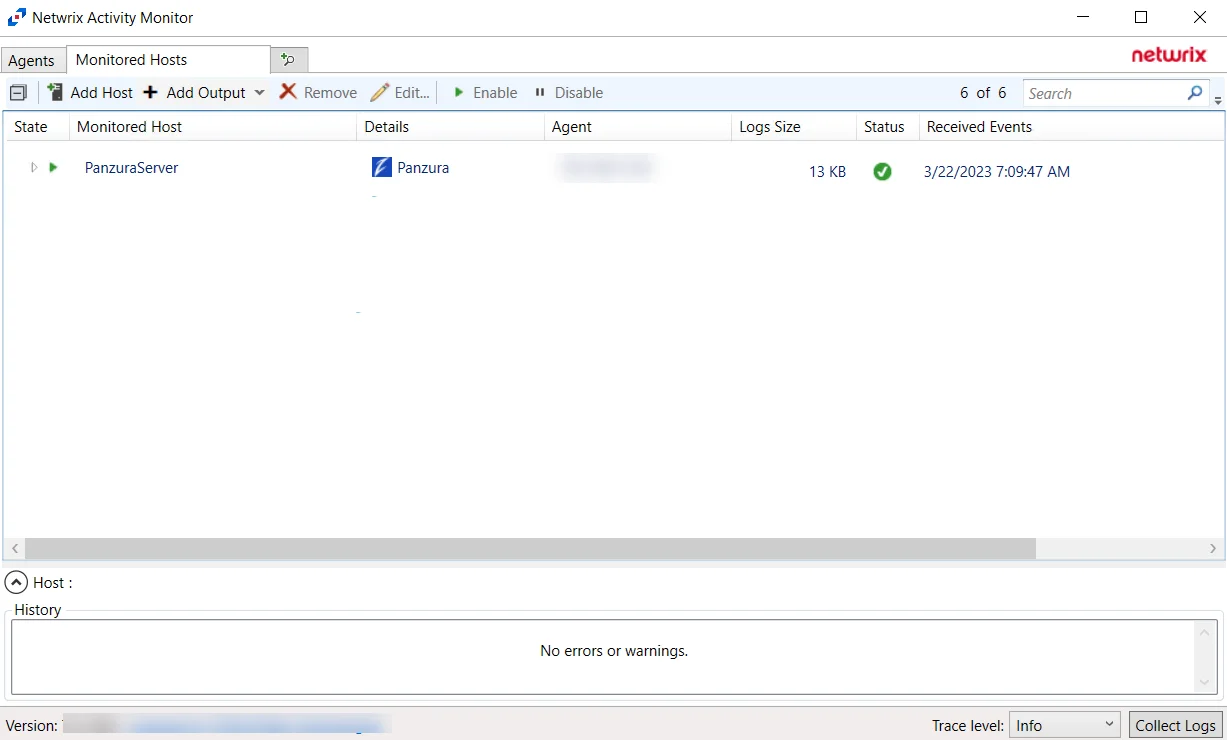
The added Panzura host is displayed in the monitored hosts table. Once a host has been added for monitoring, configure the desired ouptuts. See the Output for Monitored Hosts topic for additional information.
Host Properties for Panzura
Configuration settings can be edited through the tabs in the host’s Properties window. The configurable host properties are:
See the Host Properties Window topic for additional information.
Qumulo
Understanding File Activity Monitoring
The Activity Monitor can be configured to monitor the following:
- Ability to collect all or specific file activity for specific values or specific combinations of values
It provides the ability to feed activity data to SIEM products. The following dashboards have been specifically created for Activity Monitor event data:
- For IBM® QRadar®, see the Netwrix File Activity Monitor App for QRadar for additional information.
- For Splunk®, see the File Activity Monitor App for Splunk for additional information.
It also provides the ability to feed activity data to other Netwrix products:
- Netwrix Enterprise Auditor
- Netwrix Threat Prevention
- Netwrix Threat Manager
Prior to adding a Qumulo host to the Activity Monitor, the prerequisites for the target environment must be met. See the Qumulo Activity Auditing Configuration topic for additional information.
Remember, the Activity Agent must be deployed to a Windows server that acts as a proxy for monitoring the target environment.
Add Qumulo Host
Follow the steps to add a Qumulo host to be monitored.
Step 1 – In Activity Monitor, go to the Monitored Hosts tab and click Add. The Add New Host window opens.
Step 2 – On the Choose Agent page, select the Agent to monitor the file server from the drop-down list. Click Next.
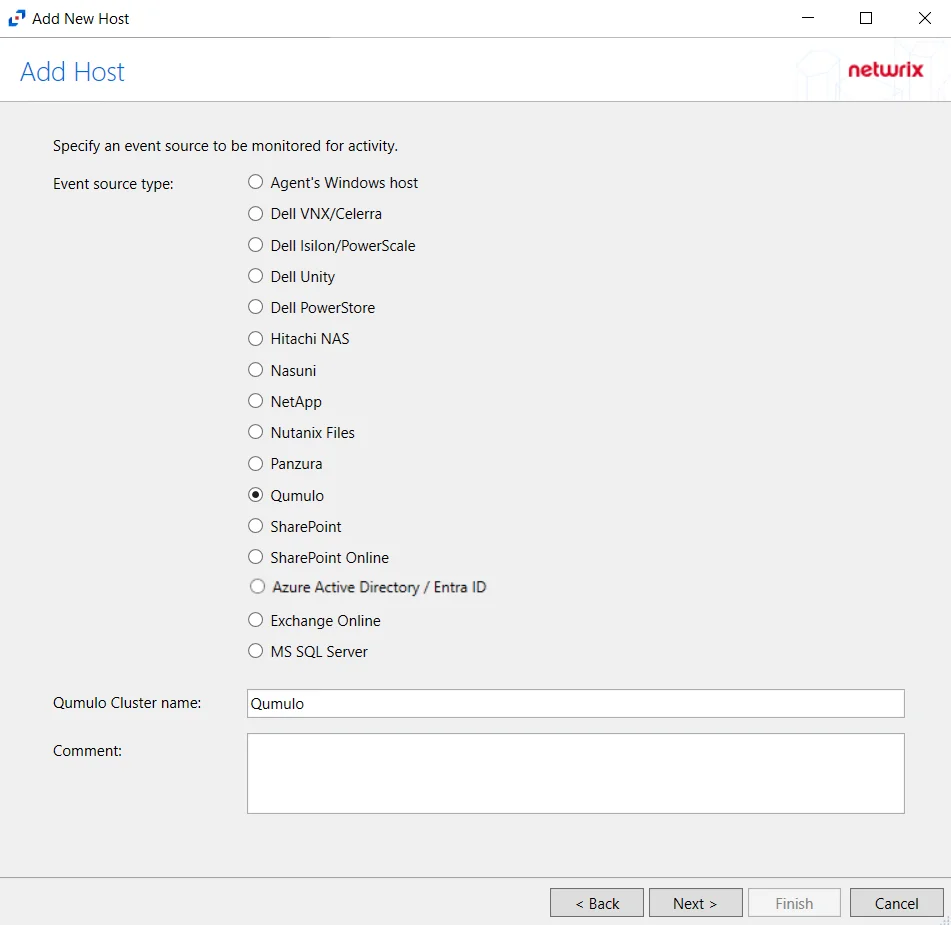
Step 3 – On the Add Host page, select the Qumulo radio button and enter the file server name. Click Next.
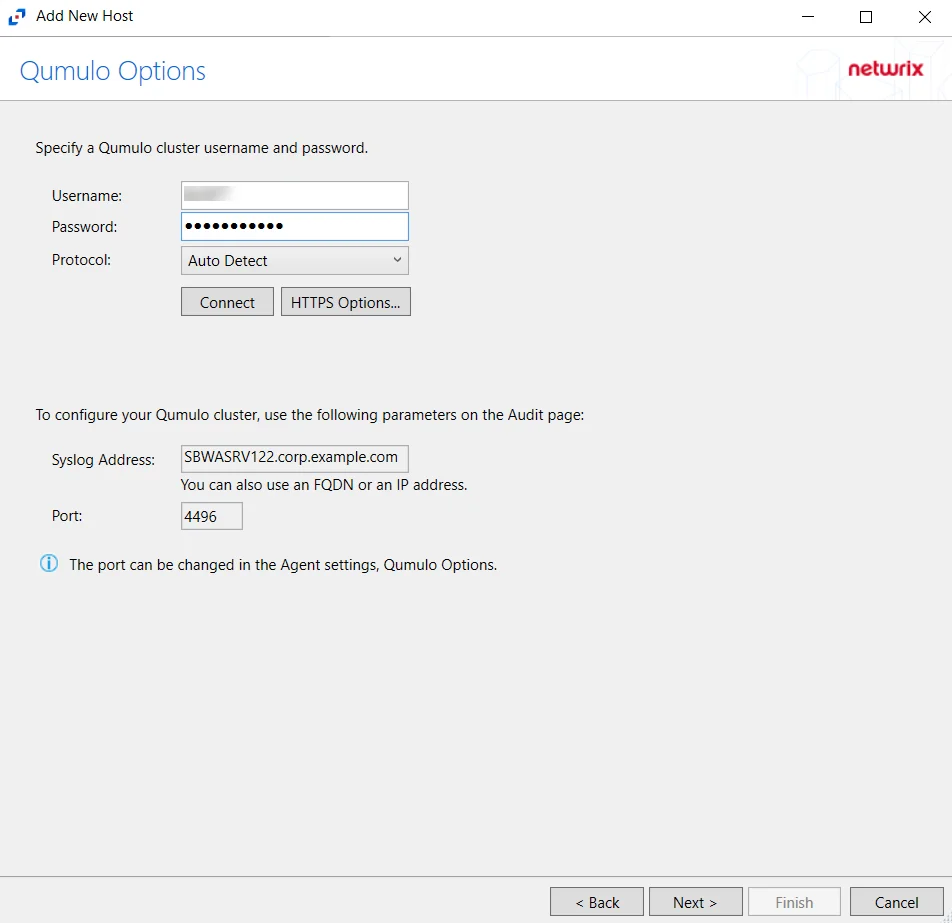
Step 4 – On the Qumulo Options page, enter the user name and password.
- Protocol – Select from the following options in the drop-down list:
- Auto Detect
- HTTPS
- HTTPS, ignore certificate errors
- Connect – Click Connect to connect to the Qumulo device using the selected protocol and validate the connection.
The following values are shown for information purposes. You can use them to configure auditing in Qumulo.
- Syslog Address – Address to configure Qumulo cluster.
- Port – Port to configure Qumulo cluster.
Click Next.
Step 5 – On the Where To Log The Activity page, select whether to send the activity to either a Log File or Syslog Server. Click Next.
NOTE: An option must be selected before moving to the next step.
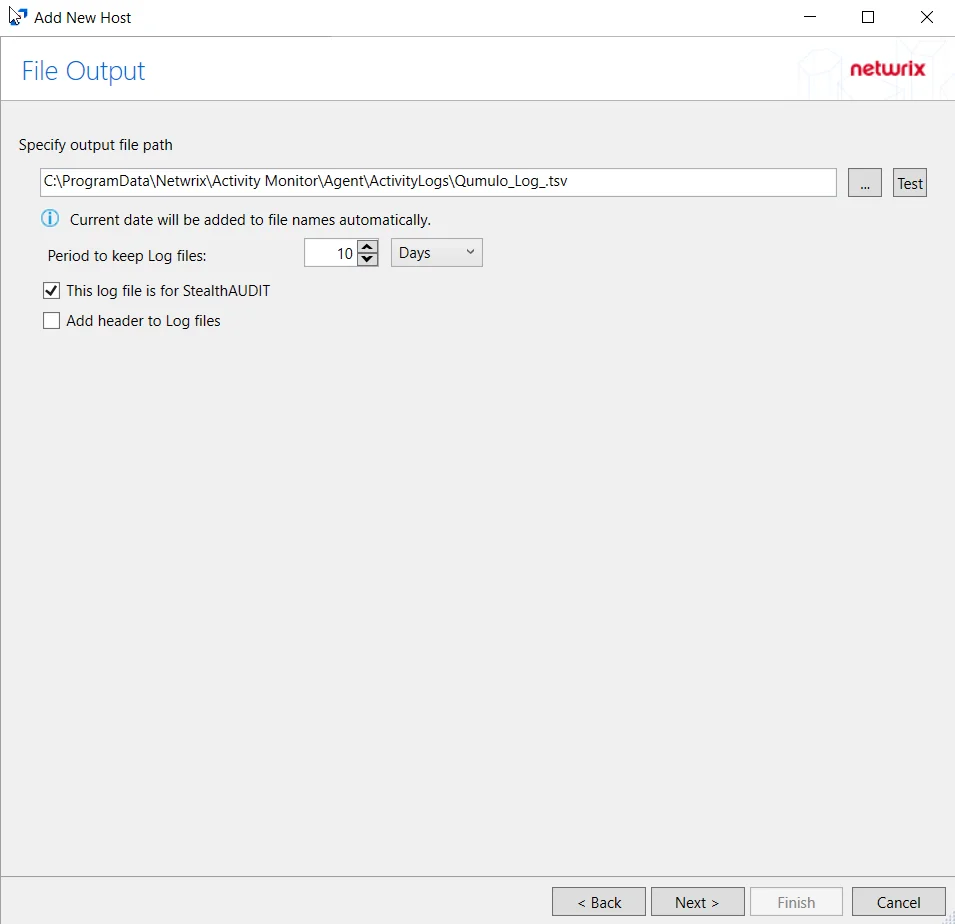
Step 6 – If Log File is selected on the Where To Log The Activity page, configure the File Output page.
-
Specify output file path – Specify the file path where TSV log files are saved on the agent's server. Click the ellipses button (...) to open the Windows Explorer to navigate to a folder destination. Click Test to test if the path works.
-
Period to keep Log files – Log files will be deleted after the period entered as the number of days elapses. The default is 10 days. Use the dropdown to specify whether to keep the Log files for a set number of Hours or Days.
-
This log file is for Enterprise Auditor – Enable this option to have Enterprise Auditor collect this monitored host configuration
RECOMMENDED: Identify the configuration to be read by Enterprise Auditor when integration is available.
NOTE: While Activity Monitor can have multiple configurations for log file outputs per host, Enterprise Auditor can only read one of them.
-
Add header to Log files – Adds headers to TSV files. This is used to feed data into Splunk.
NOTE: Enterprise Auditor does not support log files with the header.
Click Next.
Step 7 – If Syslog Server is selected on the Where To Log The Activity page, configure the Syslog Output page.
-
Syslog server in SERVER[:PORT] format – Type the Syslog server name with a SERVER:Port format in the textbox.
- The server name can be short name, fully qualified name (FQDN), or IP Address, as long as the organization’s environment can resolve the name format used.
-
Syslog Protocol – Identify the Syslog protocol to be used for the Event stream. The drop-down menu includes:
- UDP
- TCP
- TLS
The TCP and TLS protocols add the Message framing drop-down menu. See the Syslog Tab topic for additional information.
-
The Test button sends a test message to the Syslog server to check the connection. A green check mark or red will determine whether the test message has been sent or failed to send. Messages vary by Syslog protocol:
- UDP – Sends a test message and does not verify connection
- TCP/TLS – Sends test message and verifies connection
- TLS – Shows error if TLS handshake fails
See the Syslog Tab topic for additional information.
Click Finish.
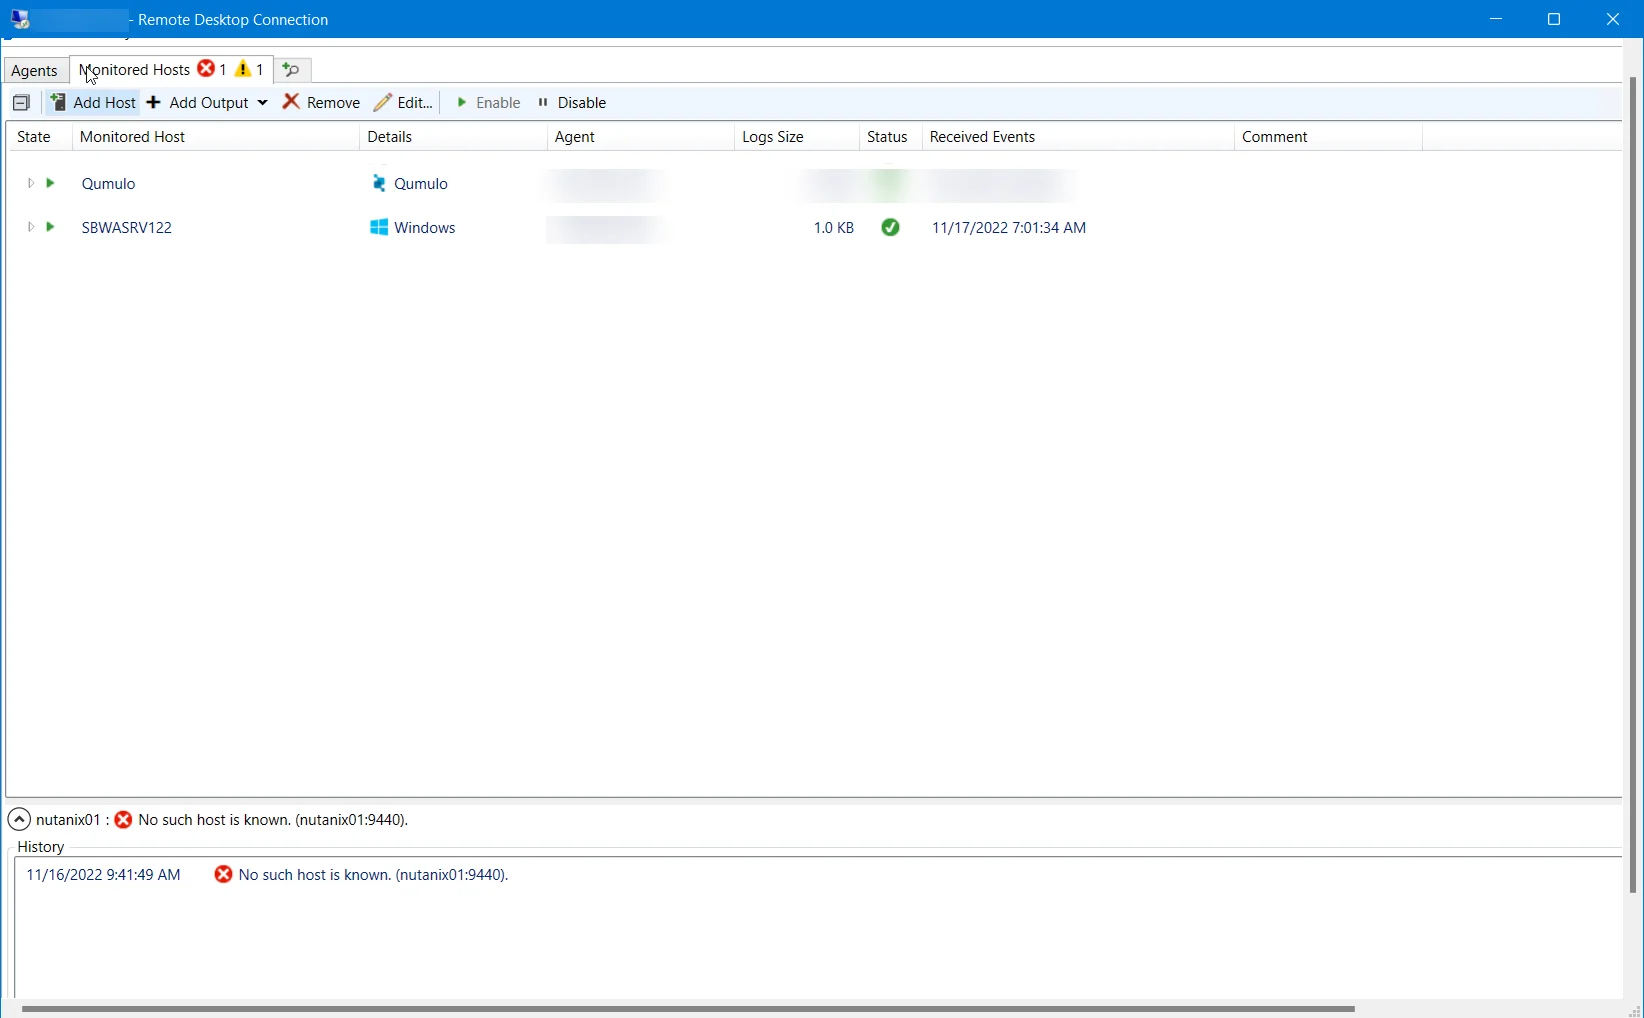
The added Qumulo host is displayed in the monitored hosts table. Once a host has been added for monitoring, configure the desired ouptuts. See the Output for Monitored Hosts topic for additional information.
Host Properties for Qumulo
Configuration settings can be edited through the tabs in the host’s Properties window. The configurable host properties are:
See the Host Properties Window topic for additional information.
SharePoint
Understanding SharePoint Activity Monitoring
The Activity Monitor can be configured to monitor the following SharePoint changes:
- Document is checked out
- Document is checked in
- Object is deleted
- Object is updated
- Child object is deleted
- Child object is undeleted
- Child object is moved
- Search operation is performed
- Security group is created
- Security group is deleted
- Security principal is added to a security group
- Security principal is removed from a security group
It also provides the ability to feed activity data to other Netwrix products:
- Netwrix Enterprise Auditor
Prior to adding a SharePoint host to the Activity Monitor, the prerequisites for the target environment must be met. See the SharePoint On-Premise Activity Auditing Configuration topic for additional information.
Remember, the Activity Agent must be deployed to the SharePoint Application server that hosts the “Central Administration” component of the SharePoint farm.
Add SharePoint Host
Follow the steps to add a SharePoint host to be monitored.
Step 1 – In Activity Monitor, go to the Monitored Hosts tab and click Add. The Add New Host window opens.
Step 2 – On the Choose Agent page, select the Agent deployed on the SharePoint Application server that hosts the “Central Administration” component. Click Next.
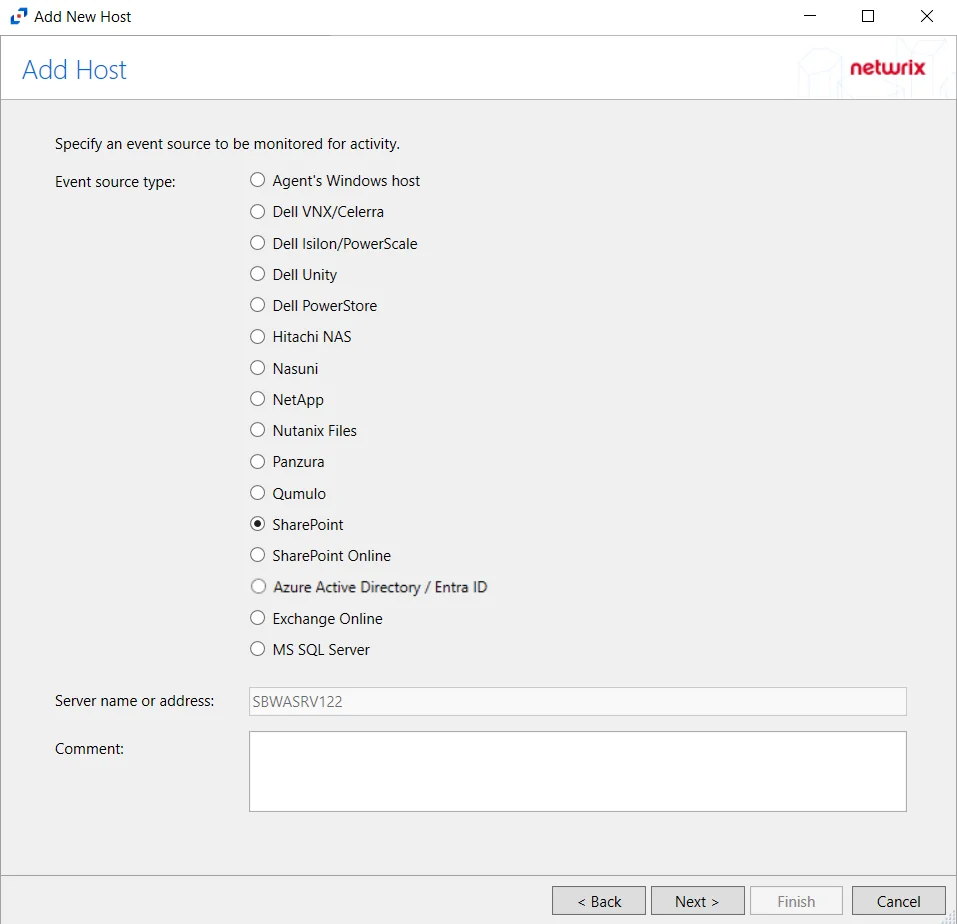
Step 3 – On the Add Host page, select the SharePoint radio button. If desired, add a Comment. Click Next.
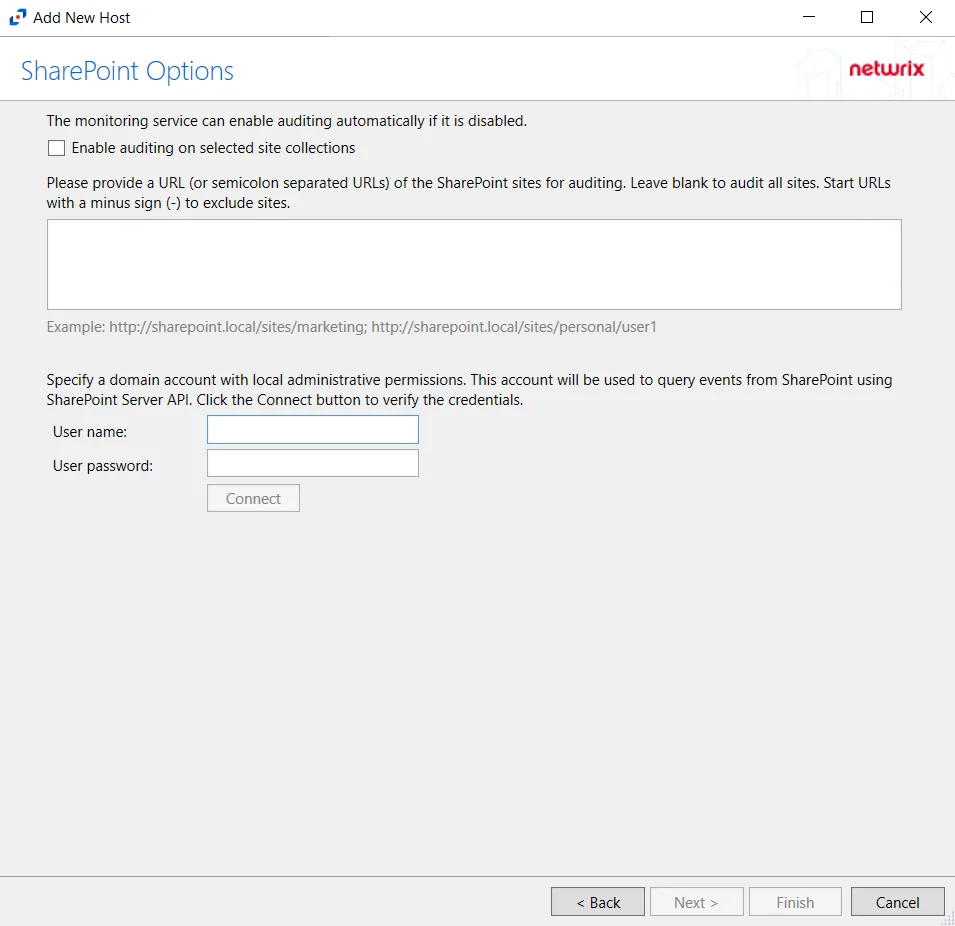
Step 4 – On the SharePoint Options page, choose to audit all sites or scope the monitoring to specific site(s):
-
Enable auditing on selected site collections – Enabling this option will ensure that auditing is enabled for all monitored site collections with periodic checks
-
Audit all sites – Leave textbox for URLs blank
Scope to specific sites – List URLs for sites to be monitored in the textbox. List should be semicolon separated.
- Examples – http://sharpoint.local/sites/marketing, http://sharepoint.local/sites/personal/user1
- Then enter the credentials configured as the provisioned activity monitoring account.
-
Enter valid User Name and Password for a domain account with local administrative permissions
-
Connect – Click Connect to verify the provided credentials
Click Next.
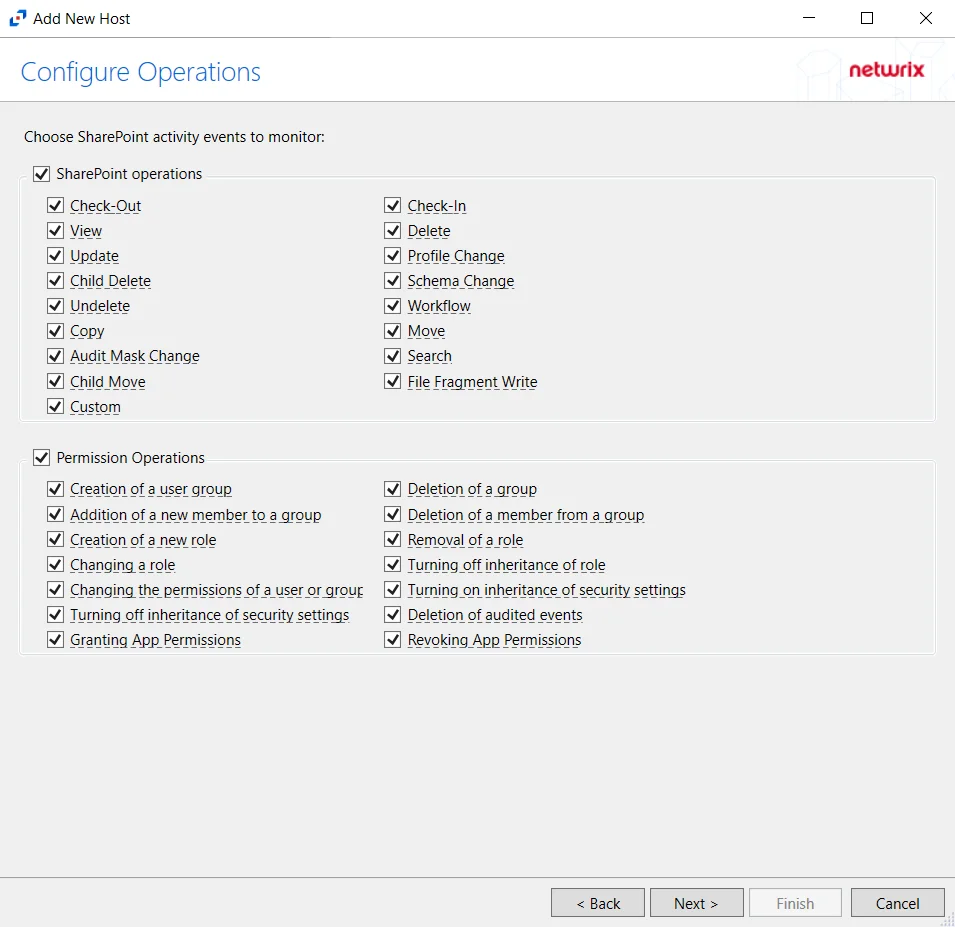
Step 5 – On the Configure Operations page, select the SharePoint Operations and Permissions Operations to be monitored. Click Next.
Step 6 – On the Where To Log The Activity page, select whether to send the activity to either a Log File) or Syslog Server. Click Next.
Step 7 – If Log File is selected on the Where To Log The Activity page, the File Output page can be configured.
-
Specify output file path – Specify the file path where log files are saved. Click the ellipses button (...) to open the Windows Explorer to navigate to a folder destination. Click Test to test if the path works.
-
Period to keep Log files – Log files will be deleted after the period entered number of days entered. The default is 10 days. Use the dropdown to specify whether to keep the Log files for a set amount of Minutes, Hours, or Days.
-
Log file format – Select whether the log file will be saved as a JSON or TSV file
-
This log file is for Enterprise Auditor – Enable this option to have Enterprise Auditor collect this monitored host configuration
RECOMMENDED: Identify the configuration to be read by Enterprise Auditor when integration is available.
- While Activity Monitor can have multiple configurations per host, Enterprise Auditor can only read one of them.
Click Next.
Step 8 – If Syslog Server is selected on the Where To Log The Activity page, the Syslog Output page can be configured. The configurable options are:
-
Syslog server in SERVER[:PORT] format – Type the Syslog server name with a SERVER:Port format in the textbox.
- The server name can be short name, fully qualified name (FQDN), or IP Address, as long as the organization’s environment can resolve the name format used. The Event stream is the activity being monitored according to this configuration for the monitored host.
-
Syslog Protocol – Identify the Syslog protocol to be used for the Event stream. The drop-down menu includes:
- UDP
- TCP
- TLS
The TCP and TLS protocols add the Message framing drop-down menu. See the Syslog Tab topic for additional information.
-
The Test button sends a test message to the Syslog server to check the connection. A green check mark or red will determine whether the test message has been sent or failed to send. Messages vary by Syslog protocol:
- UDP – Sends a test message and does not verify connection
- TCP/TLS – Sends test message and verifies connection
- TLS – Shows error if TLS handshake fails
See the Syslog Tab topic for additional information.
Click Finish.
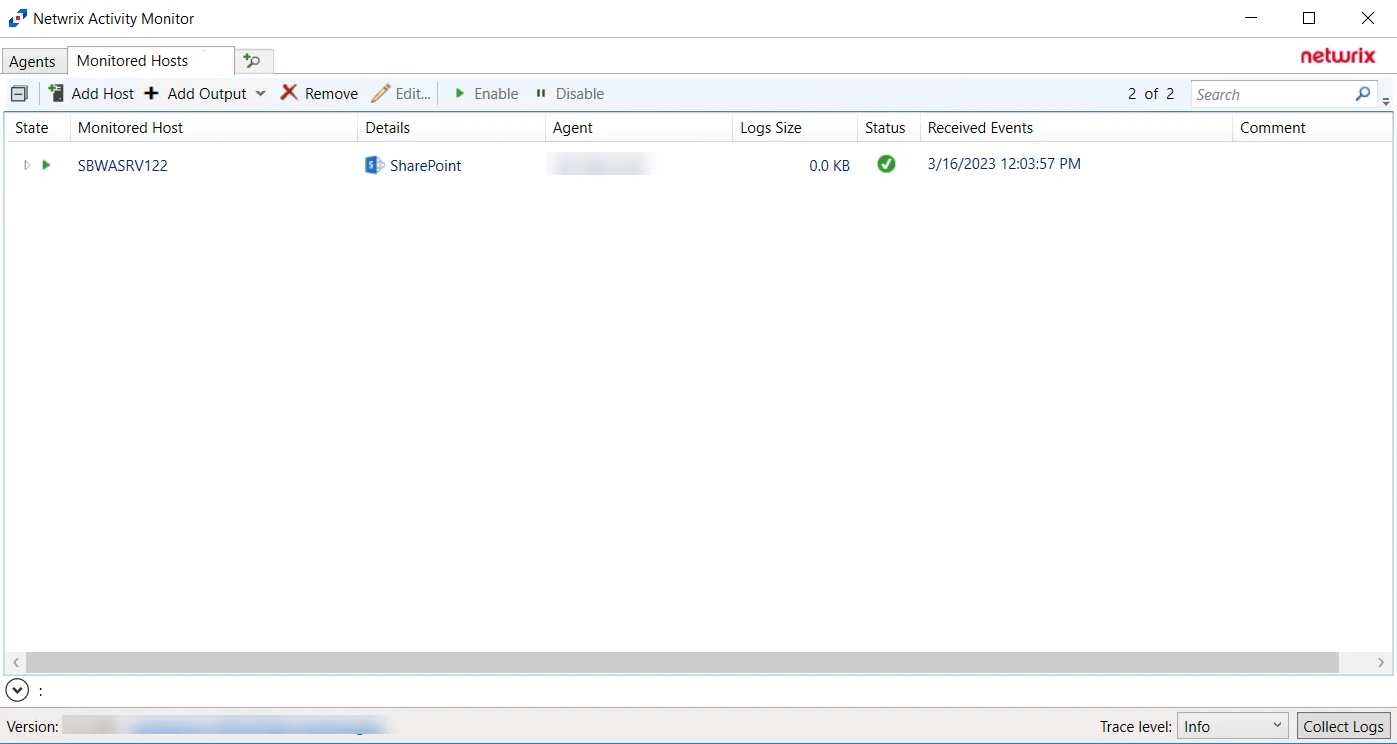
The added SharePoint host is displayed in the monitored hosts table. Once a host has been added for monitoring, configure the desired ouptuts. See the Output for Monitored Hosts topic for additional information.
Host Properties for SharePoint
Configuration settings can be edited through the tabs in the host’s Properties window. The configurable host properties are:
See the Host Properties Window topic for additional information.
SharePoint Online
Understanding SharePoint Activity Monitoring
The Activity Monitor can be configured to monitor the following SharePoint changes:
- Document is checked out
- Document is checked in
- Object is deleted
- Object is updated
- Child object is deleted
- Child object is undeleted
- Child object is moved
- Search operation is performed
- Security group is created
- Security group is deleted
- Security principal is added to a security group
- Security principal is removed from a security group
It also provides the ability to feed activity data to other Netwrix products:
- Netwrix Enterprise Auditor
Prior to adding a SharePoint Online host to the Activity Monitor, the prerequisites for the target environment must be met. See the SharePoint Online Activity Auditing Configuration topic for additional information.
Remember, the Activity Agent must be deployed to a Windows server that acts as a proxy for monitoring the target environment.
Add SharePoint Online Host
Follow the steps to add a SharePoint Online host to be monitored.
Step 1 – In the Activity Monitor, go to the Monitored Hosts tab and click Add. The Add New Host window opens.
Step 2 – On the Choose Agent page, select the Agent to monitor SharePoint Online.
CAUTION: The domain name must match the SharePoint Online host name in order to properly integrate SharePoint Online activity monitoring with Enterprise Auditor.
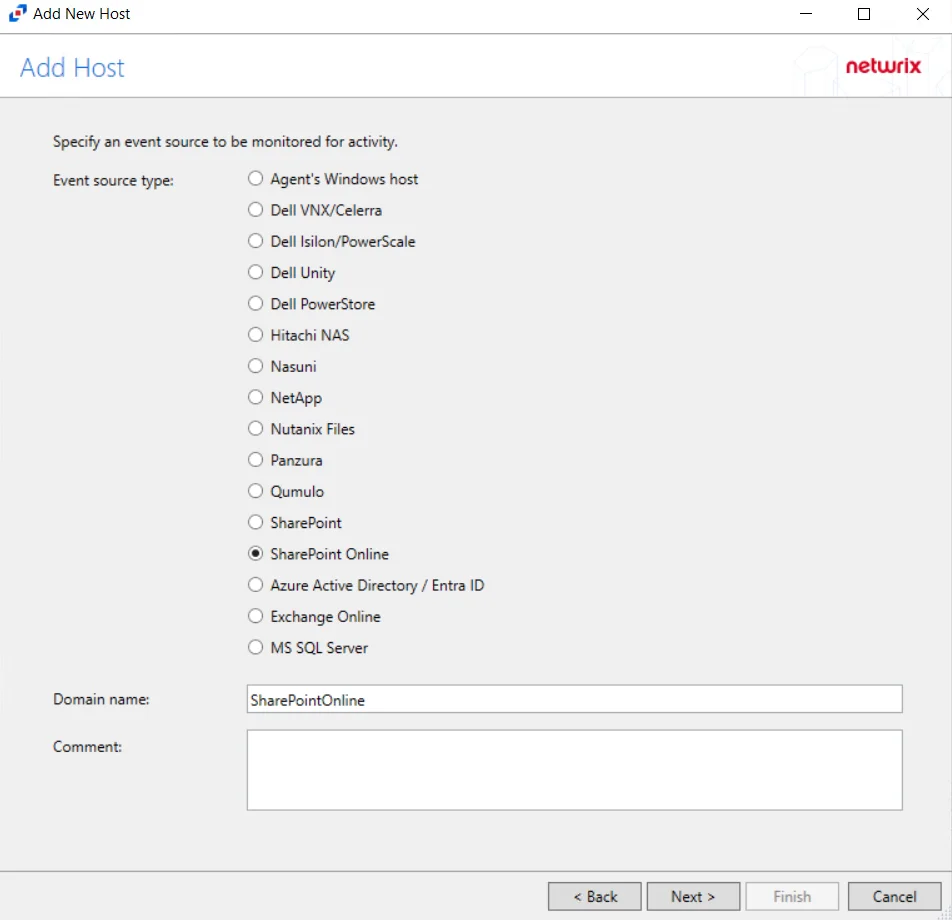
Step 3 – On the Add Host page, select the SharePoint Online radio button and enter the Microsoft Entra ID (formerly Azure AD) domain name. Click Next.
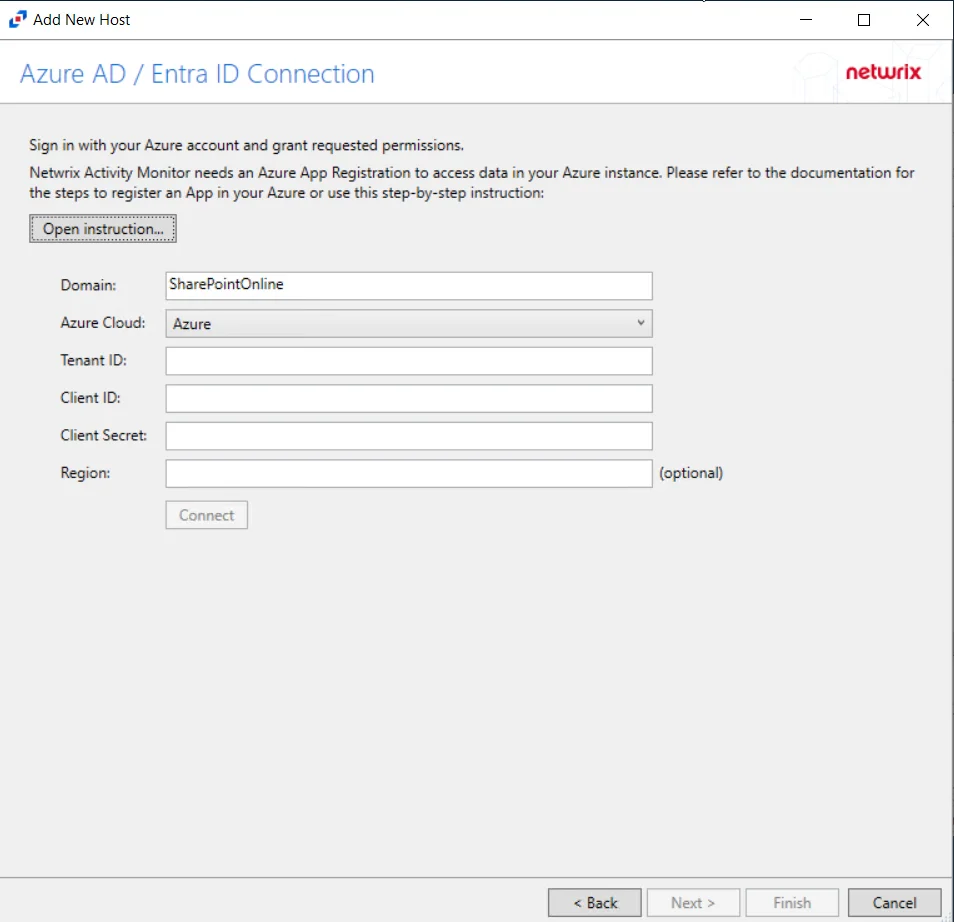
Step 4 – On the Azure AD / Entra ID Connection page, enter a Client ID and Client Secret, then click Sign-In to grant permissions to read the auditing and directory data. Click Open Instruction... for steps on registering the Activity Monitor with Microsoft Entra ID.
-
After clicking Sign-In, the Sign in to your account window opens.
-
Sign-in with a Global Administrator account.
-
Approve consent for the organization.
NOTE: Activity Monitor does not store credentials. The credentials are used to enable API access using the Client ID and Secret.
-
See the SharePoint Online Activity Auditing Configuration topic for additional information.
Click Next.
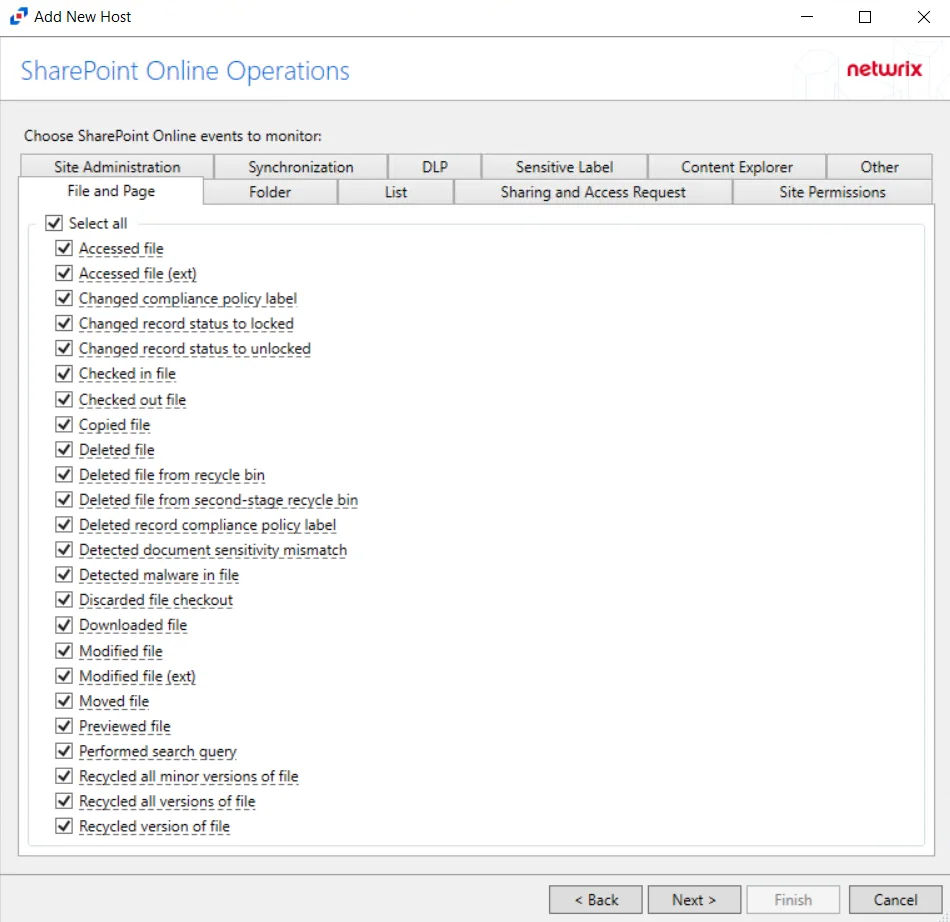
Step 5 – On the SharePoint Online Operations page, configure the options found in the following tabs:
- File and Page
- Folder
- List
- Sharing and Access Request
- Site Permissions
- Site Administration
- Synchronization
- DLP
- Sensitive Label
- Content Explorer
- Other
These options can be configured again in a SharePoint Online host's properties window. See the Operations Tab for additional information. Click Next.
Step 6 – On the Where To Log The Activity page, select whether to send the activity to either a Log File or Syslog Server. Click Next.
Step 7 – If Log File is selected on the Where To Log The Activity page, the File Output page can be configured. The configurable options are:
-
Specify output file path – Specify the file path where log files are saved. Click the ellipses button (...) to open the Windows Explorer to navigate to a folder destination. Click Test to test if the path works.
-
Period to keep Log files – Log files will be deleted after the period entered number of days entered. The default is 10 days. Use the dropdown to specify whether to keep the Log files for a set amount of Minutes, Hours, or Days.
-
This log file is for Netwrix Enterprise Auditor (StealthAUDIT) – Enable this option to have Enterprise Auditor collect this monitored host configuration
RECOMMENDED: Identify the configuration to be read by Netwrix Enterprise Auditor when integration is available.
- While the Activity Monitor can have multiple configurations per host, Netwrix Enterprise Auditor can only read one of them.
Click Next.
Step 8 – If Syslog Server is selected on the Where To Log The Activity page, the Syslog Output page can be configured. The configurable options are:
-
Syslog server in SERVER[:PORT] format – Type the Syslog server name with a SERVER:Port format in the textbox.
- The server name can be short name, fully qualified name (FQDN), or IP Address, as long as the organization’s environment can resolve the name format used. The Event stream is the activity being monitored according to this configuration for the monitored host.
-
Syslog Protocol – Identify the Syslog protocol to be used for the Event stream. The drop-down menu includes:
- UDP
- TCP
- TLS
The TCP and TLS protocols add the Message framing drop-down menu. See the Syslog Tab topic for additional information.
-
The Test button sends a test message to the Syslog server to check the connection. A green check mark or red will determine whether the test message has been sent or failed to send. Messages vary by Syslog protocol:
- UDP – Sends a test message and does not verify connection
- TCP/TLS – Sends test message and verifies connection
- TLS – Shows error if TLS handshake fails
See the Syslog Tab topic for additional information.
Click Finish.
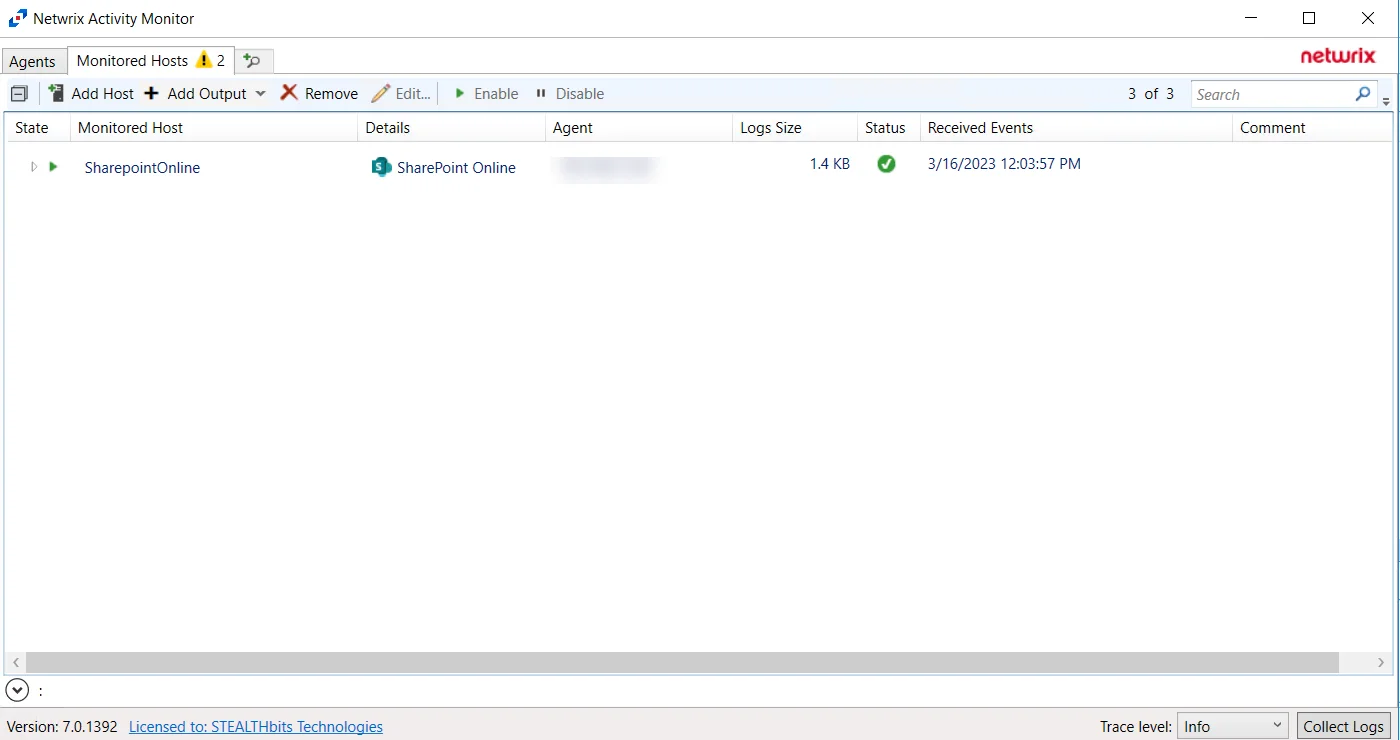
The added SharePoint Online host is displayed in the monitored hosts table. Once a host has been added for monitoring, configure the desired ouptuts. See the Output for Monitored Hosts topic for additional information.
Host Properties for SharePoint Online
Configuration settings can be edited through the tabs in the host’s Properties window. The configurable host properties are:
See the Host Properties Window topic for additional information.
SQL Server
Understanding SQL Server Activity Monitoring
The Activity Monitor provides the ability to feed activity data to other Netwrix products:
- Netwrix Enterprise Auditor
Prior to adding a SQL Server host to the Activity Monitor, the prerequisites for the target environment must be met. See the SQL Server Activity Auditing Configuration topic for additional information.
Remember, the Activity Agent must be deployed to a Windows server that acts as a proxy for monitoring the target environment.
Add MS SQL Server Host
Follow the steps to add a SQL Server host to be monitored.
Step 1 – In Activity Monitor, go to the Monitored Hosts tab and click Add. The Add New Host window opens.
Step 2 – On the Choose Agent page, select the Agent to monitor the storage device, then click Next.
Step 3 – On the Add Host page, select MS SQL Server and enter the Server name or address for the SQL Server host., then click Next.
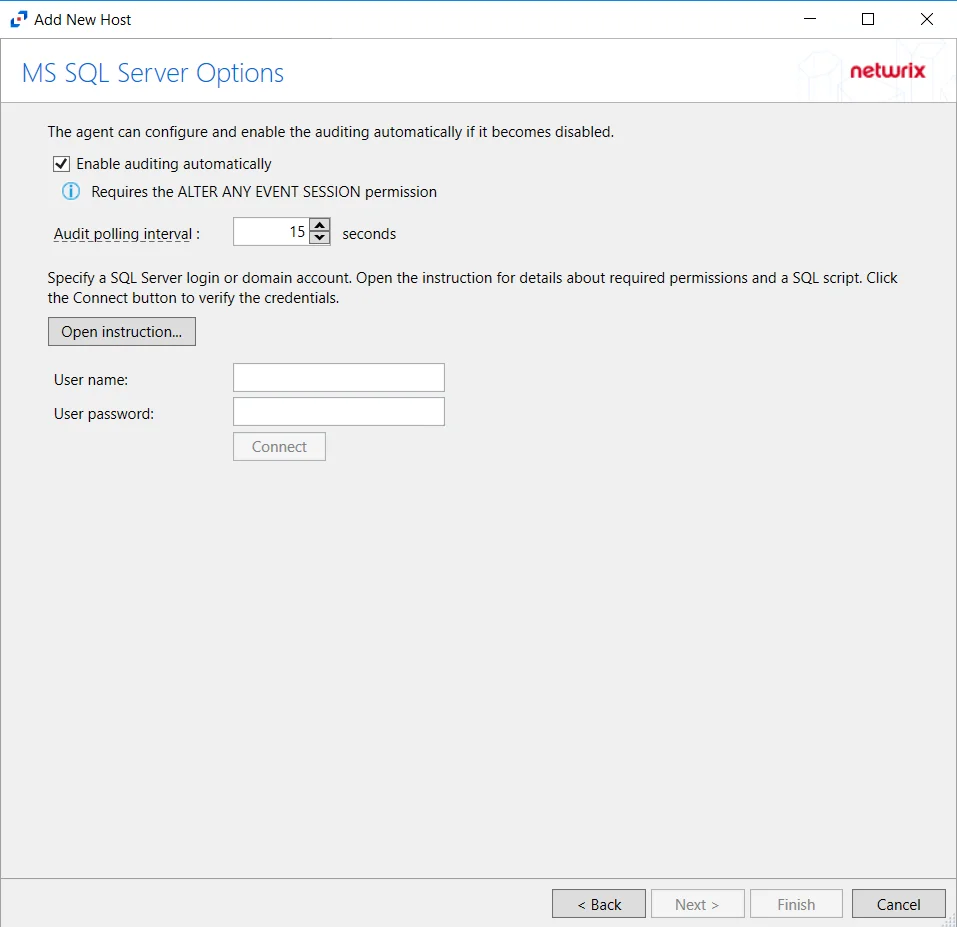
Step 4 – On the MS SQL Server Options page, configure the following options:
- Enable Audit automatically — Check the box to enable automatic auditing if it is ever disabled
- Open instruction — Opens the How to create a SQL Login for Monitoring page. See the SQL Server Database section of the SQL Server Activity Auditing Configuration topic for additional information.
- User name — Enter the user name for the credentials for the SQL Server
- User password — Enter the password for the credentials for the SQL Server
Click Connect to test the settings, then click Next.
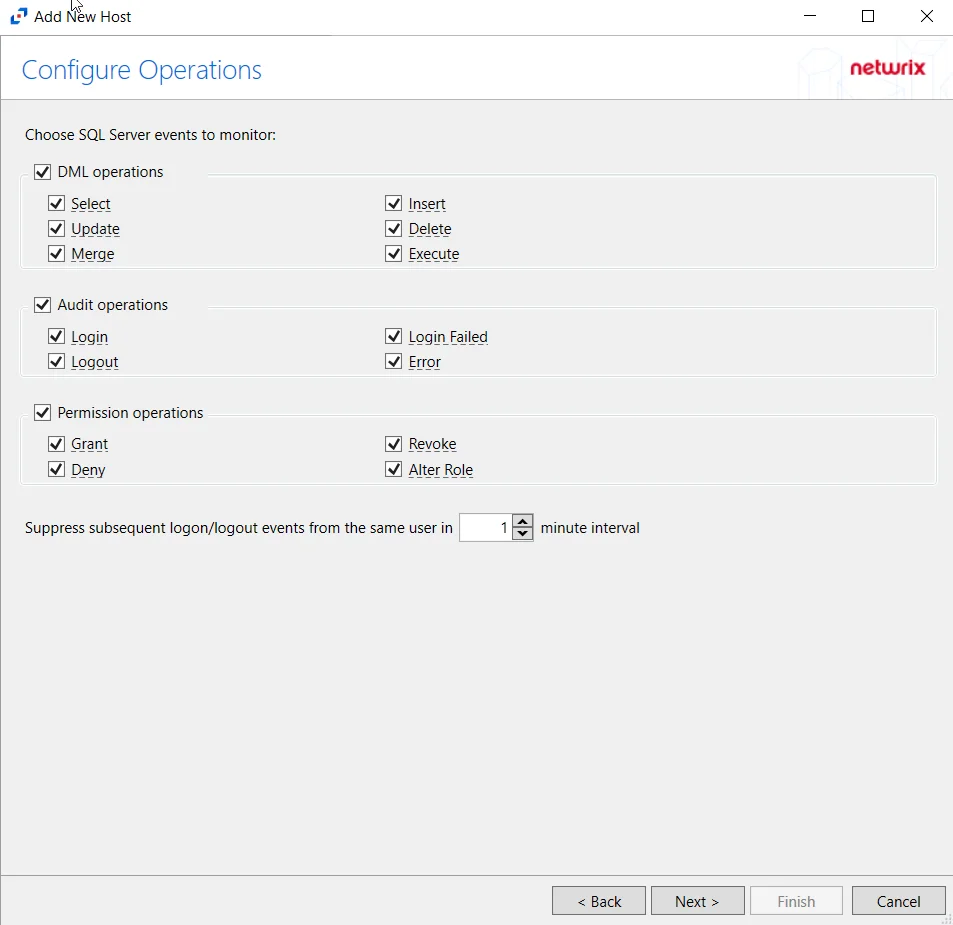
Step 5 – On the Configure Operations page, select which SQL Server events to monitor, then click Next.
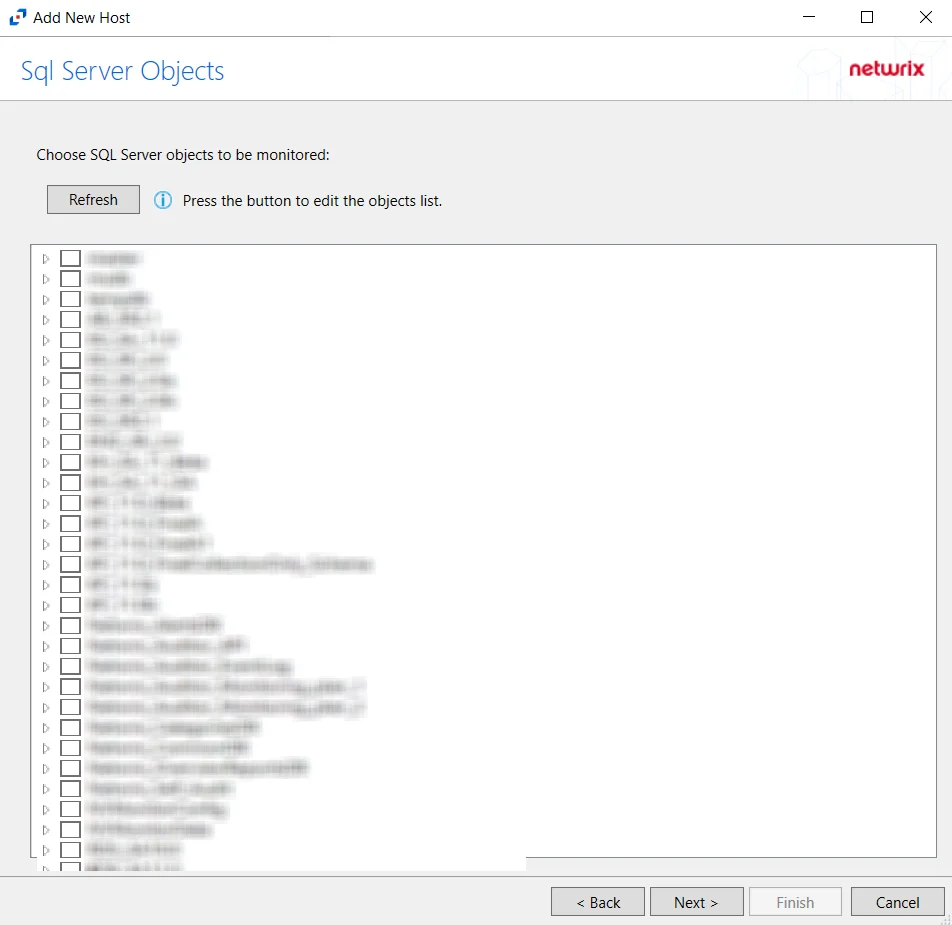
Step 6 – On the SQL Server Objects page, click Refresh. Select the SQL Server objects to be monitored. Click Next.
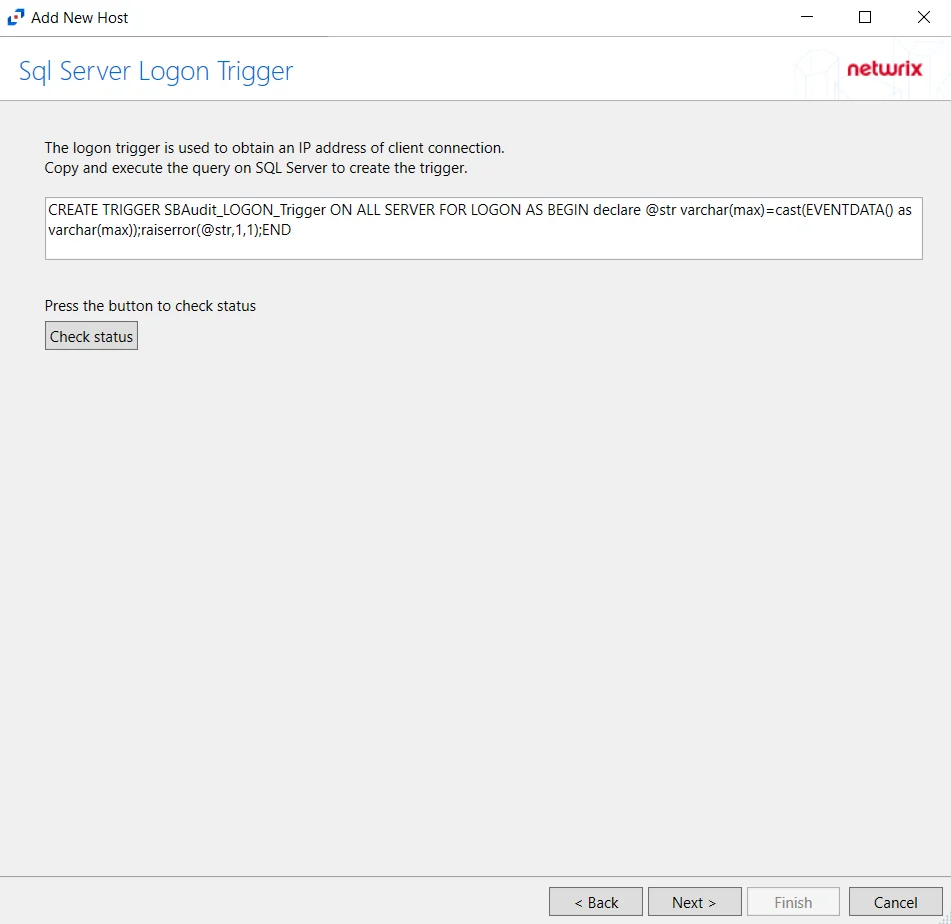
Step 7 – On the SQL Server Logon Trigger page, copy and paste the SQL script into a New Query in the SQL database. Execute the query to create a logon trigger. Netwrix Activity Monitor will monitor SQL logon events and obtain IP addresses for connections. The script is:
CREATE TRIGGER SBAudit_LOGON_Trigger ON ALL SERVER FOR LOGON AS BEGIN declare @str varchar(max)=cast(EVENTDATA() as varchar(max));raiserror(@str,1,1);END

Click Check Status to see if the trigger is configured properly, then click Next.
Step 8 – On the Configure Basic Options page,
-
Period to keep Log files - Activity logs are deleted after the number of days entered. Default is set to 10 days.
RECOMMENDED: Keep a minimum of 10 days of activity logs. Raw activity logs should be retained to meet an organization’s audit requirements.
Click Next.
Step 9 – On the Where To Log The Activity page, select whether to send the activity to either a Log File (TSV) or Syslog Server, then click Next.
Step 10 – If Log File is selected on the Where To Log The Activity page, the File Output page can be configured.
-
Specify output file path – Specify the file path where log files are saved. Click the ellipses button (...) to open the Windows Explorer to navigate to a folder destination. Click Test to test if the path works.
-
Period to keep Log files – Log files will be deleted after the period entered number of days entered. The default is 10 days. Use the dropdown to specify whether to keep the Log files for a set amount of Minutes, Hours, or Days.
-
This log file is for Enterprise Auditor – Enable this option to have Enterprise Auditor collect this monitored host configuration
RECOMMENDED: Identify the configuration to be read by Enterprise Auditor when integration is available.
- While Activity Monitor can have multiple configurations per host, Enterprise Auditor can only read one of them.
Step 11 – If Syslog Server is selected on the Where To Log The Activity page, the Syslog Output page can be configured.
-
Syslog server in SERVER[:PORT] format – Type the Syslog server name with a SERVER:Port format in the textbox.
- The server name can be short name, fully qualified name (FQDN), or IP Address, as long as the organization’s environment can resolve the name format used. The Event stream is the activity being monitored according to this configuration for the monitored host.
-
Syslog Protocol – Identify the Syslog protocol to be used for the Event stream. The drop-down menu includes:
- UDP
- TCP
- TLS
The TCP and TLS protocols add the Message framing drop-down menu. See the Syslog Tab topic for additional information.
-
The Test button sends a test message to the Syslog server to check the connection. A green check mark or red will determine whether the test message has been sent or failed to send. Messages vary by Syslog protocol:
- UDP – Sends a test message and does not verify connection
- TCP/TLS – Sends test message and verifies connection
- TLS – Shows error if TLS handshake fails
See the Syslog Tab topic for additional information.
Click Finish.
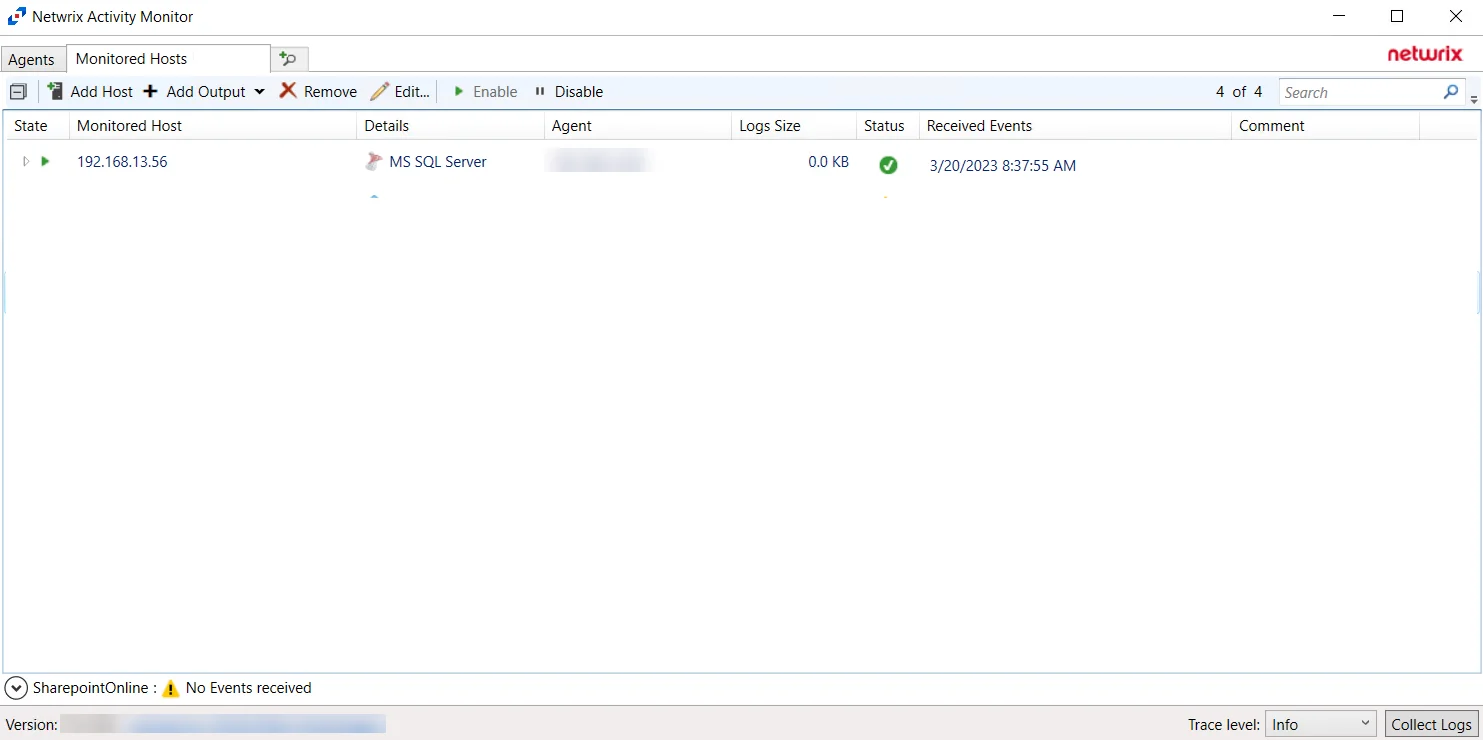
The added SQL Server host is displayed in the monitored hosts table. Once a host has been added for monitoring, configure the desired ouptuts. See the Output for Monitored Hosts topic for additional information.
Host Properties for SQL Server
Configuration settings can be edited through the tabs in the host’s Properties window. The configurable host properties are:
See the Host Properties Window topic for additional information.
Windows
Understanding File Activity Monitoring
The Activity Monitor can be configured to monitor the following:
- Ability to collect all or specific file activity for specific values or specific combinations of values
It provides the ability to feed activity data to SIEM products. The following dashboards have been specifically created for Activity Monitor event data:
- For IBM® QRadar®, see the Netwrix File Activity Monitor App for QRadar for additional information.
- For Splunk®, see the File Activity Monitor App for Splunk for additional information.
It also provides the ability to feed activity data to other Netwrix products:
- Netwrix Enterprise Auditor
- Netwrix Threat Manager
Prior to adding a Windows host to the Activity Monitor, the prerequisites for the target environment must be met. See the Windows File Server Activity Auditing Configuration topic for additional information.
Remember, the Activity Agent must be deployed to the server. It cannot be deployed to a proxy server.
Add Agent's Windows Host
Follow the steps to add a Windows host to be monitored, if it was not configured when the agent was deployed.
Step 1 – In Activity Monitor, go to the Monitored Hosts tab and click Add. The Add New Host window opens.
Step 2 – On the Choose Agent page, select the Agent to monitor deployed on the Windows file server. Click Next.

Step 3 – On the Add Host page, select the Agent’s Windows host radio button. Remember, the agent must be deployed on the Windows file server to be monitored. If desired, add a Comment. Click Next.
Step 4 – On the Protocols page, select which protocols to monitor. The protocols that can be monitored are:
- All
- CIFS
- NFS
Click Next.
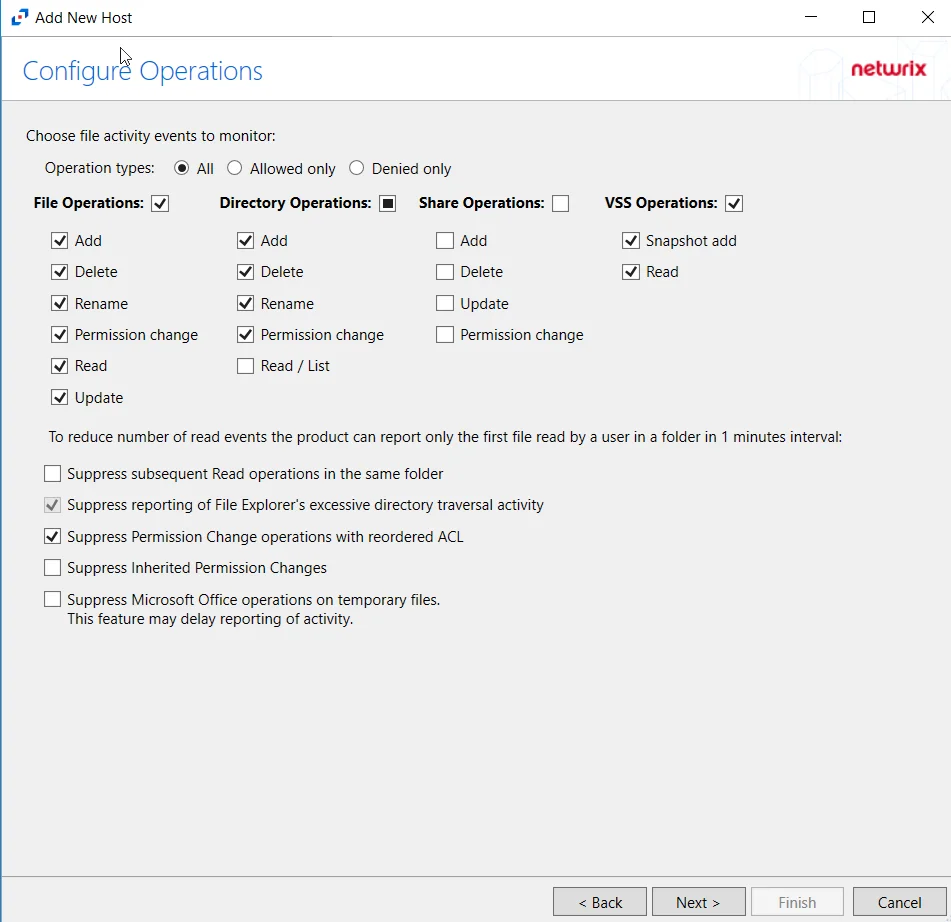
Step 5 – On the Configure Operations page, select the File Operations,Directory Operations, Share Operations and VSS Opertions to be monitored. Users may also filter events by operation type by selecting the radio button:
- All – Reports both allowed and denied operations
- Allowed only – Reports only allowed operations
- Denied only – Reports only denied operations
Additional options include:
CAUTION: Enabling the Suppress subsequent Read operations in the same folder option can result in Read events not being monitored.
- Suppress subsequent Read operations in the same folder – Logs only one Read operation when subsequent Read operations occur in the same folder. This option is provided to improve overall performance and reduce output log volume.
- Suppress reporting of File Explorer's excessive directory traversal activity – Filters out events of excessive directory traversal in File Explorer.
- Suppress Permission Change operations with reordered ACL – Prevents tracking events where permission updates occurred resulting in reordered ACEs (Access Control Entries) but with no other changes in the ACL (Access Control List). For example, if a user is removed in the security settings of a file, and then the same user is added back with the same security permissions, the change is not logged.
- Suppress Inherited Permission Changes – Filters out events for inherited permission changes. This option is provided to improve overall performance and reduce output activity log volume.
- Suppress Microsoft Office operations on temporary files – Filters out events for Microsoft Office temporary files. When Microsoft Office files are saved or edited, many temporary files are created. With this option enabled, events for these temporary files are ignored.
Click Next.
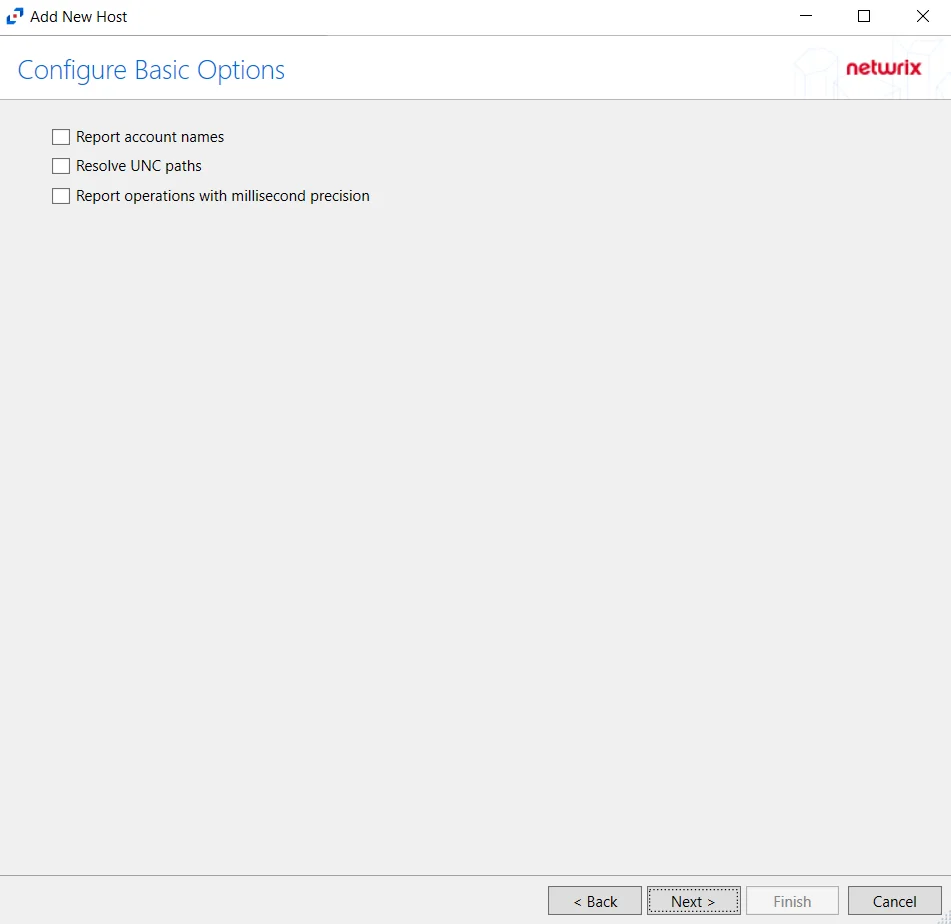
Step 6 – On the Configure Basic Options page, choose which settings to enable. The “Log files” are the activity logs created by the activity agent on the target host. Select the desired options:
- Report Account Names – Adds an Account Name column in the generated TSV files
- Report UNC paths – Adds a UNC Path column and a Rename UNC Path column in the generated TSV files
- This option corresponds to the REPORT_UNC_PATH parameter in the INI file. It is disabled by
default. The UNC Path is in the following format:
- For CIFS activity – \[HOST][SHARE][PATH]
- Example CIFS activity – \ExampleHost\TestShare\DocTeam\Temp.txt
- When the option is enabled, the added columns are populated when a file is accessed remotely through the UNC Path. If a file is accessed locally, these columns are empty. These columns have also been added as Syslog macros.
- This option corresponds to the REPORT_UNC_PATH parameter in the INI file. It is disabled by
default. The UNC Path is in the following format:
- Report operations with millisecond precision – Changes the timestamps of events being recorded in the TSV log file for better ordering of events if multiple events occur within the same second
Click Next.
Step 7 – On the Where To Log The Activity page, select whether to send the activity to either a Log File) or Syslog Server. Click Next.

Step 8 – If Log File) is selected on the Where To Log The Activity page, the File Output page can be configured.
-
Specify output file path – Specify the file path where log files are saved. Click the ellipses button (...) to open the Windows Explorer to navigate to a folder destination. Click Test to test if the path works.
-
Period to keep Log files – Log files will be deleted after the period entered number of days entered. The default is 10 days. Use the dropdown to specify whether to keep the Log files for a set amount of Minutes, Hours, or Days.
-
This log file is for Enterprise Auditor – Enable this option to have Enterprise Auditor collect this monitored host configuration
RECOMMENDED: Identify the configuration to be read by Enterprise Auditor when integration is available.
- While Activity Monitor can have multiple configurations per host, Enterprise Auditor can only read one of them.
Click Next.
Step 9 – If Syslog Server is selected on the Where To Log The Activity page, the Syslog Output page can be configured.
-
Syslog server in SERVER[:PORT] format – Type the Syslog server name with a SERVER:Port format in the textbox.
- The server name can be short name, fully qualified name (FQDN), or IP Address, as long as the organization’s environment can resolve the name format used. The Event stream is the activity being monitored according to this configuration for the monitored host.
-
Syslog Protocol – Identify the Syslog protocol to be used for the Event stream. The drop-down menu includes:
- UDP
- TCP
- TLS
The TCP and TLS protocols add the Message framing drop-down menu. See the Syslog Tab topic for additional information.
-
The Test button sends a test message to the Syslog server to check the connection. A green check mark or red will determine whether the test message has been sent or failed to send. Messages vary by Syslog protocol:
- UDP – Sends a test message and does not verify connection
- TCP/TLS – Sends test message and verifies connection
- TLS – Shows error if TLS handshake fails
See the Syslog Tab topic for additional information.
Click Finish.
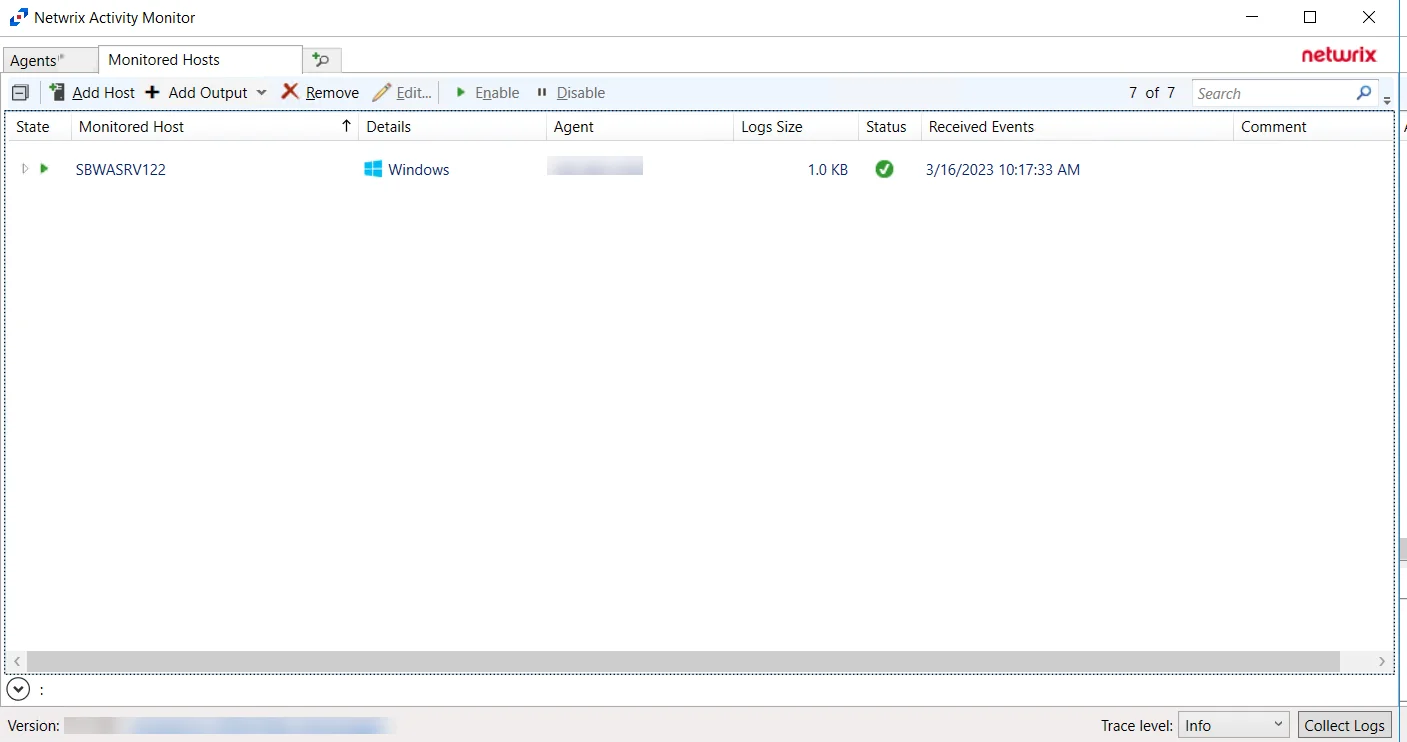
The added Windows file server host is displayed in the monitored hosts table. Once a host has been added for monitoring, configure the desired ouptuts. See the Output for Monitored Hosts topic for additional information.
Host Properties for Windows File Server
Configuration settings can be edited through the tabs in the host’s Properties window. The configurable host properties are:
See the Host Properties Window topic for additional information.