Agent Properties Window
On the Agents tab, the Edit button opens the agent’s Properties window, which contains the following tabs:
- Active Directory Tab – AD Agent only
- AD Users Tab
- API Server Tab
- Archiving Tab
- Additional Properties Tab
- Connection Tab
- Disk Quota Tab
- Dell CEE Options Tab – Activity Agent only
- DNS Tab
- Inactivity Alerts Tab
- Linux Tab – Linux Agent only
- NetApp FPolicy Options Tab – Activity Agent only
- Network Tab
- Network Proxy Tab
- Nutanix Tab – Activity Agent only
- Panzura Tab – Activity Agent only
- Qumulo Tab – Activity Agent only
Select the desired agent and click Edit to open the agent’s Properties window.
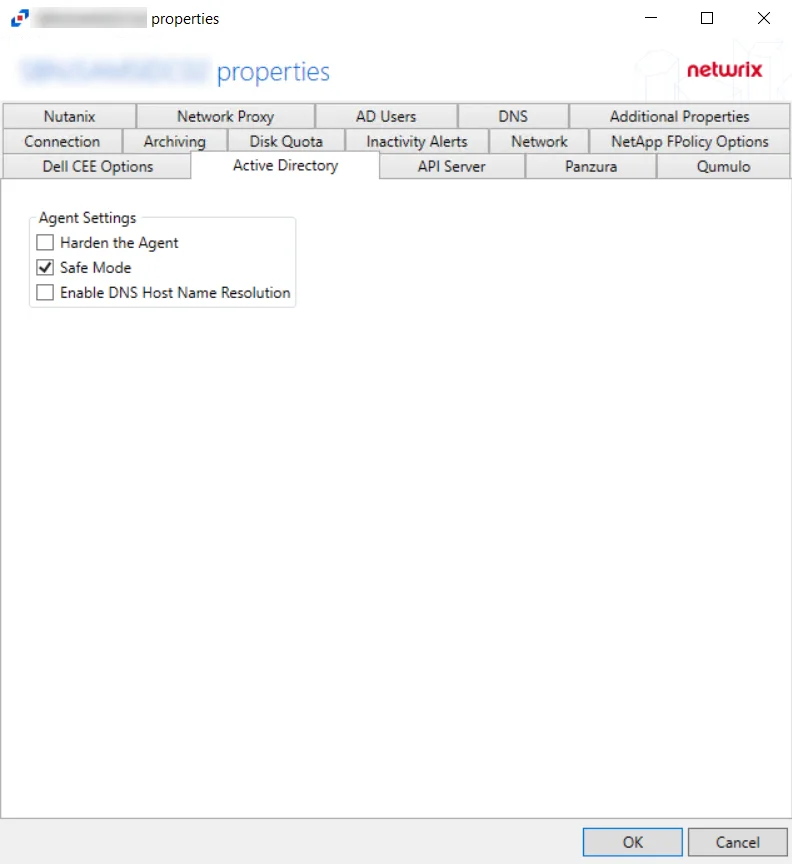
Active Directory Tab
The Active Directory tab provides options to configure the agent settings for monitoring an Active Directory domain controller. These settings are part of the Active Directory monitoring and can only be enabled for agents on domain controllers.
The Agent Settings allow users to control the AD agent’s properties:
-
Harden the Agent – Protects the AD agent from being altered, stopped, or started from within the local Service Control Manager
-
Safe Mode – If selected, the AD agent checks LSASS versions upon start up. Any change in LSASS since the previous start prevents the monitoring modules from loading.
NOTE: This is a safety measure that disables monitoring if the environment changes as in rare cases the instrumentation may cause LSASS crashes. Should the version change occur, a warning will be shown next to the agent on the Agents page. The Start pending modules button allows you to force the agent to enable monitoring.
-
Enable DNS Host Name Resolution – If selected, the AD agent looks up the missing data (a NetBIOS name, a Fully Qualified Domain Name, or an IP Address) that is missing fromthe event
NOTE: This provides more uniform data, but may have a performance impact on the machine where the AD agent is deployed, especially if that machine does not handle the name resolution locally.
Click OK to commit the modifications. Click Cancel to discard the modifications. The Agent Properties window closes.
Advanced Active Directory Monitoring using StealthINTERCEPT
More advanced Active Directory Monitoring features are available for use through Threat Prevention. See the following sections for additional information:
- See the Migrate Active Directory Monitoring to StealthINTERCEPT topic for additional information
- See the Configuring StealthINTERCEPT to Send Active Directory Activity to the Activity Monitor topic for additional information
Migrate Active Directory Monitoring to StealthINTERCEPT
To transfer Active Directory Activity Monitoring from the Activity Monitor to Threat Prevention, deploy Threat Prevention Agents to targeted domain controllers.
NOTE: If Threat Prevention installed SI Agents on domain controllers before the Activity Monitor AD agents were deployed, then skip to the next set of instructions to configure Active Directory Monitoring through Threat Prevention.
If Threat Prevention data is not used by other Netwrix products, uninstall the activity agent from the domain controllers if you do not plan to receive Active Directory activity in Activity Monitor anymore and the agents are not used for file system monitoring. If Threat Prevention data is to be used by other Netwrix products, see the Configuring StealthINTERCEPT to Send Active Directory Activity to the Activity Monitor topic for additional information.
Configuring StealthINTERCEPT to Send Active Directory Activity to the Activity Monitor
Once the activity agent is deployed to a domain controller with an existing Threat Prevention agent, a connection can be secured between both agents. Follow these instructions to configure the policy used for Active Directory Activity Monitoring from the Threat Prevention Admin Console.
Step 1 – Configure the File, Syslog, or Threat Manager outputs on the Monitored Domains Tab in the Activity Monitor Console. See the Output for Monitored Domains topic for additional information.
Step 2 – Within the Threat Prevention Admin Console, select the Threat Manager Event Sink Configuration Window option under the Configuration menu, and enter amqp://localhost:4499 within the Threat Manager URI field on the pop-up window. Then click Save.
Step 3 – Still within Threat Prevention, create a New Policy or select an existing one to send Active Directory events data to Activity Monitor. See the Navigation Pane Right-Click Commands section of the Netwrix Threat Prevention Documentation for additional information.
Step 4 – Enter a description within the General Tab of the New Policy Configuration page to identify the AD Module policy settings. Click the button in front of the policy status to toggle from Disabled to Enabled.
Step 5 – On the Event Type Tab, add events and objects to monitor. Click the AD Operations to include in the policy.
Step 6 – Under the Actions Tab, check the Send to StealthDEFEND checkbox to enable sending Active Directory Activity events data to Activity Monitor. Click Save
See the Netwrix Threat Prevention Documentation for additional information on policy configurations.
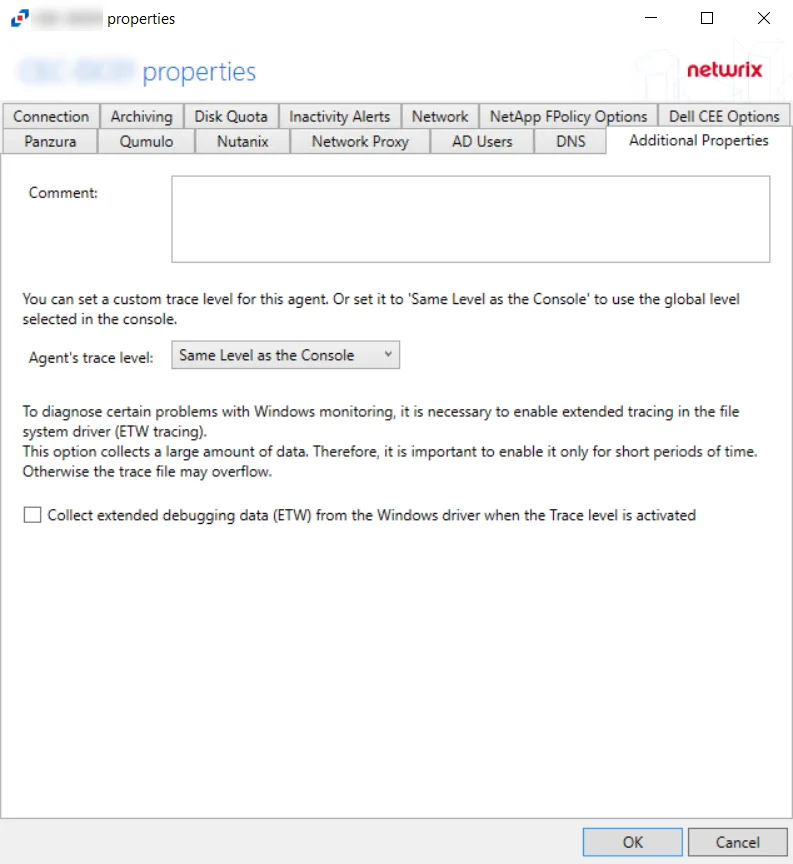
Additional Properties Tab
The Additional Properties Tab provides additional configuration options for the agent. The tab varies based on the type of agent selected.
For Activity Agent
The Additional Properties tab for the Activity Agent has the following configuration options:
-
Comment – Create an annotation for the agent in the Comment text box. Annotations entered here will appear in the Comment column in the table on the Agents tab.
-
Agent's Trace Level – Select a trace level for the agent log from the drop-down list:
-
Same Level as the Console (uses the global level selected in the console)
-
Trace (the most verbose) many collection points and can slow down
CAUTION: Selecting the Trace option can slow down collection due to the large amount of data points
-
Debug
-
Info (recommended)
-
Warning
-
Error
-
Fatal
-
In certain situations, the trace logs are not enough to identify issues. Collect extended debugging data (ETW) can be useful for problems related to the following:
- Not getting events
- Missing event attributes
- Getting unexpected events
- High RAM/CPU caused by SBTService
- Issues caused by Antivirus or Backup software
When this is needed, enable the Collect extended debugging data (ETW) from the Windows driver when the Trace level is activated option to diagnose these problems.
CAUTION: Selecting this option collects a large amount of data. Therefore, it is important to enable it only for short periods of time. Otherwise, the trace file may overflow with data.
In general for troubleshooting, start with trace logs. If the root cause of the problem might be a low-level functionality the driver, then the ETW logs must be enabled.
Click OK to commit the modifications. Click Cancel to discard the modifications. The Agent Properties window closes.
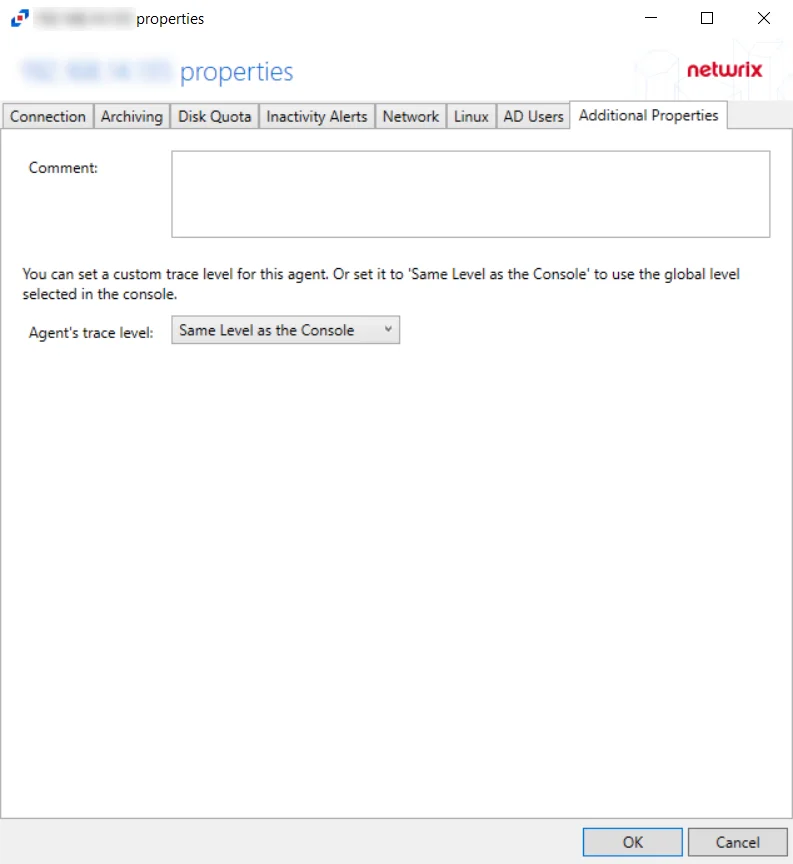
For Linux Agent
The Additional Properties tab for the Linux Agent has the following configuration options:
-
Comment – Create an annotation for the agent in the Comment text box. Annotations entered here will appear in the Comment column in the table on the Agents tab.
-
Agent's Trace Level – Select a trace level for the agent log from the drop-down list:
-
Same Level as the Console (uses the global level selected in the console)
-
Trace (the most verbose) many collection points and can slow down
CAUTION: Selecting the Trace option can slow down collection due to the large amount of data points
-
Debug
-
Info (recommended)
-
Warning
-
Error
-
Fatal
-
Click OK to commit the modifications. Click Cancel to discard the modifications. The Agent Properties window closes.
AD Users Tab
Use the AD Users tab to customize Active Directory service queries and caching behavior.
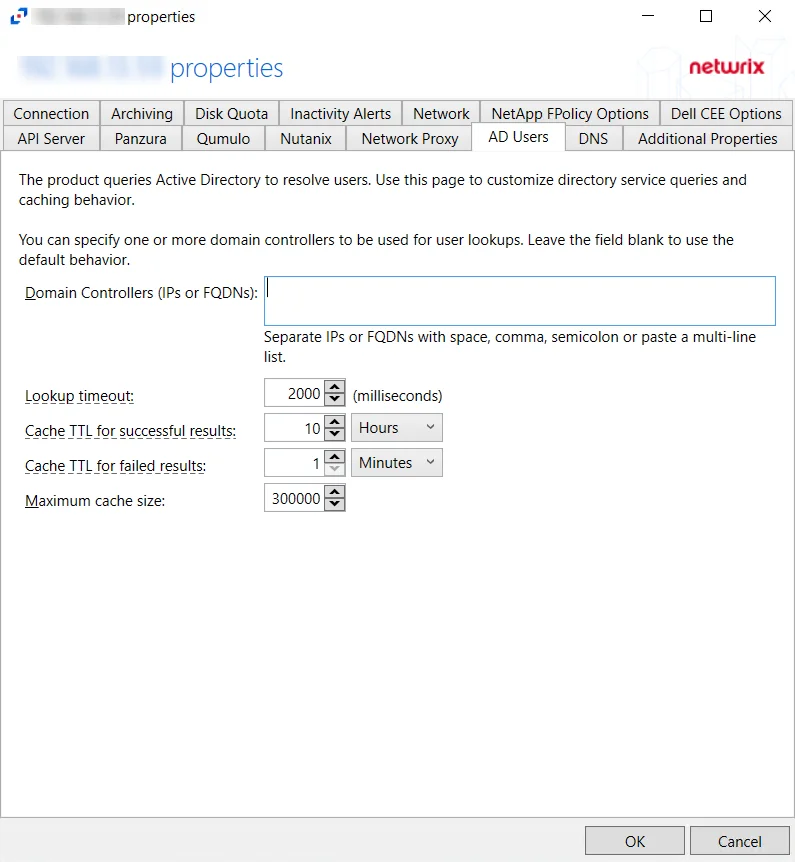
The configurable options are:
- Domain Controllers (IPs and FQDNs) – IP addresses or FQDN of domain controllers. IP addresses or FQDN should be entered as separate addresses with space, comma (,), semicolon (;), or a multi-line list. Leave the box blank to use the default domain controller.
- Lookup timeout – Specify the time for look-up timeout in milliseconds. The default is 2000 milliseconds. If a query fails to complete in the specified interval then the product reports an empty username or a previous result from the cache. The product continues to wait for a response in the background so that further events can use the resolution result.
- Cache TTL for successful results –Specify the caching interval (time-to-live) for successful AD responses.The default is 10 hours. When an AD query returns a valid username or SID, the response is cached for the specified time. It is recommended to use large TTL values as the user information does not often change.
- Cache TTL for failed results – Specify the caching interval (time-to-live) for failed AD responses. The default is 1 minute. When an AD query cannot resolve a SID or username, the failed result is cached for the specified time. Caching of failed responses helps to reduce the load on domain controllers and improve performance of event processing. Short TTL values are recommended to make the product report accurate user information.
- Maximum cache size – Specify the maximum cache size for both successful and failed responses. The default is 300000.
Click OK to commit the modifications. Click Cancel to discard the modifications. The Agent Properties window closes.
API Server Tab
The API Server Tab provides options to configure API server settings to send information about agents, agent configuration, and agent data to applications remotely. If an application wants to read the activity data using the API, the API Server must be enabled on each agent collecting activity.
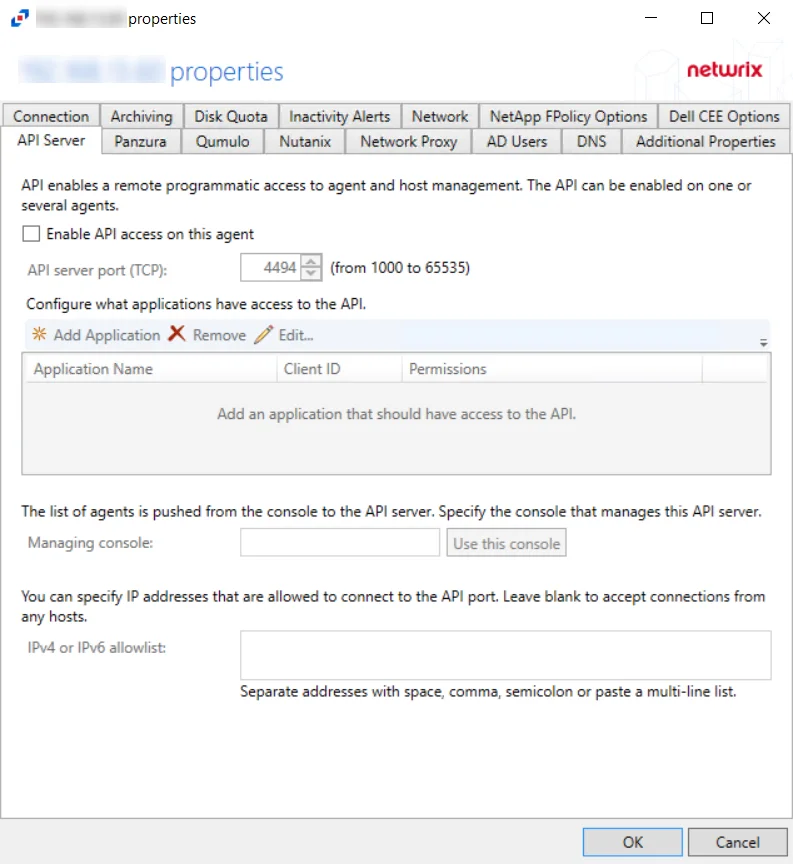
Check the Enable API access on this agent box to utilize the options on this tab:
- API server port (TCP): [number] (from 1000 to 65535) – Enter the API server port. The default is 4494.
- Configure what applications have access to the API – Specifies which API servers can be included
or excluded from receiving event data.
- Add Application – Click Add Application to open the Add or edit API client window to add an Application name to the list
- Remove – Select an Application Name and click Remove to remove an Application name from the list
- Edit – Select an Application Name and click Edit... to open the Add or edit API client window for that Application Name
Grant or revoke access to the API Server by registering applications.
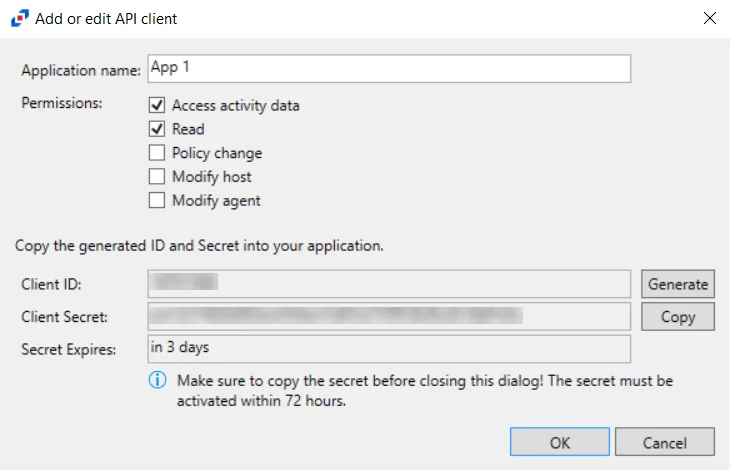
Click Add Application to open the Add or edit API client window.
- Application name – Name of application to provide read-only access to
- Permissions – list of permissions for Activity Monitor through API Server
- Access activity data – Provides a read-only access to the activity log files of the agent hosting the API Server. The access is provided to the files stored on the agent's server or on the archival network share. The permission also provides minimal and read-only access to configuration of monitored hosts/domain, enough to match the monitored hosts to their log files.
- Read – Provides a read-only access to the list of the agents and their configuration settings; configuration of monitored domains; configuration of monitored hosts. The permission does not provide access to the saved passwords or other secrets.
- Policy change - Provides permissions required to update the AD Monitoring domain configuration settings
- Modify host - Provides permissions required to update the monitored hosts settings
- Modify agent - Provides permissions required to update the agent hosts settings
- Client ID/Generate – Generate button creates a new Client ID and Client Secret (password) credentials for applications to access API server
- Client Secret/Copy – Copy button copies the Client ID and Client Secret (password) into its respective textbox after the application is added or the Generate button is pressed
- Secret Expires – Displays the number of days until the Client Secret expires before activated. The default is 3 days.
The options below the API Application Access window are:
- Managing console/Use this console – Use this console button enters the host name of the Activity Monitor Console within the textbox
- IPv4 or IPv6 whitelist – IP Addresses of the remote hosts, which are allowed to connect to the API port, can be whitelisted by entering them in the box. IP Addresses should be entered as separate addresses with space, comma (,), semicolon (;), or a multi-line list. Leave the box blank to accept connections from any hosts.
Click OK to commit the modifications. Click Cancel to discard the modifications. The Agent Properties window closes.
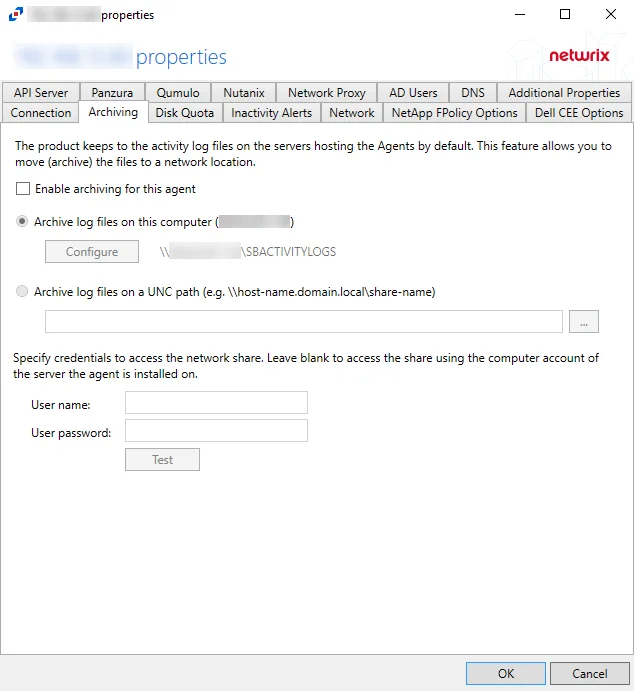
Archiving Tab
By default, the Activity Monitor keeps the activity logs on the servers where the activity agents are deployed. The Archiving tab provides users with options to enable archiving for the activity agent and move the archived files to another location on the server or to a network location.
The Days to keep Log files option, listed under the Log Files tab within Host Properties, applies to Archive log files. When the entered number of days entered have passed, the activity logs and Archive log files are deleted. The path to the Archive log files is next to the Configure button, and listed under the Archive Location column within the Agents tab.
Check the Enable archiving for this agent box to enable the options on this tab. The archive feature is disabled by default.
- Disk Quota — Maximum disk space the agent is allowed to use on the server it is installed on (at least 100MB) – Select the number of megabytes or gigabytes. The default is 5 GB.
- Archive log files on this computer – Select to archive the logs on the server hosting this activity agent. When archiving is enabled, this is the default selection. Click Configure to open the Configure a network share on this computer window and provide the following information:
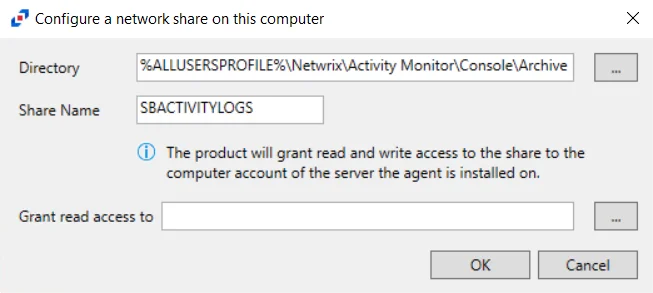
The options in the Configure a network share on this computer window are:
- Directory – Click the ellipsis (…) to browse to a location on the server
- Share name – Enter the share name for the archives
- Grant read access to – Click the ellipsis (…) to specify an account or group to be granted Read and Write access to the archive
The options below the Configure button are:
- Archive log files on an UNC path (e.g. \host-name.domain.local\share-name) – Click the ellipsis (…) to browse for a location and select the UNC path
- User name/User password – Specify credentials to access the network share. Leave the credentials blank to access the share using the credentials supplied for activity agent deployment.
- Test – Click Test to ensure a successful connection to the network share
Click OK to commit the modifications. Click Cancel to discard the modifications. The Agent Properties window closes.
NOTE: Linux agents move activity logs to a set local path. Remote storage can be mounted to use this path for archiving.
Connection Tab
The Connection tab allows users to modify the agent host server name and the credentials used for installation and communication. The tab varies based on the type of agent selected.
For Activity Agent
The server name can be modified in the text box. Modifying the name value does not move the activity agent to a new server. The credentials can be updated or modified as well.
Remember, Test the credentials before clicking OK to ensure a successful connection.
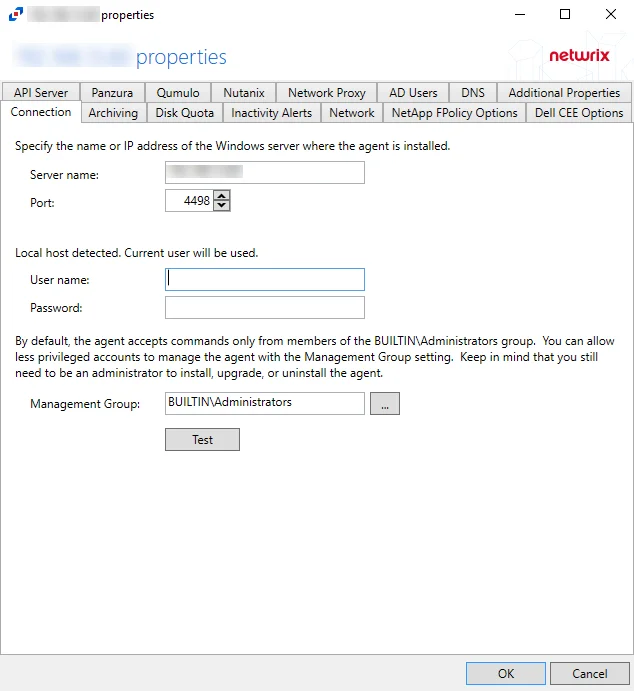
Agent server fields:
- Server name – Name or IP address of the server where the agent is deploy
- Port – Port the agent uses for communication with the application
Credential fields:
- User name – Account provisioned for use by the agent
- Password – Password for the supplied User name
Permissions
This account must be:
- Membership in the local Administrators group
If the user name is not specified, the currently logged in user's account will be used.
Less Privileged Permissions Option
By default, the agent accepts commands only from members of the local Administrators group. You can allow less privileged accounts to manage the agent with the Management Group option. Keep in mind that you still need to be an administrator to install, upgrade, or uninstall the agent. The Management Group applies to the users of the console and API servers. The Management Group does not restrict access to the agents, but grants access to its members in addition to existing members of the local Administrators group.
The Specify account or group window is opened from a field where a Windows account is needed.
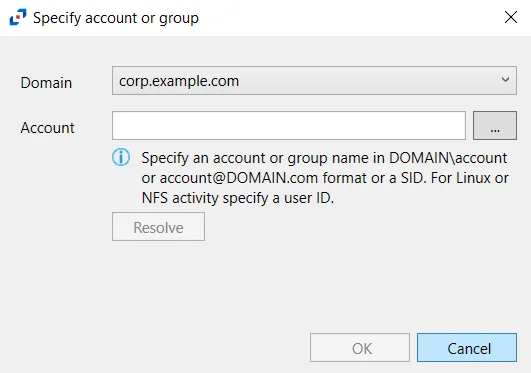
Follow the steps to use this window.
Step 1 – Select the Domain from the drop-down menu.
Step 2 – Enter the Account in the textbox.
- Accounts can be entered in NTAccount format, UPN format, or SID format.
- Use the ellipsis (…) button to open the Select Users, Computers, Service Accounts, or Groups window to browse for an account.
Step 3 – Then click Resolve. A message displays indicating whether or not the account could be resolved.
Step 4 – If successful, click OK.
The Specify account or group window closes, and the account is added to the field where the window was opened.
Click OK to commit the modifications. Click Cancel to discard the modifications. The Agent Properties window closes.
For Linux Agent
The server name can be modified in the text box. Modifying the name value does not move the Linux agent to a new server. The credentials can be updated or modified as well.
Remember, Test the credentials before clicking OK to ensure a successful connection.
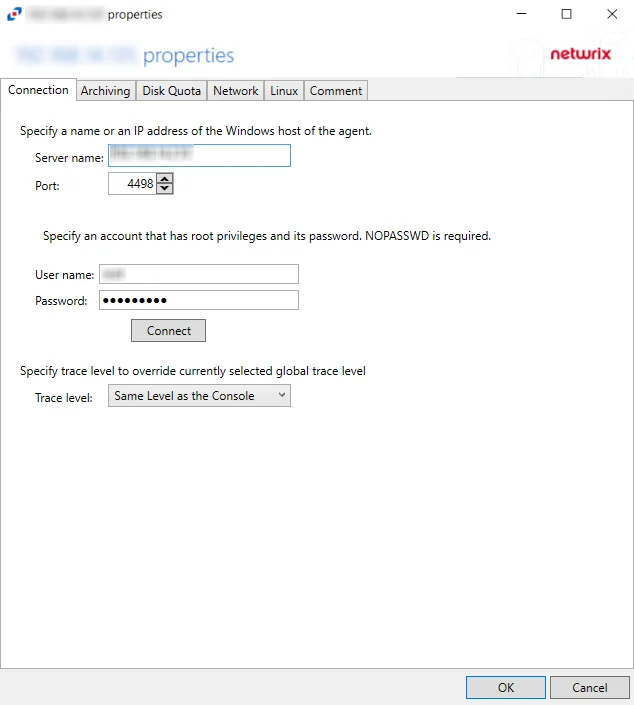
Agent server fields:
- Server name – Name or IP address of the server where the agent is deploy
- Port – Port the agent uses for communication with the application
Credential fields:
- User name – Account provisioned for use by the agent
- Password – Password for the supplied User name
Permissions
This account must be:
- Root privileges with password (or SSH private key)
The Trace level option configures the level for the agent log it includes the following levels:
-
Same Level as the Console (uses the global level selected in the console)
-
Trace (the most verbose) many collection points and can slow down
CAUTION: Selecting the Trace option can slow down collection due to the large amount of data points
-
Debug
-
Info (recommended)
-
Warning
-
Error
-
Fatal
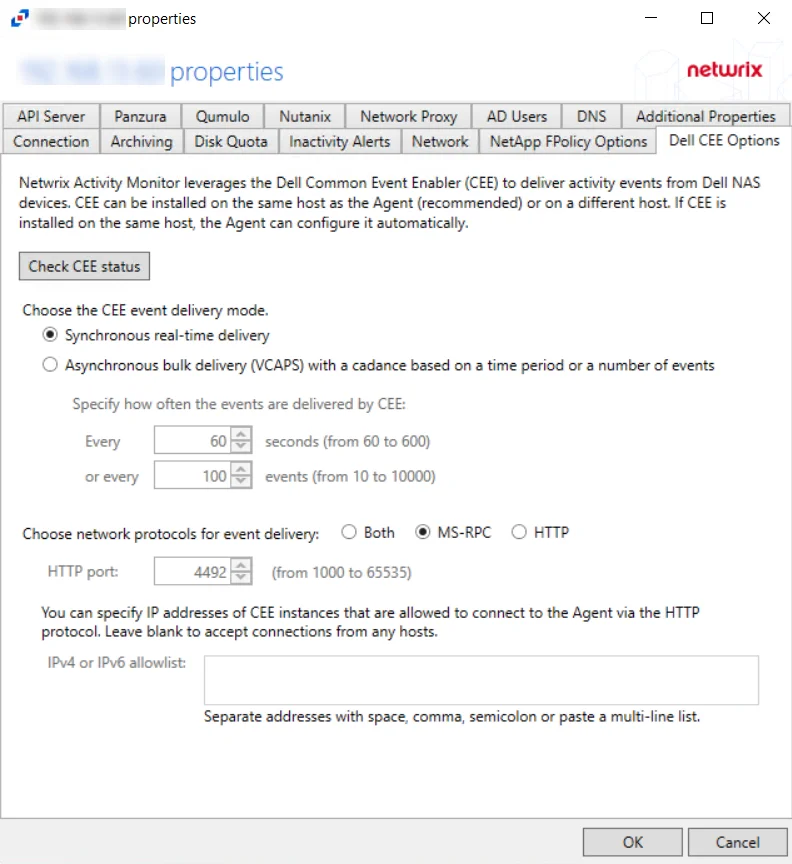
Dell CEE Options Tab
The Dell CEE Options tab provides options to configure Dell Common Event Enabler (CEE) settings for monitoring Dell devices. File activity monitoring leverages the Dell CEE to deliver activity events from Dell devices.
CEE supports two protocols to deliver events to Activity Monitor: RPC and HTTP. An agent can receive activity from several CEEs at the same time. Among them can be a local Windows CEE, remote Windows and Linux CEEs. Windows versions of CEEs can use both RPC and HTTP protocols. Linux versions can only support HTTP protocols.
NOTE: Dell CEE can be installed on the same host as the activity agent, or on a different host. If it is installed on the same host, the activity agent can configure it automatically.
The options are:
-
Check CEE Status – Click the button to confirm the status of Dell CEE installed on the agent server
-
Choose the CEE event delivery mode:
-
Synchronous real-time delivery – Events are delivered immediately as they occur, one by one.
-
Asynchronous bulk delivery (VCAPS) - Events are delivered in batches with a cadence based on a time period or a number of events. As this mode provides better throughput, it is recommended for heavily loaded servers. If selected, specify how often events are delivered by Dell CEE using the following options:
- Every [number] seconds (from 60 to 600) - Default is 60 seconds
- Or every [number] events (from 10 to 10000) - Default is 100 events
- The number of events and number of seconds, are used simultaneously, whichever is reached first
-
-
Choose network protocols for event delivery:
-
Both – Delivers events via MS-RPC and HTTP protocol
-
MS-RPC – Delivers events via the MS-RPC protocol (Windows versions of CEE only)
-
HTTP – Delivers events via the HTTP protocol (Windows and Linux versions of CEE)
- HTTP port – The port number to communicate with the agent. The default port number is 4492, modify if needed. The agent will add the port to the firewall exclusions automatically.
- IPv4 or IPv6 allowlist – Specify IP addresses of CEE instance that are allowed to connect to the agent via the HTTP protocol. Leave blank to accept connections from any host.
-
NOTE: For Remote Windows CEE or Linux CEE, Manual Configuration is needed.
Click OK to commit the modifications. Click Cancel to discard the modifications. The Agent Properties window closes.
Windows CEE Manual Configuration
Windows CEE is configured with the windows registry and depends on the selected event delivery mode, AUDIT or VCAPS.
For the synchronous real-time delivery mode (AUDIT), use the following steps.
Step 1 – Navigate to the following windows registry key
HKEY_LOCAL_MACHINE\SOFTWARE\EMC\CEE\CEPP\Audit\Configuration.
Step 2 – Set the Enabled parameter to 1.
Step 3 – If the EndPoint parameter is empty, set it to the string listed below. If it is not
empty (i.e. some other 3rd party application is also receiving activity events from CEE), append the
following string to the existing EndPoint value, separating them with a semicolon.
- For the RPC protocol,
StealthAUDIT@ip-address-of-the-agent - For the HTTP protocol,
StealthAUDIT@http://ip-address-of-the-agent:port
Step 4 – Restart the CEE Monitor service.
For the asynchronous bulk delivery mode with a cadence based on a time period or a number of events (VCAPS), use the following steps.
Step 1 – Navigate to the following windows registry key
HKEY_LOCAL_MACHINE\SOFTWARE\EMC\CEE\CEPP\VCAPS\Configuration.
Step 2 – Set the Enabled parameter to 1.
Step 3 – If the EndPoint parameter is empty, set it to the string listed below. If it is not
empty (i.e. some other 3rd party application is also receiving activity events from CEE), append the
following string to the existing EndPoint value, separating them with a semicolon.
- For the RPC protocol,
StealthVCAPS@ip-address-of-the-agent - For the HTTP protocol,
StealthVCAPS@http://ip-address-of-the-agent:port
Step 4 – Set FeedInterval to how often, in seconds, information is sent from CEE to the
Activity Monitor. The default is 60 seconds. The range is from 60 seconds to 600 seconds.
Step 5 – Set MaxEventsPerFeed to how many events must occur before information is sent from
CEE to Activity Monitor. The default is 100 events. The range is from 10 events to 10,000 events.
NOTE: The FeedInterval and MaxEventsPerFeed delivery cadences are used simultaneously.
Step 6 – Restart the CEE Monitor service.
NOTE: All protocol strings are case sensitive.
Linux CEE Manual Configuration
CEE binaries, configuration, and log files are located in /opt/CEEPack directory.
Step 1 – Update the configuration file /opt/CEEPack/emc_cee_config.xml.
Step 2 – Restart CEE with /opt/CEEPack/emc_cee_svc restart command.
The CEE configuration file is located at /opt/CEEPack/emc_cee_config.xml. You need to add an
endpoint to the EndPoint node. In addition to the EndPoint node, you need to set Enabled to
1 in either Audit or VCAPS if the Activity Monitor is the only application getting events from
the CEE. If there are multiple applications, enable the delivery modes accordingly.
The EndPoint node's format is a semicolon-separated list of applications
in PartnerId@http://address-of-the-app:port format.
For the Activity Monitor use the following strings:
- For Audit,
StealthAUDIT@http://ip-address-of-the-agent:port - For VCAPS,
StealthVCAPS@http://ip-address-of-the-agent:port
Here's an example for the synchronous delivery (Audit):
<?xml version="1.0" encoding="utf-8"?>
<CEEConfig version="8.8.1.0">
<CEPP>
<Audit>
<Configuration>
<Enabled>1</Enabled>
<EndPoint>StealthAUDIT@http://[IP Address]:[Port]</EndPoint>
</Configuration>
</Audit>
...
<VCAPS>
<Configuration>
<Enabled>0</Enabled>
<EndPoint>StealthVCAPS@http://[IP Address]:[Port]</EndPoint>
<FeedInterval>60</FeedInterval>
<MaxEventsPerFeed>100</MaxEventsPerFeed>
</Configuration>
</VCAPS>
</CEPP>
Here's an example for the asynchronous delivery (VCAPS):
<?xml version="1.0" encoding="utf-8"?>
<CEEConfig version="8.8.1.0">
<CEPP>
<Audit>
<Configuration>
<Enabled>0</Enabled>
<EndPoint>StealthAUDIT@http://[IP Address]:[Port]</EndPoint>
</Configuration>
</Audit>
...
<VCAPS>
<Configuration>
<Enabled>1</Enabled>
<EndPoint>StealthVCAPS@http://[IP Address]:[Port]</EndPoint>
<FeedInterval>60</FeedInterval>
<MaxEventsPerFeed>100</MaxEventsPerFeed>
</Configuration>
</VCAPS>
</CEPP>
Make sure to set Enabled to 1 only in Audit or VCAPS if Activity Monitor is the only product
receiving activity from CEE. Otherwise, enable the modes according to all product requirements.
If you want to send activity to several 3rd party applications, separate them with semicolons.
<Audit>

<Configuration>

<Enabled>1</Enabled>

<EndPoint>Splunk@10.20.30.40:12345;StealthAUDIT@http://[IP Address]:[Port]</EndPoint>

</Configuration>

</Audit>
NOTE: All protocol strings are case sensitive.
Disk Quota Tab
The Disk Quota Tab is used to limit the size of logs to save disk space.
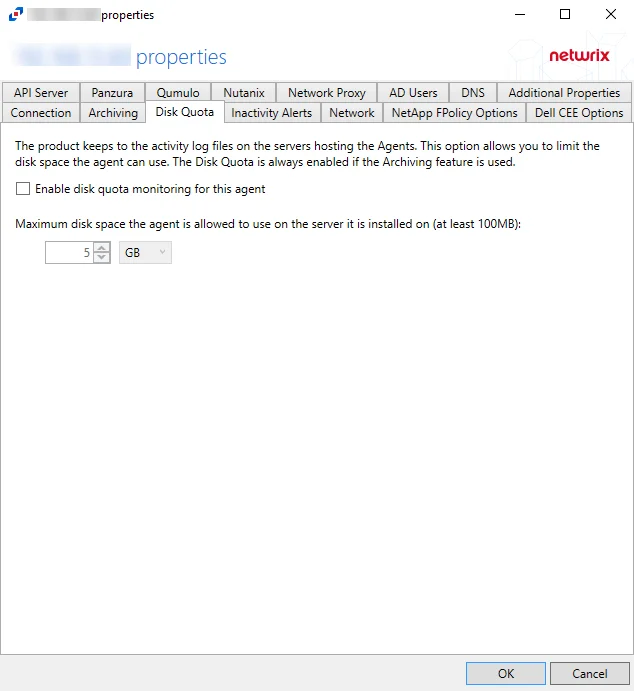
The configurable options are:
- Enable disk quota monitoring for this agent – Check the box to enable disk quota monitoring for the agent
- Maximum disk space the agent is allowed to use on the server it is installed on (at least 100MB) – Set the maximum disk space that is allowed to be used on the server to store log files. The default value is 5 GB.
Click OK to commit the modifications. Click Cancel to discard the modifications. The Agent Properties window closes.
DNS Tab
Use the DNS tab to customize how the agent queries and caches DNS results.
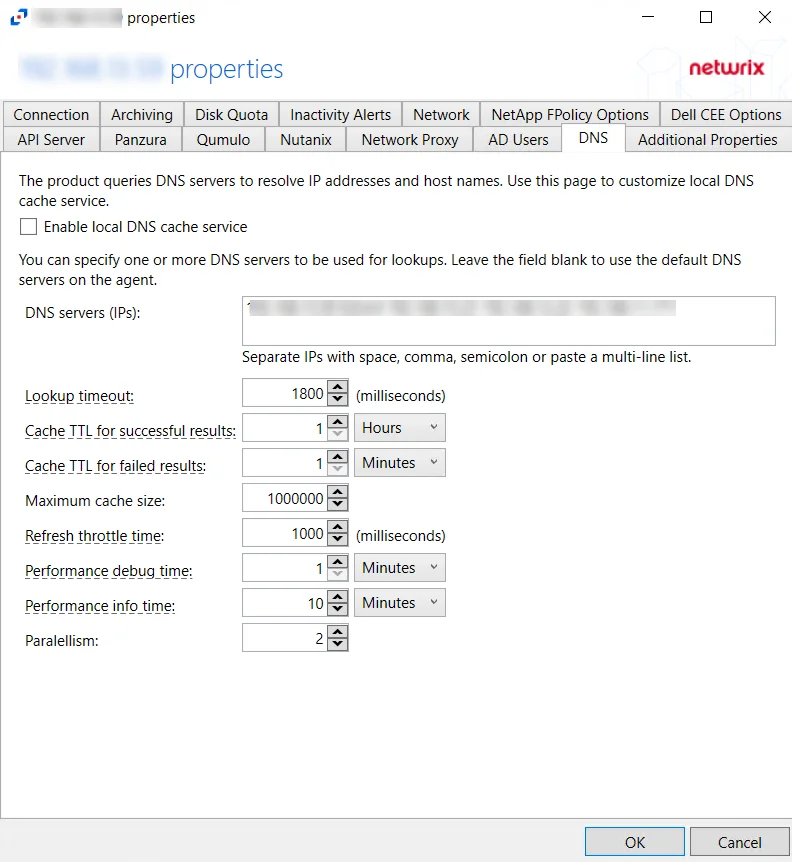
The configurable options are:
- Enable local DNS cache service – Select this checkbox to enable the local DNS cache service. Leave the option unchecked to disable the local DNS cache service. The DNS cache service proactively updates data, keeping DNS records up to date and available for real-time event reporting. Use this option if your DNS infrastructure cannot handle the load (requests take hundreds of milliseconds) during peak hours.
- DNS servers (IPs) – IP addresses of the DNS servers to be used for look-ups. IP addresses should be entered as separate addresses with space, comma (,), semicolon (;), or a multi-line list. Leave the box blank to use the default DNS server.
- Lookup timeout – Specify the time for look-up timeout in milliseconds. The default is 1800 milliseconds. If a DNS request fails to complete during the specified interval, the product reports an empty host-name or a previous result from the cache. The product continues to wait for a response in the background so that further events can use the result.
- Cache TTL for successful results – Specify the caching interval (time-to-live) for successful DNS
responses. The default is 1 hour. When a DNS query returns a valid IP address or host-name, the
response is cached for the specified time. The choice of TTL value depends on the environment: how
often IP addresses are reassigned; how much load the DNS server can handle. High TTL values reduce
the load on DNS servers but may result in stale data being reported.
If the DNS Cache service is used, the records are automatically updated when the TTL expires. - Cache TTL for failed results – Specify the caching interval (time-to-live) for failed DNS
responses. The default is 1 minute. When a DNS query cannot resolve an IP address or host-name,
the failed result is cached for the specified time. Caching of failed responses helps to reduce
the load on DNS servers and improve performance of event processing.
If the DNS Cache service is used, the records are automatically updated when the TTL expires. - Maximum cache size – Specify the maximum cache size. The default is 100000.
- Refresh throttle time – Specify the time interval between DNS queries that the DNS Cache service
uses to update expired records. The default is 1000 milliseconds.
If the DNS Cache service is used, the records are automatically updated when the TTL expires. This option allows you to limit the number of DNS requests the service sends to update the cache. A throttling period of 100 milliseconds will limit the update task to 10 requests per second. - Parallelism – Specify how many DNS requests the DNS Cache service is allowed to send in parallel. High values may overload DNS servers.
Click OK to commit the modifications. Click Cancel to discard the modifications. The Agent Properties window closes.
Inactivity Alerts Tab
The Inactivity Alerts tab, once enabled and configured, sends real-time alerts when the agent stops receiving events for a specific time frame. The tab varies based on the type of agent selected.
Check the Enable Inactivity alerting for this agent box to enable the options on this tab.
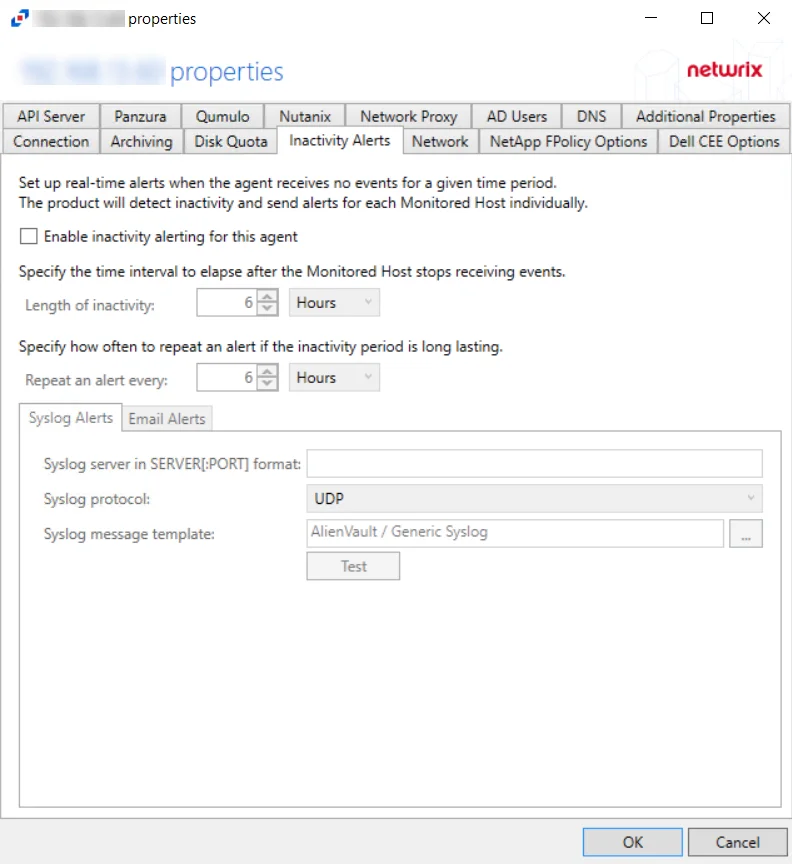
Once enabled, set the alerting parameters:
- Length of inactivity – Enter the number of Minutes, Hours, or Days for inactivity before an alert is triggered. The default is 6 Hours.
- Repeat an alert every – Enter the number of Minutes, Hours, or Days for an alert to be repeated if inactivity continues. The default is 6 Hours.
The two tabs at the bottom are for configuring the method used to send the alert:
- Syslog Alerts – Configure the application to send alerts to a SIEM platform
- Email Alerts – Configure the application to send alerts through an SMTP server
Click OK to commit the modifications. Click Cancel to discard the modifications. The Agent Properties window closes.
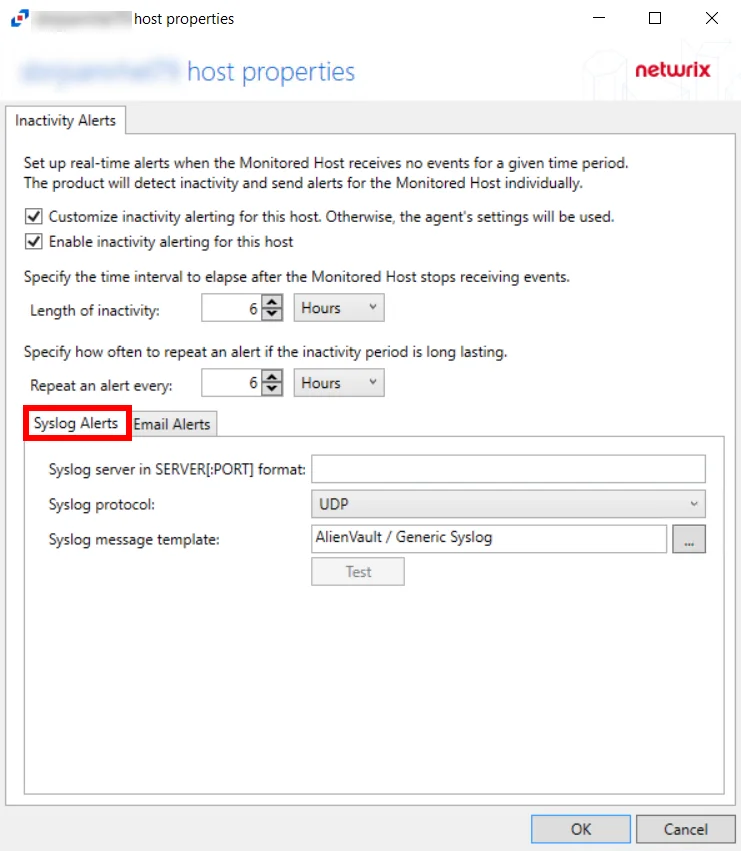
Syslog Alerts Tab
The Syslog alert sends a notification that the activity agent has not received event data for the configured interval. The alert is sent to the Syslog configured on the Syslog Alerts tab.
-
Syslog server in SERVER[:PORT] format – Type the Syslog server name with a SERVER:PORT format in the text box. The server name can be short name, fully qualified name (FQDN), or IP Address, as long as the organization’s environment can resolve the name format used.
-
Syslog protocol – Identify the Syslog protocol to be used for the alert. The drop-down menu includes:
-
UDP
-
TCP
-
TLS
NOTE: The TCP and TLS protocols add the Message framing drop-down menu. Message framing options include:
- LS (ASCII 10) delimiter
- CR (ASCII 13) delimiter
- CRLF (ASCII 13, 10) delimiter
- NUL (ASCII 0) delimiter
- Octet Count (RFC 5425)
-
-
Test Button – The Test button sends a test message to the Syslog server to check the connection. A connection status message displays with either a green check mark or a red X identifying the success of the sent test message. Messages vary by Syslog protocol:
- UDP – Sends a test message and does not verify connection
- TCP/TLS – Sends test message and verifies connection
- TLS – Shows error if TLS handshake fails
-
Syslog Message Template – Select the Syslog message template to be used. Click the ellipsis (…) to open the Syslog Message Template window. The Syslog template provided is AlienVault / Generic Syslog.
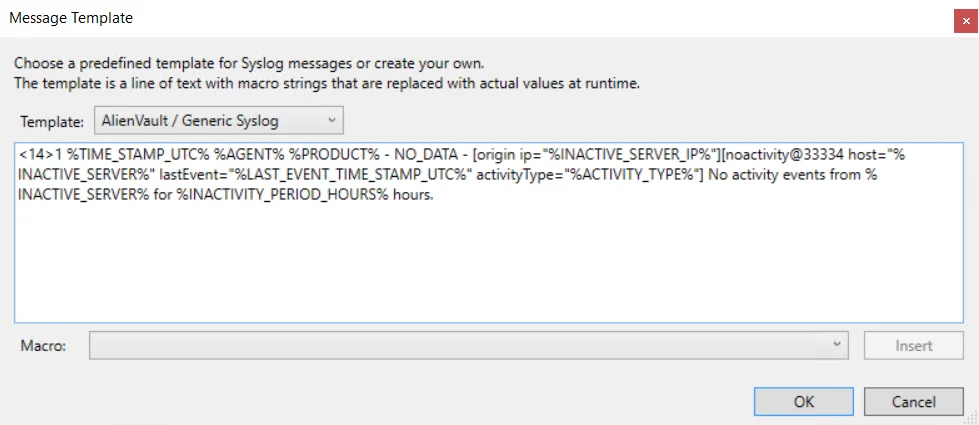
Custom templates can be created. Select the desired template or create a new template by modifying an existing template within the Syslog Message Template window. The new message template is named Custom.
Click OK to apply changes and exit, or Cancel to exit without saving any changes.
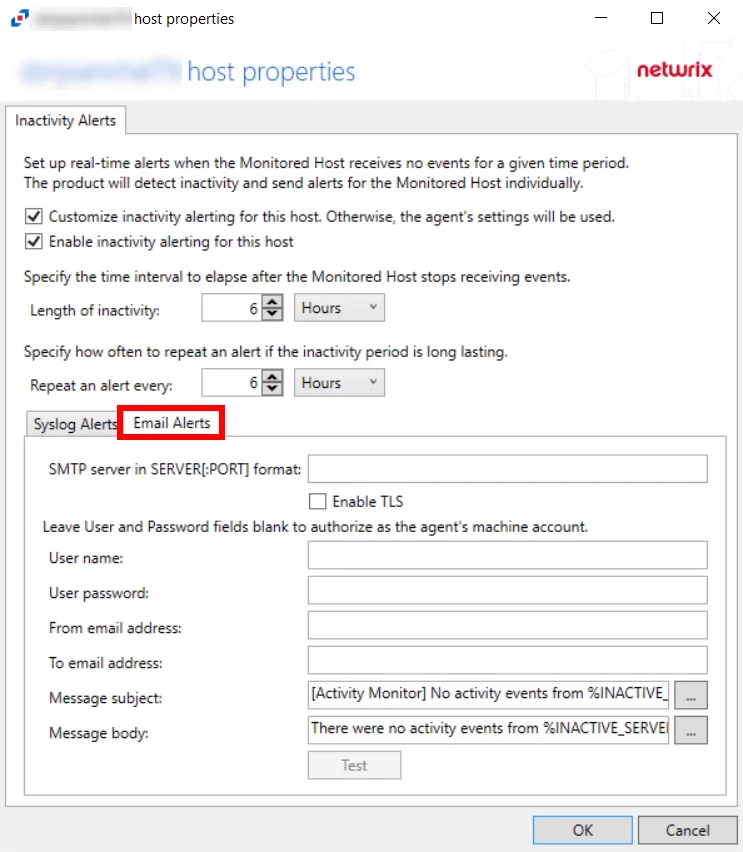
Email Alerts Tab
The email alert sends a notification that the activity agent has not received event data for the configured interval. The alert is sent to the configured recipients on the Email Alerts tab.
-
Syslog server in SERVER[:PORT] format – Type the SMTP server name with a SERVER:PORT format in the text box. The server name can be short name, fully qualified name (FQDN), or IP Address, as long as the organization’s environment can resolve the name format used.
- Check the Enable TLS box if an SMTP server requires TLS protocol.
-
User Name/Password – Specify credentials to send email alert. If using the current agent’s machine account, leave these fields blank.
-
From email address – Enter the Sender’s email address
-
To email address – Enter the Recipient’s email address. Multiple addresses are comma separated.
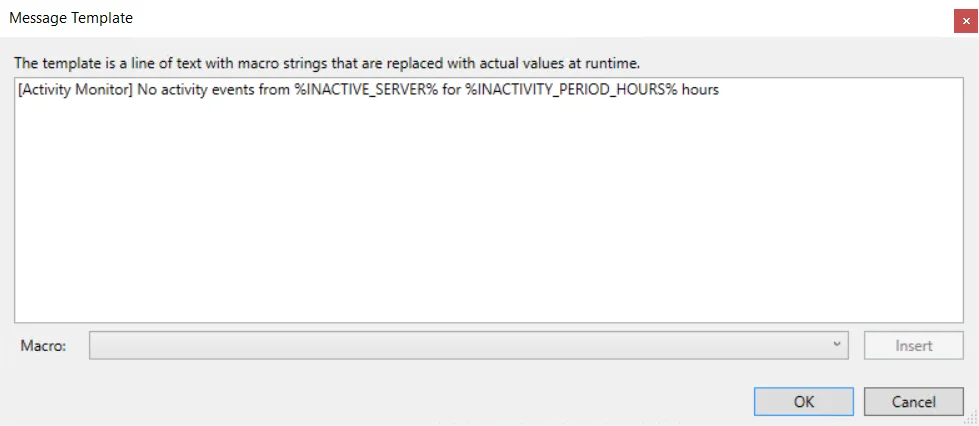
- Message subject – Click the ellipsis (…) to open the Message Template window to customize the subject. Macros can be used to insert
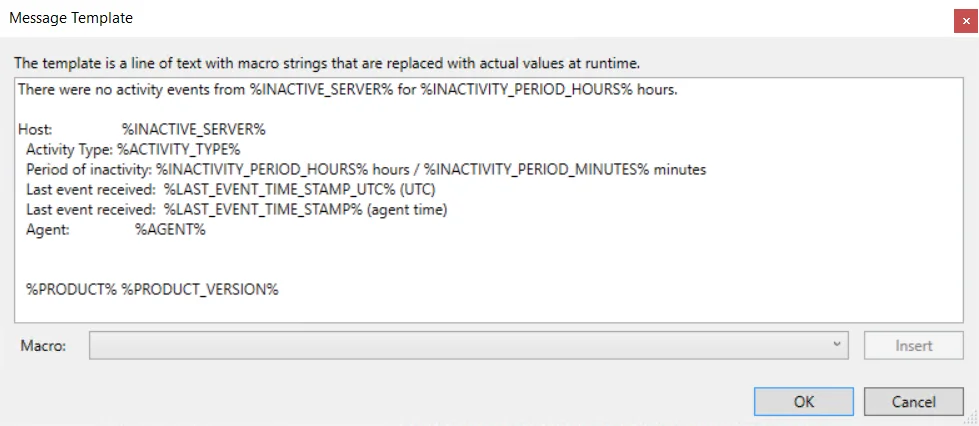
- Message body – Click the ellipsis (…) to open the Message Template window to customize the body
- Test – The Test button sends a test message to the receiver’s email address to check the connection. A connection status message displays with either a green check mark or a red X identifying the success of the sent test message.
Click OK to apply changes and exit, or Cancel to exit without saving any changes.
Macro Variables for Agents
Macros are text strings that are replaced with actual values at run time. The following Macro variables are available to customize the Syslog and Email message template:
| Macro | Definition |
|---|---|
| %SYSLOG_DATE% | Date/Time of the alert (local time, Syslog format) |
| %TIME_STAMP% | Date/Time of the alert (local time) |
| %TIME_STAMP_UTC% | Date/Time of the alert (UTC) |
| %AGENT% | Agent host name |
| %PRODUCT% | Product name |
| %PRODUCT_VERSION% | Product Version |
| %INACTIVE_SERVER% | Host name of the monitored host which stopped sending events |
| %INACTIVE_SERVER_IP% | IP address of the monitored host which stopped sending events |
| %LAST_EVENT_TIME_STAMP% | Date/Time of the last received call (local time) |
| %LAST_EVENT_TIME_STAMP_UTC% | Date/Time of the last received event (UTC) |
| %INACTIVITY_PERIOD_MINUTES% | Period of inactivity in minutes |
| %INACTIVITY_PERIOD_HOURS% | Period of inactivity in hours |
Linux Tab
The service user name configured during agent installation can be updated on the Agent Properties Linux Tab.
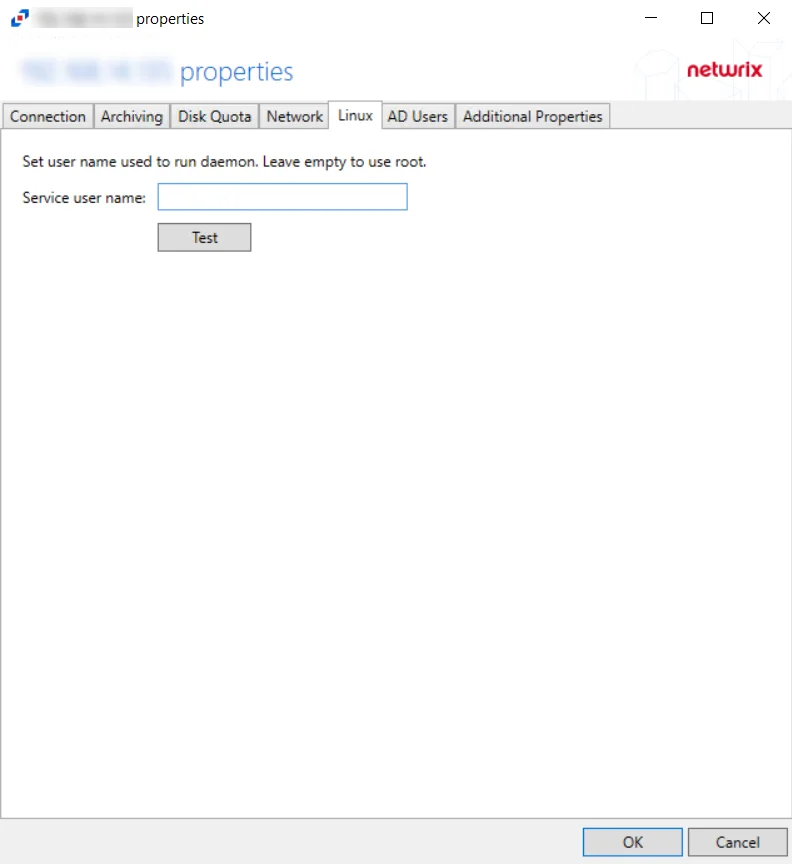
Enter a new service user name to run daemon and click Test to verify the connection.
Click OK to commit the modifications. Click Cancel to discard the modifications. The Agent Properties window closes.
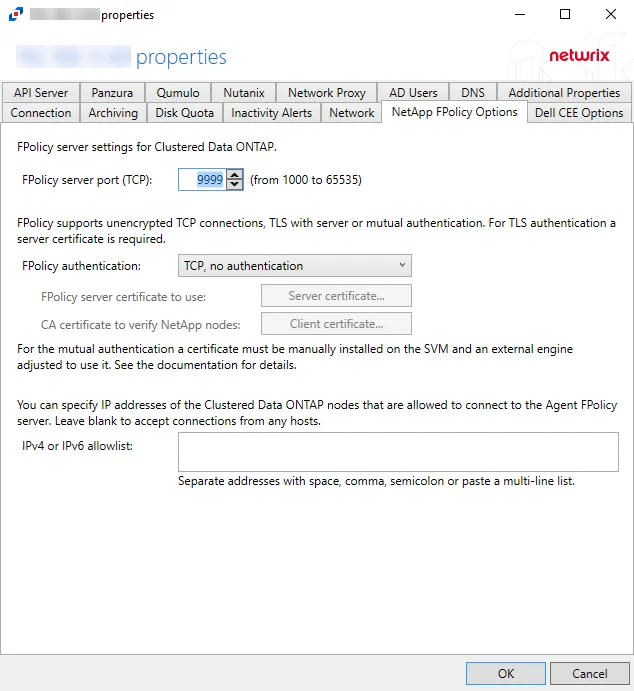
NetApp FPolicy Options Tab
The NetApp FPolicy Options tab provides options to configure FPolicy server settings for monitoring a NetApp Data ONTAP Cluster-Mode device.
The available options are:
-
FPolicy server port (TCP): [number] (from 1000 to 65535) – Enter the FPolicy server port. The default is 9999.
-
FPolicy authentication – Select from the following options in the drop-down list. For TLS server authentication, a Server certificate is required. For TLS, mutual authentication, a Server certificate and Client certificate are required.
- TCP, no authentication – Default setting, with no server authentication required
- TLS, server authentication – Click Server certificate to open the Server certificate window and import a certificate
- TLS, mutual authentication – Click Server certificate to open the Server certificate window and import a certificate, and Client certificate to open the Trusted client or CA certificate window to import a certificate
-
IPv4 or IPv6 whitelist – IP Addresses of the Clustered Data ONTAP nodes, which are allowed to connect to the FPolicy server, can be whitelisted by entering them in the box. IP Addresses should be entered as separate addresses with space, comma, semicolon, or a multi-line list. Leave the box blank to accept connections from any hosts.
Click OK to commit the modifications. Click Cancel to discard the modifications. The Agent Properties window closes.
Network Tab
Use the Network Tab to specify the network interface that NAS devices or API Server users use to connect to this server.
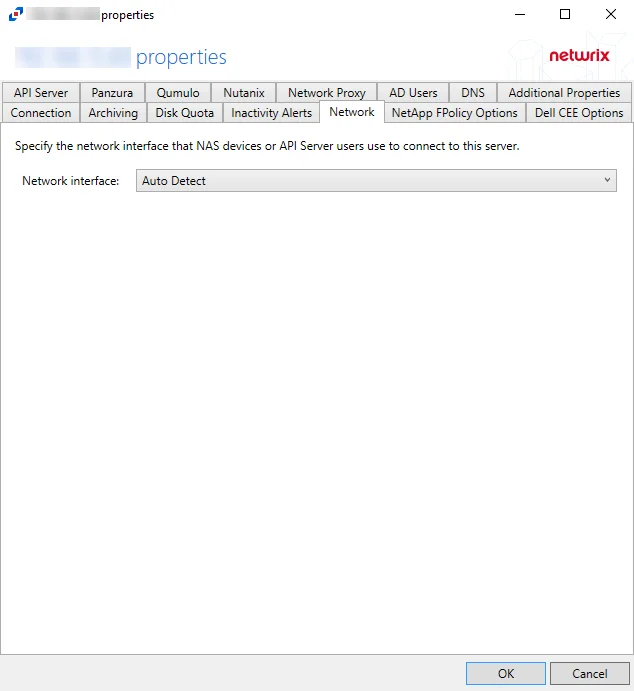
If an agent machine has multiple network adapters, network interfaces can be specified in the Network Tab. Select a network interface option from the Network Interface dropdown menu. The Network Interface is set to Auto Detect by default. Auto Detect will use the first network adapter or IP address that is found.
Click OK to commit the modifications. Click Cancel to discard the modifications. The Agent Properties window closes.
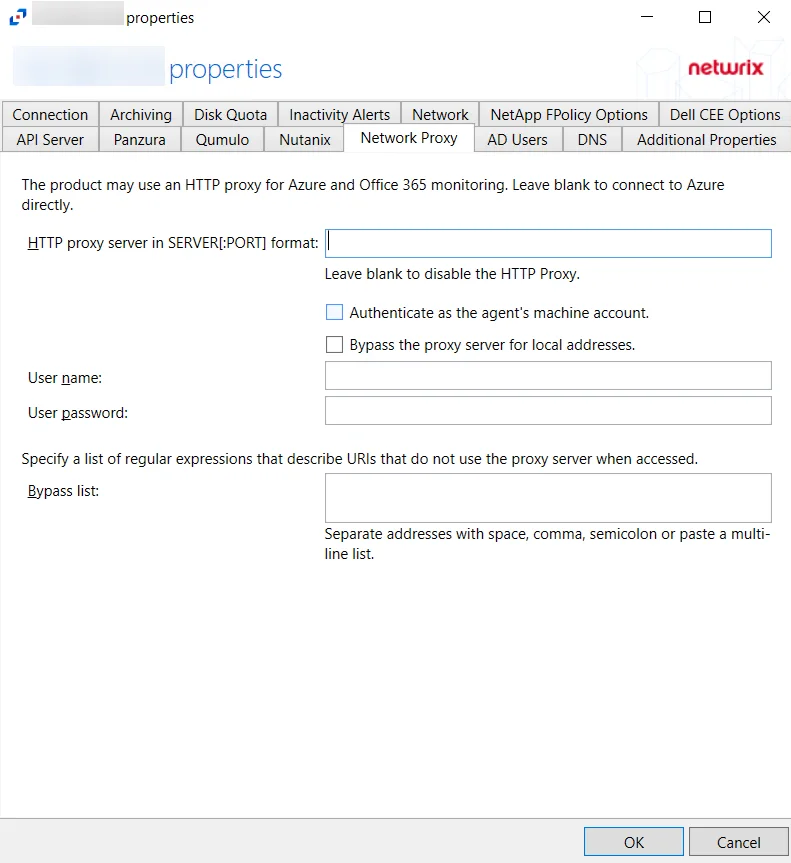
Network Proxy Tab
Use the Network Proxy tab to set the proxy for connection to Microsoft Entra ID (formerly Azure AD) and Office 365 monitoring. You can leave the properties blank to connect to Microsoft Entra ID directly.
The configurable options are:
-
HTTP proxy server in SERVER[:PORT] format – Specify the IP address or name and the port number of the proxy server to query Microsoft Entra ID and Office 365. You can leave this field blank to disable HTTP proxy.
-
Select one of the following checkboxes:
- Authenticate as the agent's machine account
- Bypass the proxy server for local addresses
-
User name – Specify a user name for the proxy server
-
User password – Specify a password for the user name
-
Bypass list – Specify the Bypass list. This is a list of URIs that do not use the proxy server when accessed. Multiple addresses can be entered separated by space, comma (,), semicolon (;), or as a multi-line list.
Click OK to commit the modifications. Click Cancel to discard the modifications. The Agent Properties window closes.
Nutanix Tab
The Nutanix tab provides features to configure settings for monitoring Nutanix devices.
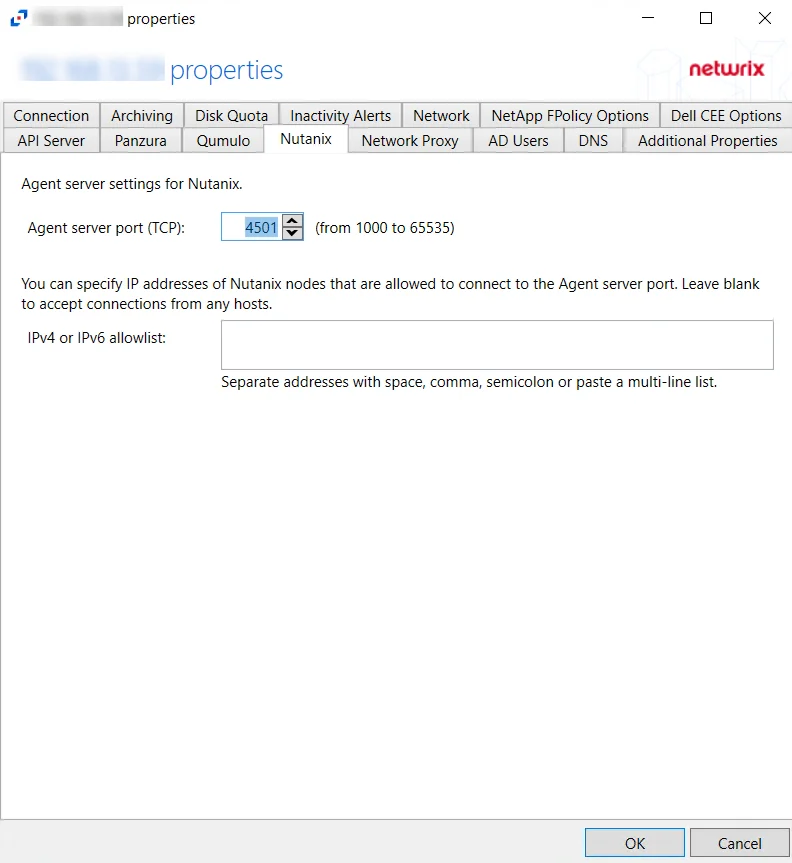
The available Agent server settings for Nutanix are:
-
Agent server port (TCP) – Enter the TCP port that Nutanix will use to connect to the agent. The agent will add the port to the firewall exclusions automatically. The default is 4501.
-
IPv4 or IPv6 allowlist – Specify the IP addresses of the Nutanix nodes, which are allowed to connect to the agent server port. Multiple addresses can be entered separated by space, comma (,), semicolon (;), or as a multi-line list. Leave the box blank to accept connections from any hosts.
NOTE: This setting is optional and it allows you to improve security by limiting the number of IP addresses allowed to connect.
Click OK to commit the modifications. Click Cancel to discard the modifications. The Agent Properties window closes.
Panzura Tab
The Panzura Tab provides features to configure settings for monitoring Panzura devices.
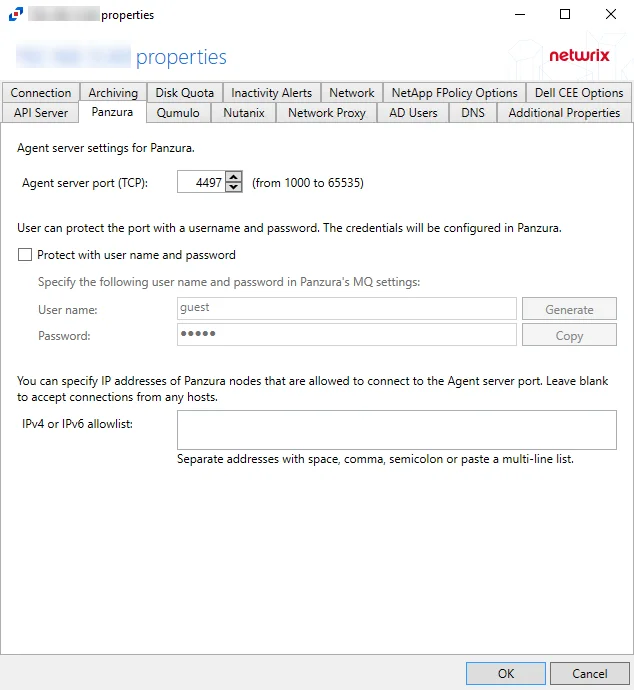
The available options are:
-
Agent server port (TCP) - Enter the agent server port. The default is 4497.
-
Users can protect the port with a username and password. The credentials will be configured in Panzura
- User name – Enter a custom user name or click Generate to create a random username and password
- Password – Enter a custom password or use the generated password. Click Copy to copy the user name and password to the clipboard.
-
IPv4 or IPv6 allowlist – IP Addresses of the remote hosts, which are allowed to connect to the API port, can be whitelisted by entering them in the box. IP Addresses should be entered as separate addresses with space, comma (,), semicolon (;), or a multi-line list. Leave the box blank to accept connections from any hosts.
Click OK to commit the modifications. Click Cancel to discard the modifications. The Agent Properties window closes.
Qumulo Tab
The Qumulo tab provides features to configure settings for monitoring Qumulo devices.
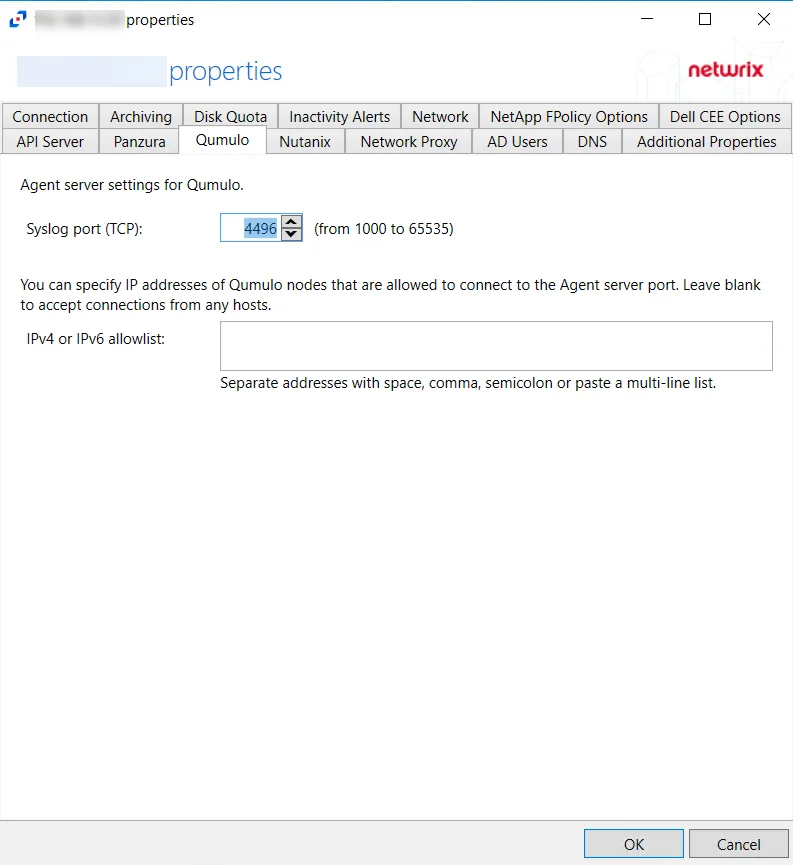
The available options are:
- Syslog port (TCP) – Enter the TCP port that Qumulo will use to connect to the agent. The agent will add the port to the firewall exclusions automatically. The default is 4496. The range of valid values is from 1000 to 65535.
- IPv4 or IPv6 allowlist – Specify the IP addresses of the Qumulo nodes, which are allowed to connect to the agent server port. Multiple addresses can be entered separated by space, comma (,), semicolon (;), or as a multi-line list. Leave the box blank to accept connections from any hosts.
Click OK to commit the modifications. Click Cancel to discard the modifications. The Agent Properties window closes.