EX_ServerMetrics Job
The EX_ServerMetrics Job provides visibility into server mail flow statistics, such as, sent, received, journaling, transport, and NDR counts and sizes.
Analysis Tasks for the EX_ServerMetrics Job
View the analysis tasks by navigating to the Exchange > 1. HUB Metrics > EX_ServerMetrics > Configure node and select Analysis.
CAUTION: Do not modify or deselect the selected analysis tasks. The analysis tasks are preconfigured for this job.
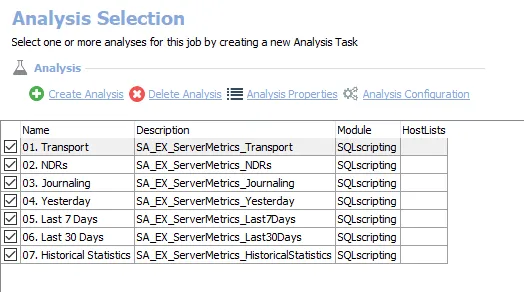
The following analysis tasks are selected by default:
-
- Transport – Creates the SA_EX_ServerMetrics_Transport table, accessible under the job’s Results node
-
- NDRs – Creates the SA_EX_ServerMetrics_NDRs table, accessible under the job’s Results node
-
- Journaling – Creates the SA_EX_ServerMetrics_Journaling table, accessible under the job’s Results node
-
- Yesterday – Creates the SA_EX_ServerMetrics_Yesterday table, accessible under the job’s Results node
-
- Last 7 Days – Creates the SA_EX_ServerMetrics_Last7Days table, accessible under the job’s Results node
-
- Last 30 Days – Creates the SA_EX_ServerMetrics_Last30Days table, accessible under the job’s Results node
-
- Historical Statistics – Creates the SA_EX_ServerMetrics_HistoricalStatistics table, accessible under the job’s Results node
In addition to the tables and views created by the analysis tasks, the EX_ServerMetrics Job produces the following pre-configured reports:
| Report | Description | Default Tags | Report Elements |
|---|---|---|---|
| Journaling (Journaling Traffic) | This report summarizes journaling message traffic across the organization. | None | This report is comprised of two elements: - Bar Chart – Displays top servers by journaling messages (last 30 days) - Table – Provides details on top servers by journaling messages (last 30 days) |
| NDRs (Exchange NDRs) | This report shows NDR counts broken down by server. | None | This report is comprised of two elements: - Bar Chart – Displays top servers by NDRs (last 30 days) - Table – Provides details on top servers by NDRs (last 30 days) |
| Server Traffic (Top Servers by Traffic) | This report summarizes server traffic across the organization for the Last 30 Days. | None | This report is comprised of two elements: - Stacked Bar Chart – Displays top servers by total traffic - Table – Provides details top servers by total traffic |
| Transport (Transport Messages) | This report summarizes transport messages across the exchange organization. | None | This report is comprised of two elements: - Bar Chart – Displays top servers by transport messages (last 30 days) - Table – Provides details on top servers by transport messages (last 30 days) |