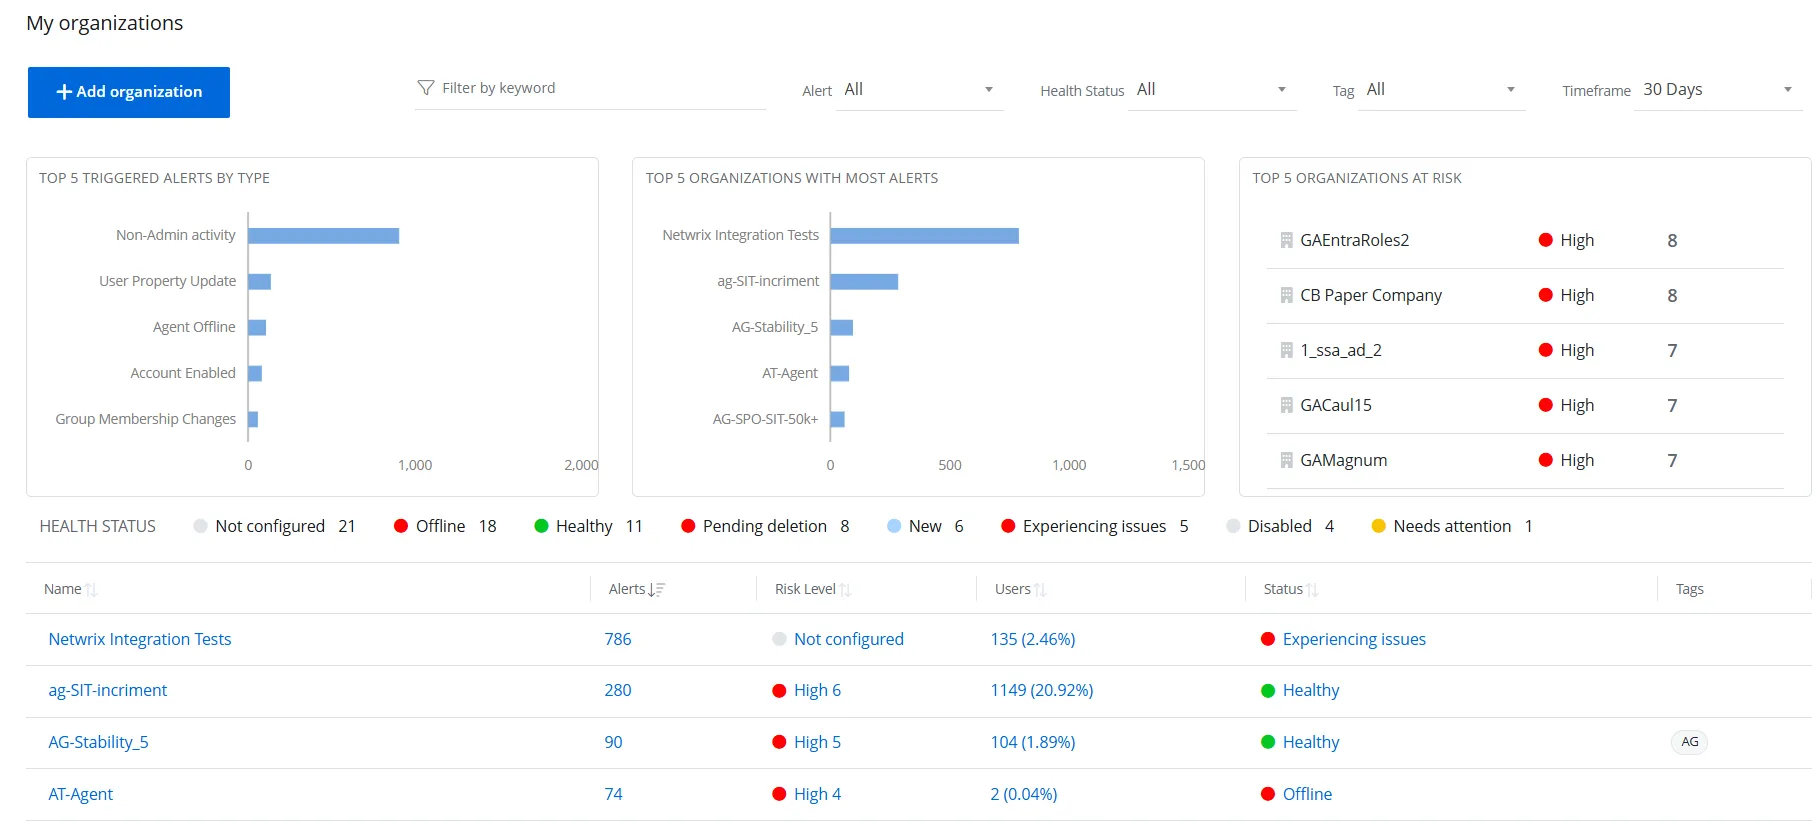
1Secure Dashboard
The Netwrix 1Secure dashboard provides an intuitive, single-pane-of-glass view of your clients organizations, enabling managing organizations, such as Managed Service Providers (MSPs), to quickly identify and prioritize what requires immediate attention. It displays the alerts triggered by specific events, offering drill-down capabilities that enable you to access detailed information on specific alerts and issues, ensuring timely and effective responses. See the Alerts topic for additional information on alerts.
Click Home at the top of the page to access the dashboard. This page is also the default landing page of the application when you sign in.
If you are a managed organization user, this page displays insights specific to your organization. See the Organization Statistics topic for additional information.
If you are a managing organization (MSP) user, this page provides insights for all your organizations.
Top 5 Triggered Alerts by Type
This card displays a bar chart that highlights the five most frequently triggered alert types. Hover over a bar to view the exact number of alerts for that type. Click a bar to navigate to the Alerts Timeline page. See the Alerts Timeline topic for additional information.
Top 5 Organizations with Most Alerts
This card displays a bar chart that highlights the five organizations with the highest number of triggered alerts. Hover over a bar to view the exact number of alerts triggered for that organization. Click a bar to navigate to the Alerts Timeline page. See the Alerts Timeline topic for additional information.
Top 5 Organizations at Risk
This card lists the five organizations with the highest risk levels. Each record includes the organization’s name, risk level (high, medium, or low), and the number of risks detected. Click a record to navigate to the Risk Assessment dashboard. See the Risk Assessment Dashboard topic for additional information.
Health Status
This bar lists the different health statuses assigned to organizations in the Organizations list, along with the number of organizations associated with each status.
Organizations List
This section lists all managed organizations with the following information:
-
Name – Displays the name of an organization. Click an organization name to navigate to the Organization Statistics page. See the Organization Statistics topic for additional information.
-
Alerts – Displays the total number of alerts triggered for the organization. Click the value to navigate to the Alerts Timeline page. See the Alerts Timeline topic for additional information.
-
Risk Level – Displays the risk level for the organization such as, high, medium, or low. Click the value to navigate to the Risk Assessment dashboard. See the Risk Assessment Dashboard topic for additional information.
-
Users – Displays the total number of users in the organization along with their percentage share with respect to the total number of users in the managed organizations (tenant) in 1Secure. Click the value to navigate to the Billable Users page. See the System Reports topic for additional information.
-
Status – Displays the current health status of the organization, which can be: Healthy, Trial in Progress, New, Update Recommended, Needs Attention, Experiencing Issues, Offline, Disabled, Not Configured, and Pending Deletion. Click the value to navigate to the Health Status for Organization:
<organization name>pane. -
Tags – Displays the user defined tag(s) applied to the organization.
Click a column header to sort the data in the organizations list by that column in ascending order. An arrow appears next to the column name to indicate the sort order. Click the column header again to sort the data in descending order.
Add Organization
Click the Add Organization button to add a new organization. See the Add Organizations topic for additional information.
Filter Data
Multiple filters are available on this page to enable you to filter data as desired. You can apply one or more filters at a time.
NOTE: Some filters apply to all data displayed on this page, while others are specific to the Organizations list.
-
Filter by Keyword – Type a search string (only alpha characters allowed) in the Filter by keyword field and press Enter. The Organizations list displays the data that matches the specified keyword.
-
Alert – Select an alert type from the Alert drop-down menu. The organizations with alerts triggered for the selected type are displayed in the list. By default, All is selected.
-
Health Status – Select a health status from the Health Status drop-down menu. The organizations with the selected heath status are displayed in the list. By default, All is selected . Other statuses are:
- Healthy
- Trial in Progress
- New
- Update Recommended
- Needs attention
- Experiencing Issues
- Offline
- Disabled
- Not configured
- Pending deletion
-
Tag – Select a tag from the Tag drop-down menu. The bar charts and the organizations list on the dashboard display data for the organizations the tag is associated with. By default, All is selected.
-
Timeframe – Select a time period from the Timeframe drop-down menu. The charts and the listing on the page display data for the selected time period. For example, if you select 7 Days, the data will reflect information for the past 7 days. By default, 30 Days is selected. Options are:
- 7 Days
- 30 Days
- 90 Days
- 365 Days